2019 MLB First Half Betting Recap: Historic Start for Favorites, Overs
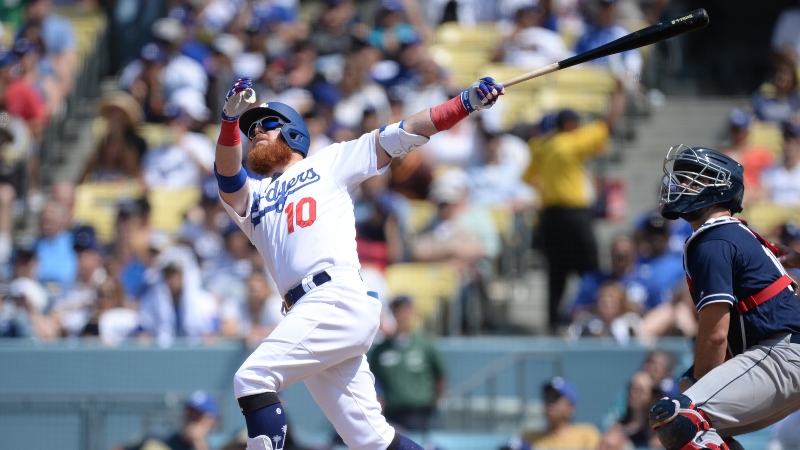
Gary A. Vasquez-USA TODAY. Pictured: Justin Turner
- With the MLB All-Star Break upon us, Josh Appelbaum breaks down the most notable first-half MLB betting trends.
- Favorites and over dominated the first half, which was completely outside the historical norm.
- NL teams won interleague play, the Rangers and Twins were profitable, and the Royals and Orioles continued to be abysmal.
The 2019 MLB All-Star Break is officially upon us. Although most teams have played between 88 and 91 games so far — roughly 54% to 56% of the 162-game schedule — this marks the unofficial halfway point of the season.
While most bettors will sit back and watch the Home Run Derby, the Midsummer Classic and enjoy some much-needed downtime from the daily grind of baseball betting, the hardcore baseball die-hards will be busy doing their homework over the next few days. Seamheads will be diving into the first half betting stats to learn what went right, what went wrong and how they can capitalize on specific edges in preparation for the second half.
With the help of our Bet Labs database, here are the major betting takeaways form the first half of the MLB season.
Favorites Dominated
Favorites finished the first half of the season 798-545 (59.4%), winning 2.2 units. This means that a $100-bettor taking every favorite ended up winning $220.
This might not seem like much of a profit, but you have to remember that historically favorites are a massive loser. Sure, they'll win more games than they lose, but because you're laying a big minus number (-120, -150, -200), you end up losing big in the end. Not to mention that you're often buying an overpriced number that the sportsbooks have shaded toward the popular side.
From 2005 to 2018, favorites went 19,498-14,489 (57.2%), losing 662.79 units.
This season, favorites are winning at a 2.4% increase compared to their historical average (59.4% vs 57.2%). It is the only year in our database where blindly betting favorites has been profitable.
In turn, underdogs have gone 545-798 (40.6%) this season, losing 55.03 units. From 2005 to 2018, underdogs went 14,489-19,489 (42.6%), losing 513.35 units. They are down 2% this year compared to their historical average.
Sweet Spots for Favorites
First-half favorites performed even better if you layer in a few filters and focus on specific spots.
Road favorites went 282-196 (59%), winning 8.1 units. Non-division road favorites were even better (161-103, 61%, +16.2 units).
Unpopular favorites receiving less than 50% of moneyline bets went 117-81 (59.1%), good for 12.51 units. This is known as the "Fade the Trendy Dog" system. Typically, casual bettors love betting favorites, so when they load up on a dog it creates a rare contrarian favorite play for sharp bettors.
We also saw a huge difference in favorite results depending on the direction of the line movement.
If a favorite saw the line move in its favor (think -120 to -130), those teams went 484-333 (59.4%), losing 15.29 units.
However, if the line moved away from the favorite, those teams went 293-193 (60.3%), winning 21.38 units.
Road Teams Outperformed Home Teams
Blindly betting home teams or road teams both were losing strategies in the first half, but road teams were the lesser of two evils.
Visitors finished 627-707 (47%), losing 16.14 units, while home teams went 707-627 (53%), losing 36.01 units.
This marks another historical aberration. From 2005 to 2018, home teams went 18,341-15,637 (54%, -514.28 units) while road teams won 46% of their games but lost 664.07 units.
In other words, road teams have performed 1% better and home teams have performed 1% worse so far this season compared to their historical averages.
Overs Also Dominated
Historically, unders have been a more profitable bet than overs. Why? Because the betting public loves sweating overs. After all, it's much more fun to root for a high-scoring game filled with base hits, homers and run scored. However, the books know this and will shade the total toward the over, forcing public over bettors to buy a bad number.
From 2005 to 2018, unders cashed at a 50.8% clip, but ended up losing 385.25 units because bettors had to pay the juice (-110, -115 or -120 on every play). Remember, in order to break even betting on totals you have to win 52.38% of your plays assuming -110 standard juice. If the juice is higher you need to win closer to 53% or more.
In turn, overs won a 49.2% rate from 2005 to 2018, losing a whopping 1,106.16 units.
However, we've seen the exact opposite happen during the first half of this season. Perhaps due to the juiced ball, overs have won at a 51.3% rate, winning 7.77 units. Meanwhile, unders have won 48.7% of the time, losing 65.23 units.
Like favorites, this is the first time in our database where blindly betting overs has been profitable. Overs are cashing at a nearly 2% higher clip this year compared to years past.
Over Sweet Spots
Overs were especially profitable in the first half when the focus was on a few specific angles.
Overs in division games have crushed so far this season, winning 52.2% of their games for +14 units. This is another bizzaro trend, as historically overs cashed at only a 49.5% rate from 2005-2018. Usually, the built-in familiarity between divisional opponents benefits unders because the pitchers know the hitters and where to attack their weak spots. The opposite has been true so far this season.
We've also seen a massive edge to overs in high-total games so far this season. When the total is 10 or more, the over has won 55.8% of the time, winning 23.68 units.
In comparison, the over has won at only a 50.2% clip (losing 15.91 units) when the total is 9.5 or less.
You would think overs would cash at a higher rate with a low total and unders with a high total. Not so much.
Betting Against the Public
Wiseguy contrarian bettors love betting against the public. In doing so, they can capitalize on Average-Joe bias, take advantage of over/underpriced and inflated/deflated lines and, best of all, place themselves on the side of the house, which we all know always wins.
So far this season betting against the public hasn't been terrible, but it also hasn't been as big a moneymaker as in the past. This is likely due to the public getting smarter due to information being more easily accessible than in years past.
During the first half of this season, the key "bet-vs.-public" threshold was less than 30% of bets. While a small sample size, the ultra-contrarian sub-15% spot also cashed bigly.
#MLB 1st Half Betting vs. Public
Teams <50% of bets 🔽
572-748 (43.3%), -12.3 units, -0.9% ROI<40% 🔽
368-532 (40.9%), -3 units, -0.3% ROI<30% 🔼
182-282 (39.2%), +4.1 units, +0.9% ROI<20% 🔼
40-66 (37.7%), +0.8 units, +0.7% ROI<15% 🔼
8-6 (57.1%), +7.5 units, 53.6% ROI pic.twitter.com/6pTXrL8RsN— Action Appelbaum (@Josh_Insights) July 8, 2019
National League Teams Won Interleague Play
In years past, you could hang your hat on death, taxes and American League teams dominating interleague play. This was perhaps due to the distinct advantage AL teams had in roster construction and the fact they featured a designated hitter.
From 2005-2018, AL teams won 54.3% of interleague games, winning an absurd 129.11 units.
However, this season NL teams have won the battle, winning 54.9% of games (+8.68 units). We actually saw this trend turn starting last year. In 2018, NL teams won 52.5% of their games (+6.59 units). Every single year before that (since 2005) AL teams had a winning record.
Rangers, Twins, Yankees, White Sox Most Profitable
The surprise team of the first half, at least from a betting standpoint, was the Texas Rangers. A $100-bettor taking the Rangers every game would be up $1,408 so far this season. The Twins (+13.96 units) finished a close second.
Despite a sub-.500 record, the White Sox (42-44) were a quiet cash cow for bettors (+10.08 units). That's due to their juicy plus-money dog prices each night and how undervalued they were each game.
In comparison, the Dodgers had a stellar 60-32 record but won only 4.9 units because they were such a public favorite with big minus-money prices every night.
#MLB 1st Half Betting Recap
Most profitable Teams
1 unit = $100#Rangers +14.08 units#Twins +13.96#Yankees +10.88#WhiteSox +10.08#Braves +6.5#Pirates +6.37#Dodgers +4.9#Athletics +4.55#DBacks +3.76#Astros +1.92#Padres +1.5#Giants +1.9 pic.twitter.com/IbZ8YmQZt2
— Action Appelbaum (@Josh_Insights) July 8, 2019
Royals, Tigers, Orioles Least Profitable
Six different teams lost more than 10 units in the first half, headlined by the god-awful Royals (-19.15 units), Tigers (-18.5 units) and Orioles (-17.06 units).
For those keeping score at home, bettors have now lost 68.94 units betting on the Orioles since the start of last season and 42.73 units betting on the Royals. Talk about disgusting.
#MLB 1st Half Betting Recap
Least profitable teams
1 unit = $100#Royals -19.15 units#Tigers -18.15#Orioles -17.06#Jays -15.7#Mets -13.09#Mariners -10.69#RedSox -9.17#Nats -6.22#Cardinals -4.07#Phillies -3.47#Cubs -3.46#Brewers -3.33https://t.co/KpOt5sFtZ7pic.twitter.com/N9t7ZM56ln
— Action Appelbaum (@Josh_Insights) July 8, 2019
The big surprise loser on this list is the Red Sox. The defending champs are 49-41 so far, yet they've lost 9.71 units. This speaks to how overvalued they are. The public rides them every night but they've been big underachievers.
Best Over/Under Teams
When it comes to a pronounced over/under edge, the Mariners and Reds were first-half kings for their respective bet types.
Seattle's high-powered offense, putrid starting pitching and softball-throwing bullpen led to an over-cashing machine for baseball bettors, as overs profited 22.51 units in Mariners' games.
The Pirates (+18.67 units) were a close second for the best first-half over team, followed by the Red Sox (+13.32), Mets (+12.73), Yankees (+10.22) and Giants (+9.28).
For unders, no team came close to the Reds. The under cashed +20.56 units in Cincy games. The next closest under teams were the Astros (+6.76) and Indians (+6.15).
What do you think?
Is this crazy first half for favorites and overs a sustainable trend? Or will dogs start to bark and unders strike back in the second half, leading to a regression to the mean?
Be sure to download our app so you can track your bets all throughout the second half. Also bookmark our MLB homepage so you can monitor all lines, percentages, live scores and read our daily MLB Sharp Reports from now until the final out of the World Series.
How would you rate this article?


