Three NASCAR Prop Bets for Sunday’s O’Reilly Auto Parts 500 at Texas
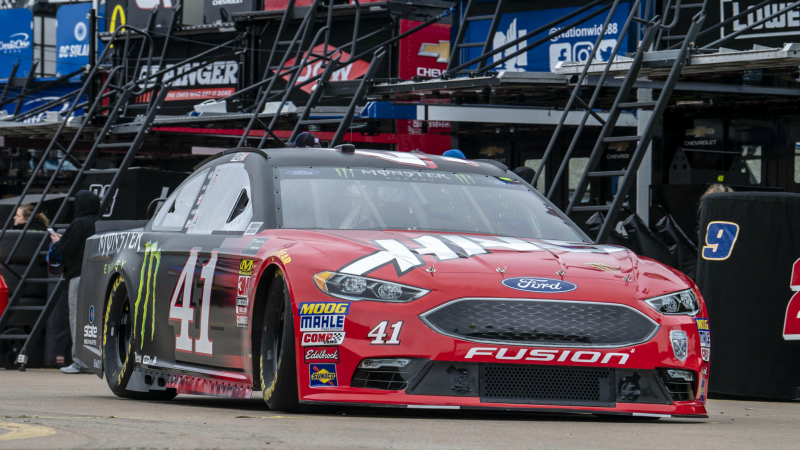
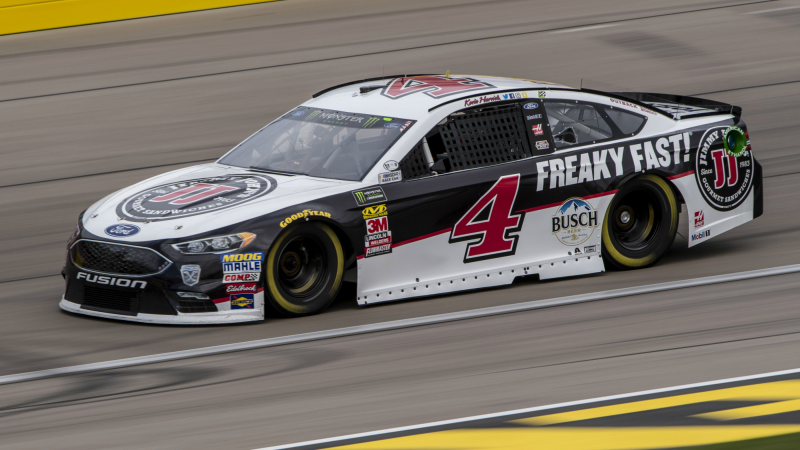
Jerome Miron-USA TODAY Sports. Pictured: Kurt Busch
NASCAR took last week off to celebrate April Fools' Day, but this week it's back and ready to rock the Texas Motor Speedway (TMS), which is a high-banked 1.5-mile quad-oval with fast speeds and a surface that was repaved less than two years ago.
Plus, it was the site of the 1997 Blockbuster Rock Fest, which featured Bush, No Doubt, and a lot of other artists (cough) whose songs you guiltily sing when no one else is around. And by "you," I mean "me." Don't speak.
Per usual, I am relying on the machine learning statistical models and similarity scores at RotoViz. When sorting through the head-to-head driver props for Texas, I’ve opted to focus most on projected finishing position as well as short- and long-run final practice times, year-to-date performance, track history, and starting position.
Kyle Larson (+125) over Kyle Busch (-155)
In the three TMS races since the track was repaved, Larson has had the better driver rating (95.2 vs. 93.3), average running position (11.0 vs. 14.0), quality pass percentage (32.9 vs. 31.4), and laps led percentage (6.5 vs. 3.2). Busch has been better in 2018 (110.0 driver rating vs. 91.2), but Larson and Busch have comparable starting spots (eighth and 10th), and Larson was significantly better in final practice with the fourth- and sixth-fastest 10-lap and single-lap averages; Busch had the sixth- and 11th-fastest marks. In the RotoViz model, Larson has a projected finishing position of 6.5; Busch, 7.33.
Kurt Busch (+110) over Erik Jones (-140)
The elder Busch (pictured above) qualified for the pole, and starting position matters at TMS. Busch has the better 2018 driver rating (92.2 vs. 84.2) as well as the better track-specific driver rating (86.9 vs. 77.9), average running position (13.0 vs. 15.0), and quality pass percentage (44.2 vs. 39.7). Although Jones had the faster final-practice 10-lap average (second vs. ninth), he is at a distinct disadvantage by starting 21st. Busch easily has the superior median sim score (7.5 vs. 12.5), and he also has the higher projected finishing position in the models (7.16 vs. 11.58).
Jamie McMurray (+125) over Ryan Newman (-140)
Since the repaving, McMurray has been embarrassingly better than Newman at TMS, sporting the superior driver rating (82.5 vs. 63.5), average running position (12.8 vs. 20.2), and quality pass percentage (37.8 vs. 11.0). Newman has the better 2018 driver rating (78.4 vs. 63.6), which might be why he's favored, but McMurray has slightly better starting position (24th vs. 25th) and the notably faster final-practice single-lap speed (25th vs. 30th). McMurray bests Newman with the better sim score (19 vs. 23.5) and projected finishing position (18.01 vs. 23.19). McMurray is yet to place in the top 10 this year, but at last year's spring TMS race he finished seventh.
How would you rate this article?


