
How Turnover Luck Could Impact College Football in 2021

Joe Robbins/Getty Images. Pictured: Jaylin Williams.
After highlighting the nation's most lucky and unlucky teams based on point differential, I've moved to looking at which teams were helped or hurt the most in the turnover department.
Turnovers are often very random, and it's hard to predict turnover margin from year to year. Typically, teams that were either helped or hurt significantly by turnovers tend to regress to the mean in the next season.
With turnovers being such an important factor in who actually wins the game, it can be useful to look at which teams may see a reversal in turnover luck in 2021.
![]()
![]()
![]()
Turnover EPA/WPA
One way to look at which teams benefitted the most from turnovers is by EPA and WPA. EPA stands for Expected Points Added, and WPA stands for Win Probability Added.
WPA looks at how much an individual play contributed to the team's probability of victory. This data was filtered so that only turnovers were included (shoutout to @cfbfastR). The first graph represents how each team benefitted from turnovers from an EPA perspective, and the second uses WPA.
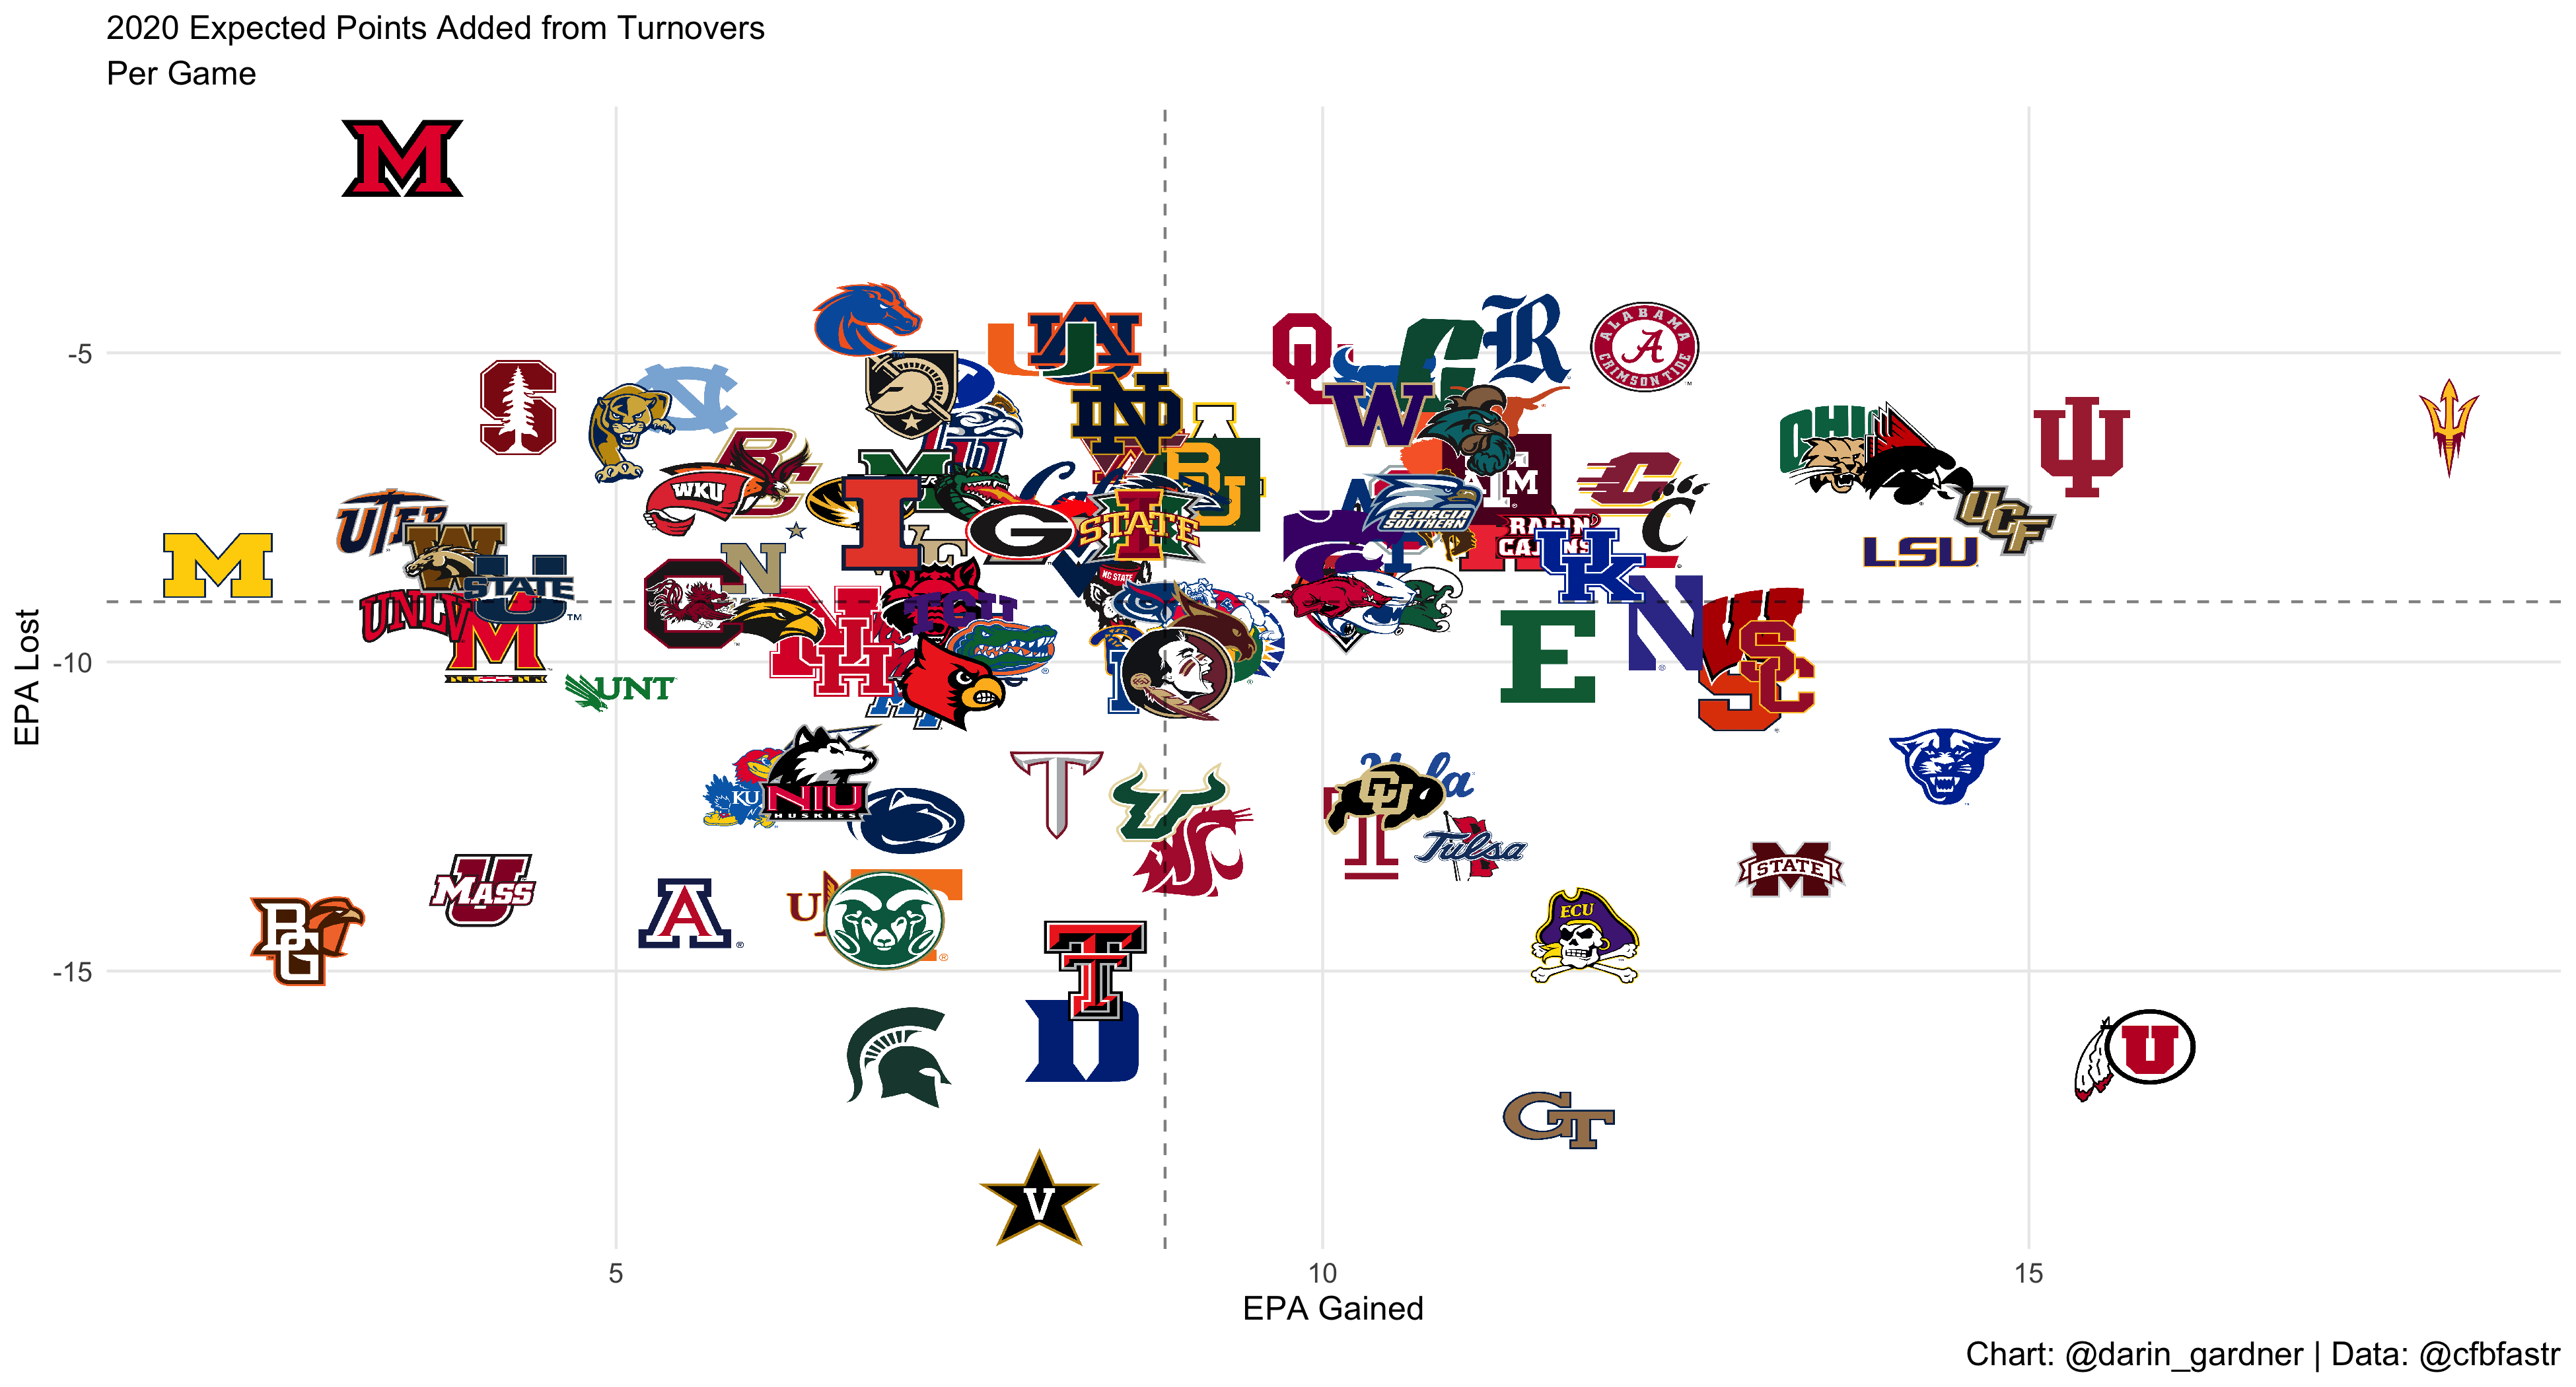
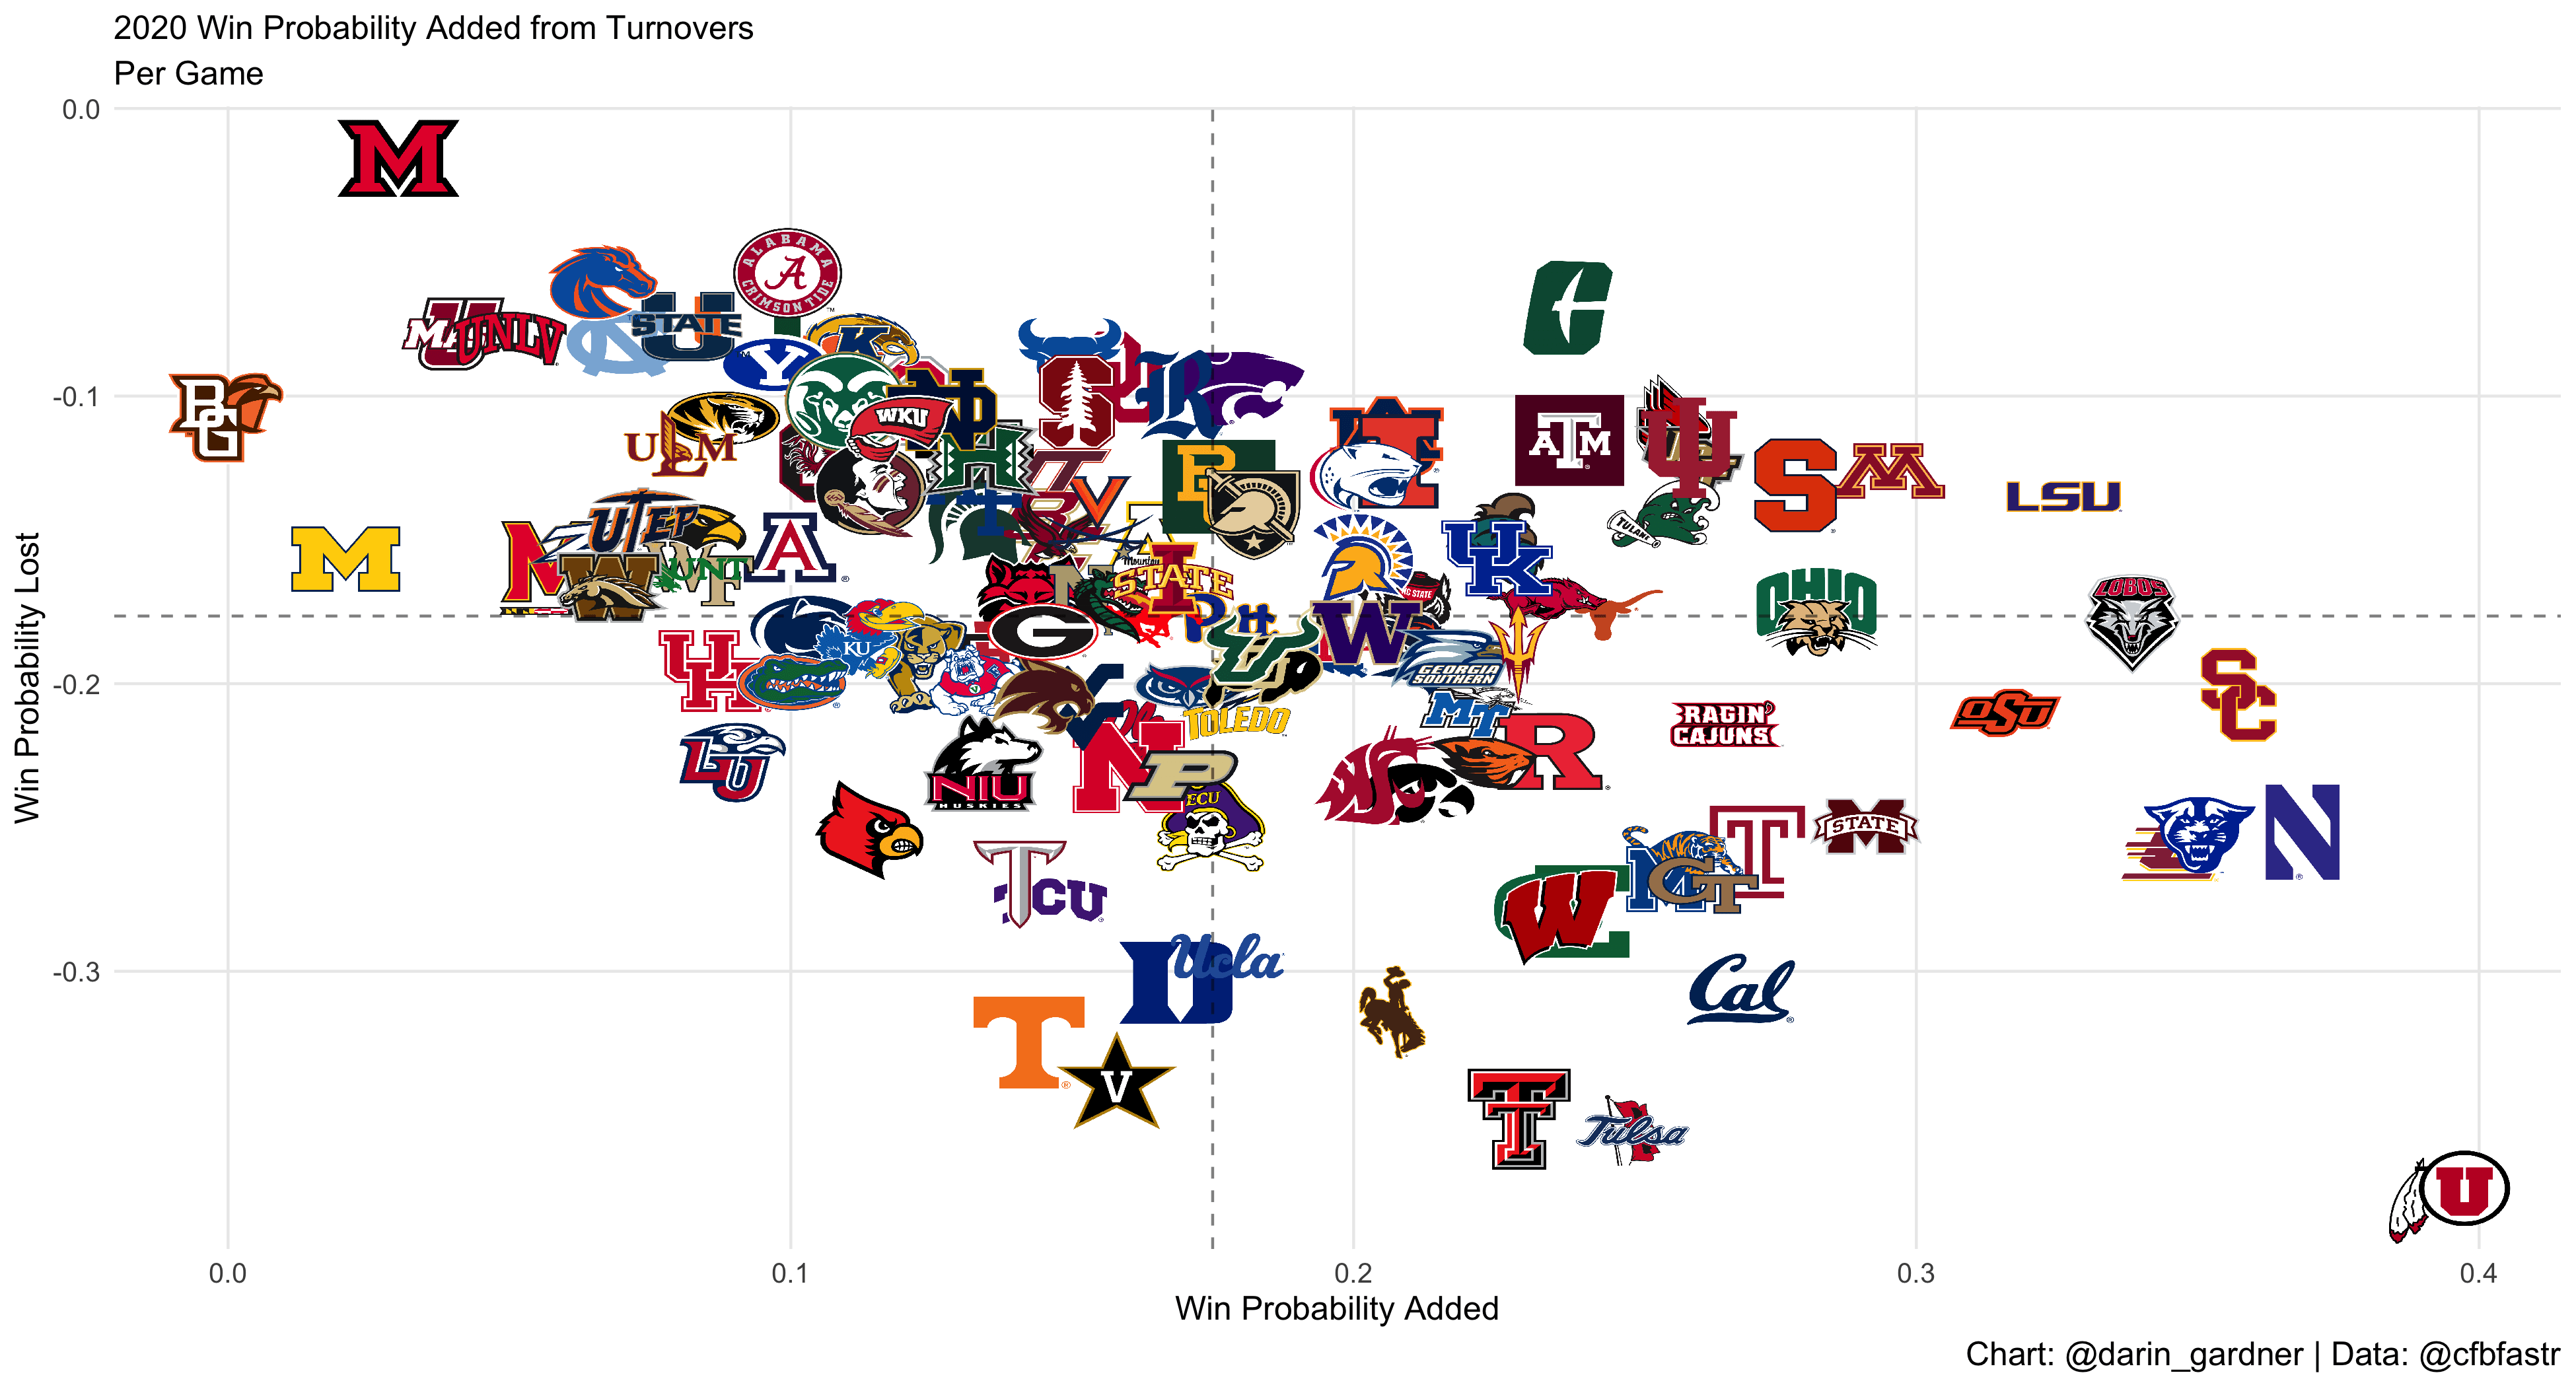
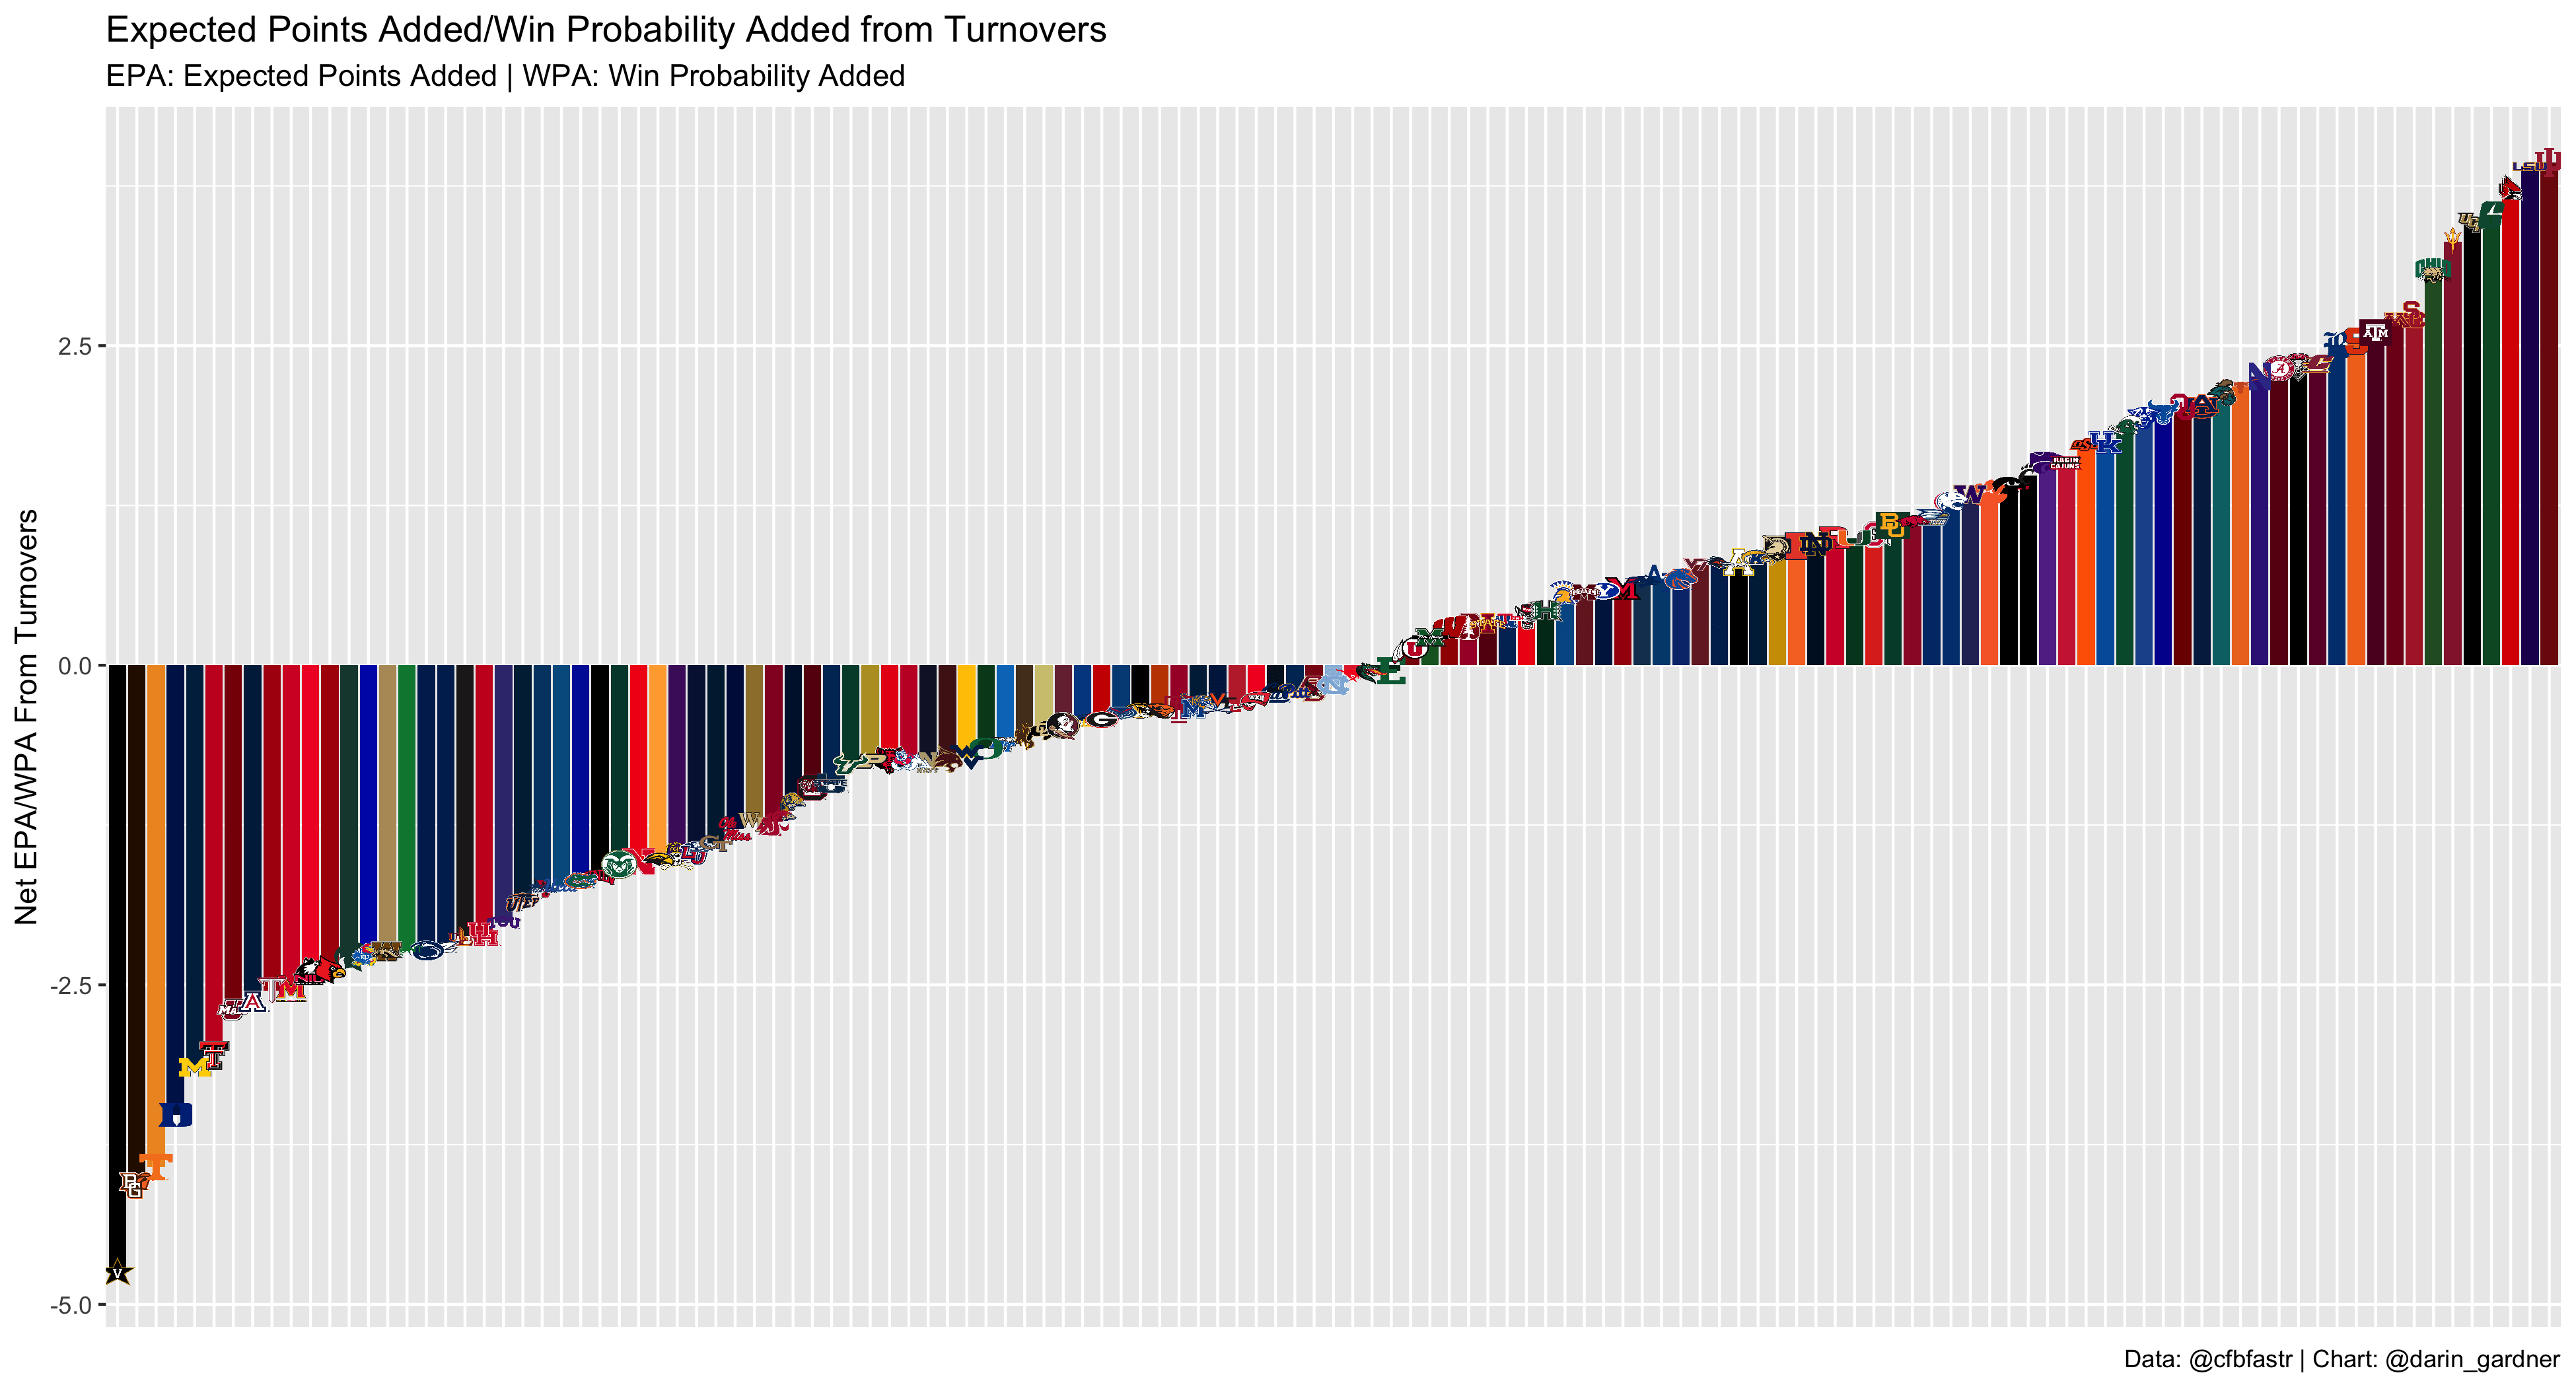
In the charts above, teams in the upper right quadrant were the ones that benefitted the most from turnovers. The bottom left shows teams that were unlucky in that regard. The chart below is a matrix between the two.
To get a combined EPA/WPA score, I converted the data into Z-Scores in order to standardize each team's ranking.
According to this data, Indiana benefitted from turnovers more than any other team in the country. The Hoosiers gained over 123 expected points from turnovers and lost just 52 expected points from turnovers of their own.
Their net turnover margin netted 71 expected points and gained 1.13 cumulative wins. The defense came down with 17 interceptions in just eight games for a rate that blew every other defense out of the water. You'd have to go back to 2015 to find the last defense that averaged at least two interceptions per game.
Hopefully for Indiana, the return of quarterback Michael Penix will outweigh the likely regression in the turnover department.
LSU gained 1.9 wins from net turnovers, a mark that led the country in 2020. The Tigers disappointed badly last season, but they can't blame it on bad turnover luck. LSU gained 142 expected points off opponent turnovers, which was second to only UCF last year. The Tigers was very opportunistic when it forced turnovers, scoring five defensive touchdowns in 10 games.
Freshman cornerback Eli Ricks returned two of his four interceptions for touchdowns. The defense as a whole should definitely improve this season, but even if it does, it probably won't manage to score a defensive touchdown in 50% of games again.
There were four teams that cumulatively lost at least 1.5 expected wins due to turnover differential: Vanderbilt, Tennessee, Duke, and Louisville.
Vanderbilt managed to rank last in the nation in EPA/WPA turnover differential despite having a +3 fumble differential. However, the Commodores threw 11 picks and came down with just two.
Duke was also generous with interceptions, tossing 19 in 11 games. Louisville had one of the worst fumble differentials in the nation at -5 and threw 12 interceptions while only coming away with five of its own.
Interceptions
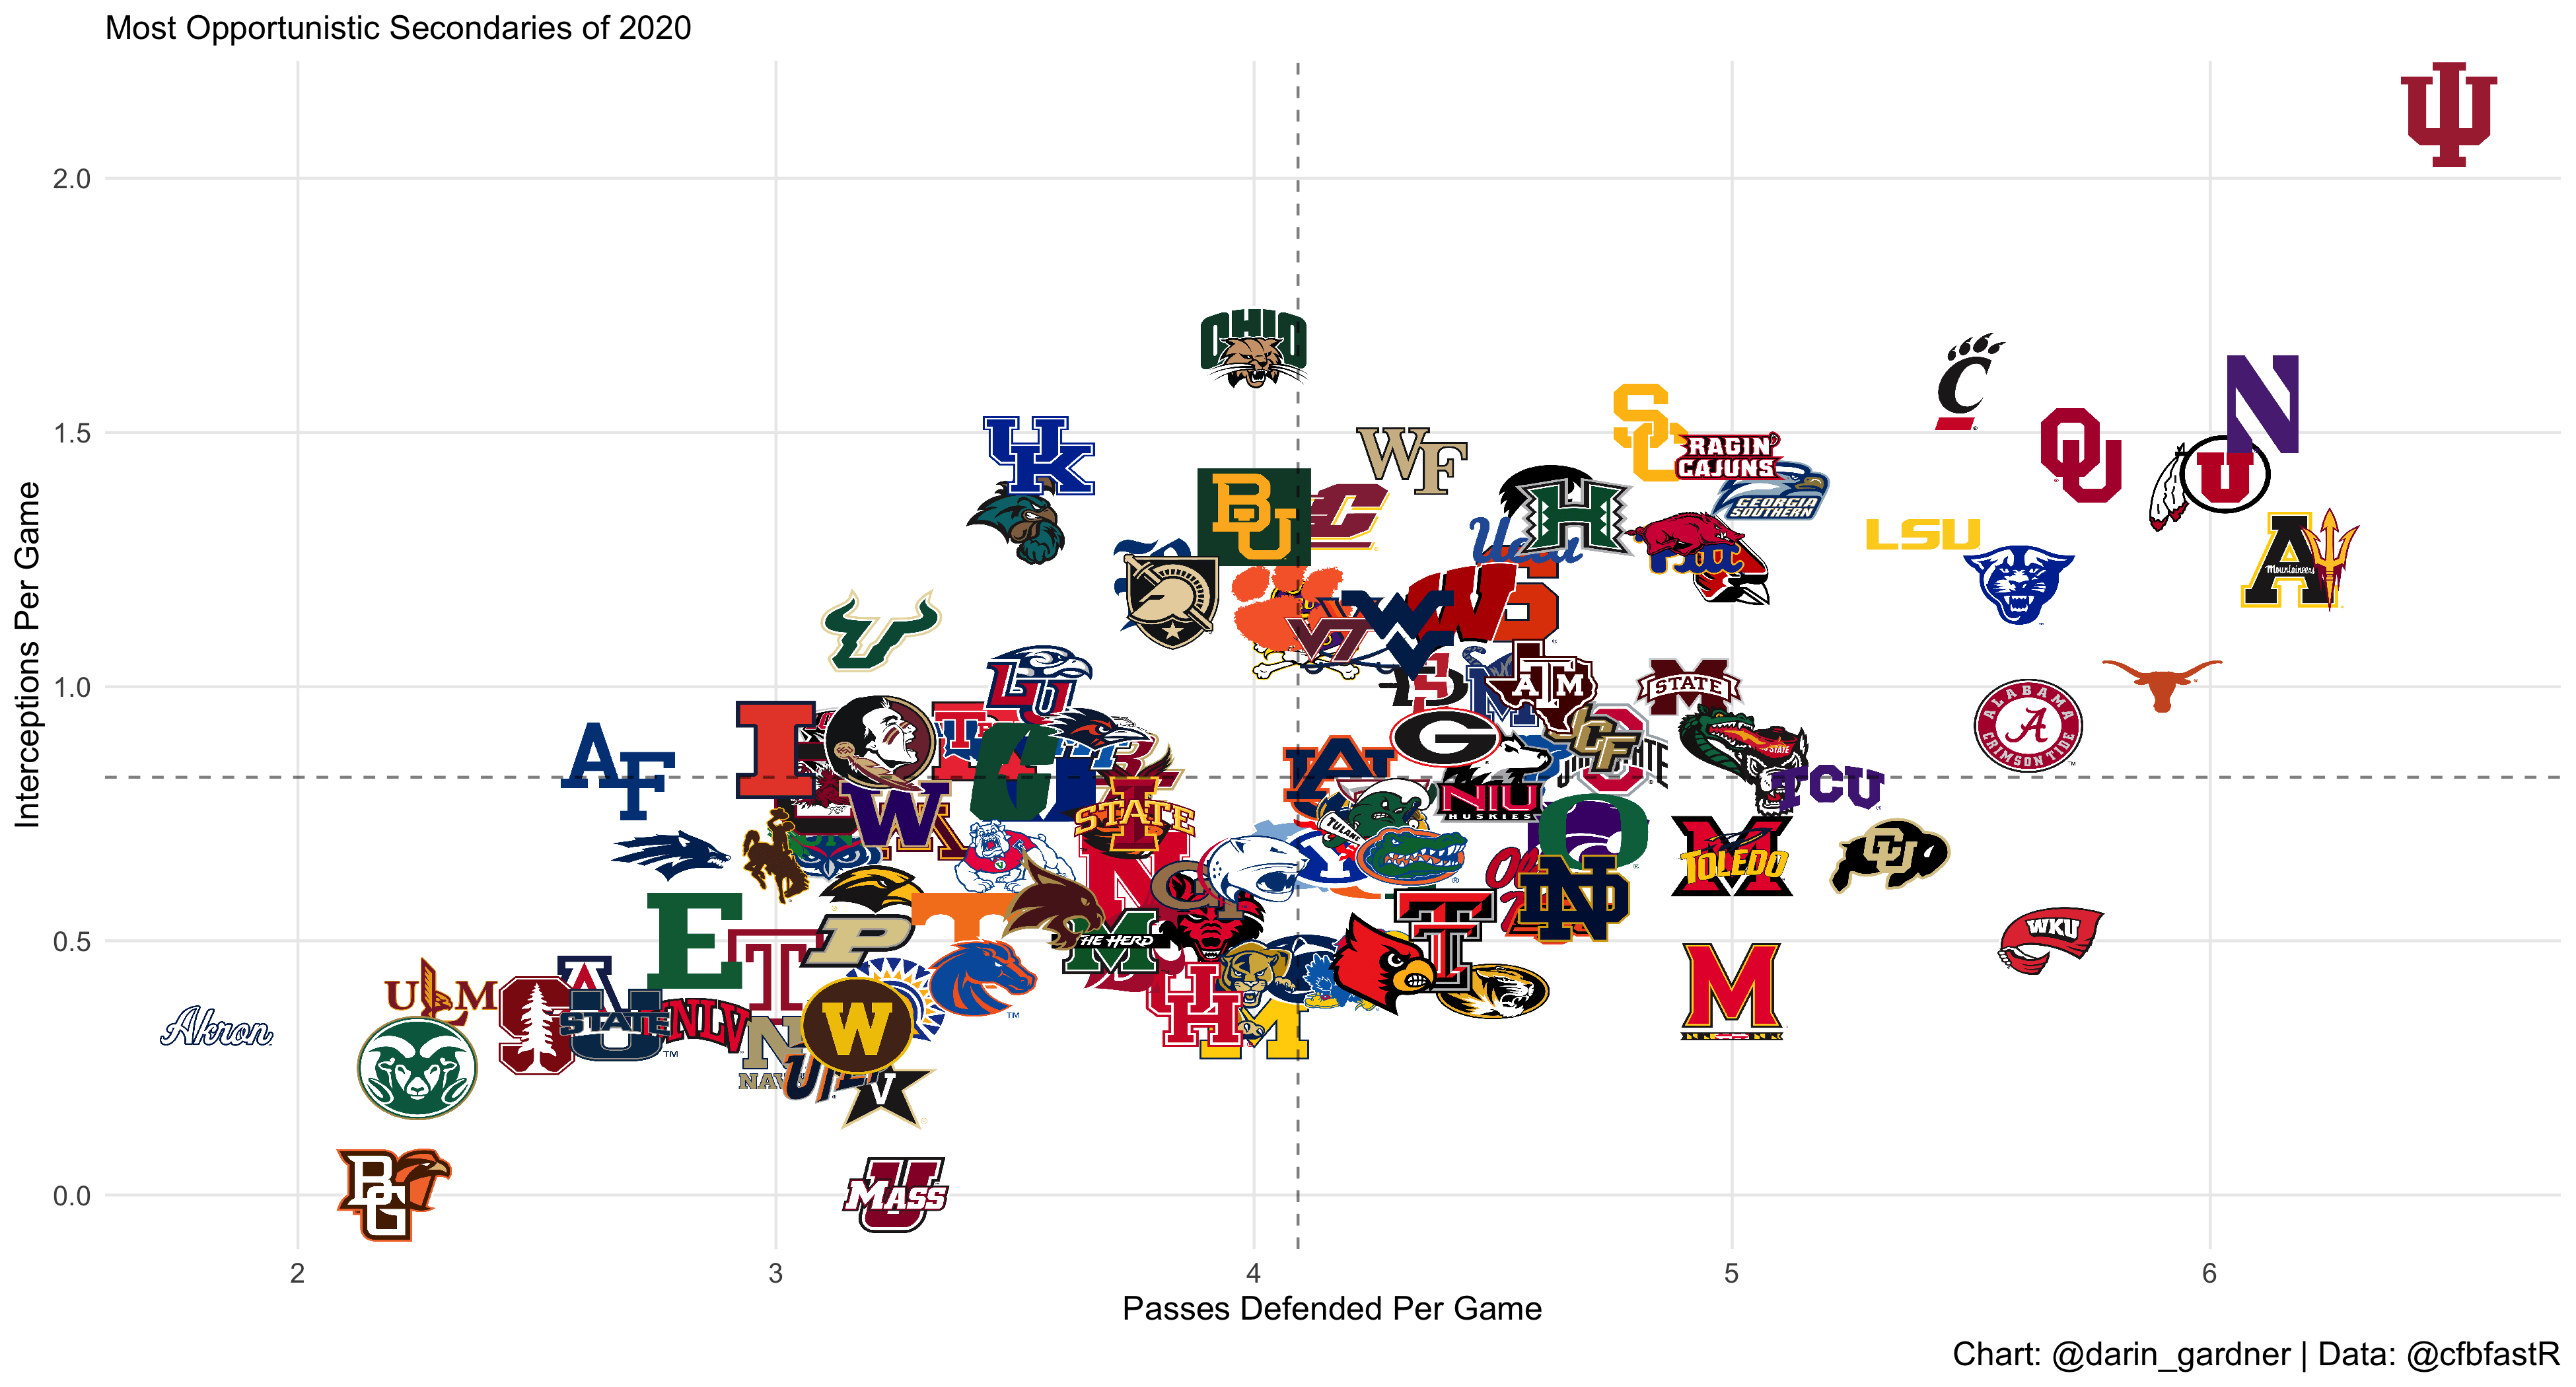
Another way to look at turnover luck is by how often the defense came up with a pick when getting a hand on the ball.
To do this, we can look at total passes defended compared to total interceptions. Two teams had an interception-to-passes defended ratio higher than 40%: Ohio (small sample caveat) and Kentucky.
The Bobcats recorded five interceptions and had 12 pass breakups, while Kentucky intercepted 16 passes with 39 pass breakups.
As I noted earlier, Indiana really benefitted from turnovers last year. It helps to have a top-10 ranking in interception-to-pass breakup ratio while also leading the country in passes defended per game. It's rare to see a team lead the nation in pass breakups per game and manage to intercept almost a third of those breakups.
Toward the bottom, one team worth highlighting is Western Kentucky. The Hilltoppers were great at breaking up passes, which has been par for the course with them recently. However, they did not turn many of those breakups into interceptions.
Western Kentucky racked up only six interceptions on 68 pass breakups, which meant it was only one of only nine teams to have an interception rate below 10%. The Hilltoppers should put up a lot more points after their offensive overhaul, and a likely turnaround in interception luck could give them another boost as well.
UMass and Bowling Green tend to find themselves in the bottom left corner of every chart imaginable, and this one is no different. The two teams broke up 24 passes combined without turning a single one into an interception. The Minutemen and Falcons were the only two teams in the country to not record an interception over the course of the season.
Penn State and Michigan were two teams from the Big Ten East that really disappointed a season ago. The two most talented teams in the conference — outside of Ohio State — both finished below .500 in 2020.

![]()
![]()
![]()
Only one team finished below .500 once between the two from 2010-20.
Judging by this data, both defenses were very unlucky when it came to catching interceptable passes.
Penn State intercepted just four passes on 37 breakups, and Michigan picked off two out of 24. Each ranked well outside the top 100 in converting breakups into interceptions and in net EPA/WPA from turnovers.
Both teams are looking for significant rebounds in 2021, and a luck reversal in this department should help with that.
Fumbles
It felt like Oregon was almost fumbling on purpose with how often it happened last year. It somehow managed to lose nine fumbles in seven games, and it only recovered two. Honestly, it's a little impressive the Ducks managed to win the Pac-12 while gifting possessions away left and right.
Oregon and Northern Illinois were the only two teams bad enough to have a net fumble differential of -1 per game. Hopefully, for the Ducks' sake, the strength coach worked on grip strength this offseason.
An interesting team near the bottom of fumble differential is actually Cincinnati. Fans wouldn't expect that from a team that had so much success, but the Bearcats recovered only four fumbles all year while losing 10. The differential of -0.6 per game ranked 121st in the country.
The AAC may be in trouble if Cincinnati still managed to beat its opponents by almost three scores last year despite having such bad fumble luck.
Two teams that were unusually lucky with fumbles last year were Arizona State and Washington, which was probably a result of a four-game sample size.
ASU somehow managed to recover eight fumbles in just four games, but it also coughed it up three times. Washington did not have a single fumble last year and recovered five.
Each team finished the season +5 in net fumbles and were the only two programs that had fumble differentials greater than one per game.

![]()
![]()
![]()
How would you rate this article?
Follow Us On Social


