
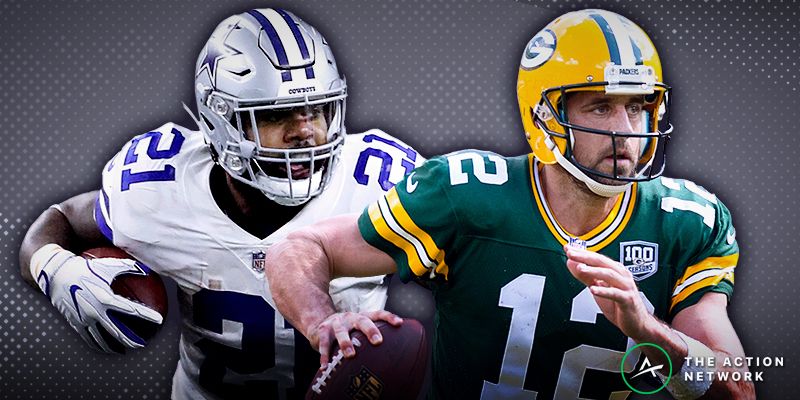
Raybon: Should You Bench Patrick Mahomes in Fantasy vs. Jags D?

Credit: USA TODAY Sports. Pictured: Patrick Mahomes (15), Jalen Ramsey (20).
- Patrick Mahomes is the top fantasy quarterback through four weeks but will face the Jacksonville Jaguars' elite defense in Week 5.
- That leads to these questions: 1) How have top quarterbacks done against elite defenses? 2) How have top quarterbacks done vs. the Jaguars in particular?
- We look at the data to find out, and you may be surprised at the results.
I've had what some might say is irrational confidence in Patrick Mahomes. In our 2018 NFL team previews, I proclaimed him a laser show that would send the Chiefs right past their season win total.
After Week 1, I wondered aloud if he'd be this year's Deshaun Watson (from a fantasy perspective). Despite a poor defense, Mahomes has more wins in five career starts than Watson has in 10.
Yet even I had some pause when I saw the Jaguars pop up on the schedule for Week 5, so I went to the numbers to answer two key questions:
- What happens when a top quarterback faces a top defense?
- What happens when the Jags face a top quarterback?

What happens when a top quarterback faces a top defense?
We can use the FantasyLabs NFL Trends tool to look at what happens when a top quarterback faces a top defense. I'll use FanDuel points so this can be applied more broadly because conventional leagues don't use yardage bonuses like DraftKings, and I'll define a top quarterback as one with a salary of at least $8,000.
Since 2014, quarterbacks at that price have averaged 19.2 fantasy points, or the equivalent of mid-range QB1 numbers.
I'll define a tough matchup using Labs' proprietary Opponent Rating metric, which is a percentile rank for how well a defense has defended a particular position in the past.
It takes into account Plus/Minus allowed versus position, and a higher number represents a more favorable matchup. (The Jags currently rate as a 5.)
Trend filters:
- Salary is $8,000 or more
- Opponent Rating is in seventh percentile or lower
Results:
- 19.6 fantasy points
- +0.33 Plus/Minus
- 56% Consistency Rating
Not only have top quarterbacks performed well in tough matchups, they've actually performed slightly better than they have overall (19.2 fantasy points, -0.04 Plus/Minus, 50% Consistency).
Fantasy/DFS players tend to think like this: "If there's ever a time to bench/fade a top quarterback, it's when they face one of the best defenses in the league."
But outside of DFS cash games, that's been the wrong approach. Top quarterbacks are still putting up their usual numbers against top defenses, and they're going under-owned in DFS tournaments (5.0% average ownership in the trend above)
What happens when the Jags face a top quarterback?
Since the start of 2017, including the playoffs, the Jags have faced a passer who can reasonably be considered a "top quarterback" seven times:
- Tom Brady (2018 Week 2): 19.6 fantasy points
- Brady (2017 AFC Championship): 16.4
- Ben Roethlisberger (2017 AFC Divisional Round): 37.4
- Jimmy Garoppolo (don't @ me; 2017 Week 16): 23.0
- Russell Wilson (2017 Week 14): 24.8
- Philip Rivers (2017 Week 6): 16.3
- Roethlisberger (2017 Week 5): 9.9
- Average: 20.7 fantasy points, +3.73 Plus/Minus, 71% Consistency
That's not bad. It would be even better if the Steelers didn't foolishly come out passing in Week 5 last season when the Jags had one of the league's worst run defenses and the Steelers had one of the best running backs in the league in Le'Veon Bell.
In fact, if we use the league average of 7.1 yards per attempt as a benchmark, the Jaguars haven't been a particularly daunting matchup vs. quarterbacks who are league-average or better:
Trend filters:
- Opposing team is Jaguars
- Season is 2017 or '18 (includes playoffs)
- Quarterback averages 7.1 or more yards per attempt over the past year
Results:
- 17.3 fantasy points
- +1.18 Plus/Minus
- 42% Consistency
What the Jaguars defense has done is what most elite teams and players in sports tend to do: Beat up on poor competition. If we look instead at quarterbacks whose yards per attempt are 7.0 or less, it's not pretty for the throwers:
- 6.2 fantasy points
- -8.29 Plus/Minus
- 0% Consistency
Matchups Matter … Just Not as Much as We Think
Because player stats can vary drastically from one week to the next and matchups vary from one week to the next, it's easy to assume matchups are primarily responsible for the variance.
But correlation is not causation. I looked at data from every game between 2010 and Week 3 of this season to find just how correlated quarterbacks and opposing defenses actually are:
- Only 1% of the game-to-game variation in offensive passing yards is explained by the opponent's season average of passing yards allowed. The correlation coefficient (known as R) is .10, and this was true when looking at full-season average regardless of games played up to that point or after at least four games (R = .10), eight games (R = .11), or 12-games (R= .10) into the season.
- Only 0.2% of the game-to-game variation in offensive passing touchdowns is explained by the opponent's season average of passing touchdowns allowed. The correlation coefficient is .05, and it rises as you look at a minimum of four games (.06), eight games (.08), or 12 games (.09), but even with 12-plus games of data, a correlation coefficient of .09 means it explains just 1% of the variation.
Meanwhile, the correlation between an offense's numbers in a given game and its own season averages entering the game is far greater:
- An offense's seasonal passing yards per game explains 8% of its passing yardage in next game. That may not seem like a lot, either — football is tough to predict! — but the R here is .28 nearly triple that of the defense. We also see more predictiveness as the sample increases from at least four weeks (.33; explains 11%) to eight weeks (.35; 12%) to 12 weeks (.38; 15%).
- An offense's seasonal passing touchdowns per game explains 8% of its passing touchdowns in next game. The R is .20, and again we see a bit more reliability as the sample of games increases from at least four (.26; 7%) to eight (.27; 7%) to 12 (.28; 8%).
A couple of final notes: The point here isn't that "matchups don't matter." They matter, just not uniformly across all situations. They tend to matter more at the extremes.
They matter more when you're trying to maximize value in DFS cash games compared to tournaments, or when considering whether you should bench your stud quarterback in redraft.
Conversely, we're not saying "past performance doesn't matter." Looking at matchups means we're looking at single-game correlations. A team's performance would correlate more to itself if you looked at how well a team's average in the first eight games predicted its average in the next eight games, for example.
Lastly, I'm looking at this from a fantasy end; passing-game matchups are still the predominant factor in which team wins a football game, and there are better stats (such as Success Rate or DVOA) that are more predictive than passing yards and touchdowns.
The point is that when you have someone on your roster like Mahomes, don't overthink it.
Let's get this shmoney!

How would you rate this article?
Follow Us On Social


