NHL 1st Period Model Tutorial and FAQ: What Does Any of This Mean?
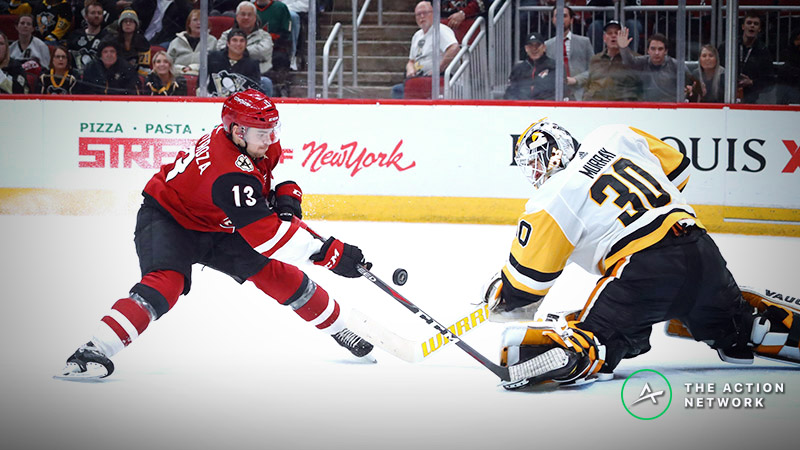
Mark J. Rebilas, USA Today Sports. Pictured: Vinnie Hinostroza, Matt Murray
- The first period over/under is becoming a more and more popular prop bet in the NHL.
- Ken Barkley has created a successful model for the first period market and has written up a primer on how to use it.
Believe it or not, first period hockey totals had a bit of a moment this season.
Thanks to the Tampa Bay Lightning and Chicago Blackhawks, each of whom went on long streaks of going over their respective 1st period over/unders, this prop started to create some buzz in the gambling community.
As a bet, first period totals can be fun, sort of in the same way a horse race is fun: There is a payout much quicker than in a traditional game-long market. You will know, sometimes in as little time as a few minutes, whether you are a winner or not. For the most degenerate among us, that's quite an appealing characteristic for a bet to have.
I recently, around the holidays, put together an NHL model that's pretty straightforward. It uses an algorithm derived pretty simply from linear regression of a variety of statistics. I then further modified it to provide very accurate first period goal-total projections for each game.
From Jan. 3 until it's first post on this site, those projections had about a 23% ROI, over a little less than 300 total games played in the league during that time.
I have chosen to share the projections on Twitter for about a week or two (@LockyLockerson) and the response has been so overwhelming to them that finding a more easy-to-interact-with medium became a goal.
Rather than taking just a screenshot and pinning it to a Twitter account, where there may be plenty of questions (most notably, about prices changing throughout the day) I am instead publishing them here, as a daily post (when there are three or more games on the slate).
The most appealing characteristic of this medium is you can then download the projection numbers (not the algorithm, or any proprietary information beyond the projections) and input the price at your particular book, to see if an edge got larger or smaller, or what the exact edge, in case you wish to bet accordingly.
That way, no matter when you get to the projections, they can be optimized for you, without a lot of legwork on my end answering individual questions.
Here are some (I'm guessing will be) frequently asked questions about this series:
What is a first period total?
OK, so maybe most of us know already, but in hockey, there are three 20-minute periods, and in addition to betting on the full-game outcomes, you can bet on sides and totals in each of the periods individually.
In almost all hockey markets, the standard over/under for a period is 1.5, and the juice varies widely, depending on the teams involved, on each side. Some sites, including one domestically, will hang a "2" occasionally, but you can safely assume 1.5 almost at all times will be the number in question.
What am I seeing in the graphic/spreadsheet?
Some categories are easy to identify, like the team names, and the 1.5 listed total for all games.
What some beginner bettors may not fully understand is that a price (when you see -110 adjacent to a point-spread) has a corresponding win probability that is implied by that price.
So by inputting your "juice" from your book into the spreadsheet (like say, -150 on the over), it will convert it into the appropriate implied win percentage (60%).
The spreadsheet will then compare that win probability to what I estimate the win probability to be for each side of the bet, and if there is a difference, it will tell you which side has the "edge," or advantage, compared to the market, which is the side I would recommend betting on.
The spreadsheet is built to signal anything with an edge greater than 2%.
That's still really confusing, I don't get it.
That's OKtoo, a lot of people like to bet because it's fun, not because of math. Everyone gets something different out of the experience.
I will provide a brief write-up each day on which numbers stand out at the time of publishing, where the large edges exist currently, and at what numbers they should be bet.
It will be brief, but helpful, if you don't feel like touching a spreadsheet at all. I don't blame you. I majored in English and Journalism. This was a rough learning curve for me too, and it's not even close to over on my end. I'm really just a beginner that's further along in the textbook.
What do I bet on?
Well, whatever you want. Every day I'll identify what the edges that exist are using my own model, and you can identify them as well by downloading and plugging in your prices.
If you want to bet those edges, be my guest. If you want to use these projections for some other purpose (augmenting your own projections, DFS, Fantasy) you may find them helpful for that as well. If you want to fade them because you want to troll me, you can do that too. You know where to find me on Twitter.
The beauty of freedom. All choices are available.
How much do I bet if I want to bet the edges?
I am neither your financial advisor nor your bankroll manager. Frankly, those roles would probably stress me out way too much given all of your risk profiles collectively. The blunt answer here is "I really don't care."
Many free online sites provide a Kelly Criterion calculator, which can tell you what percentage of your bankroll to bet given the known edge. There is an assumption there that these edges DO actually exist, and you may not believe they do since you've never seen this before.
But if you assume they are correct, that type of method is optimal. You can also set up some kind of flat-betting structure, or some other machination of your own design. Again, up to you.
Won't the edges vanish once you put this up?
They might, but I/we aren't the only ones playing around in a market with these limits. This isn't a low-limit prop offered in one place. As we get closer and closer to puck-drop each night, it is assumed the markets become more and more efficient, so if my numbers are correct, then yes, the edges will slowly evaporate.
But it's also possible new information enters the market (injury, goalie change, coach firing) that causes a reaction, or an overreaction, and another opportunity presents itself. It's a market. It's not going to just stay the same forever to make it easy for you.
How do you account for the starting goalie if you are calculating probabilities early in the day?
I use the best guess available at the time, and have found that getting in early is much better than getting a bet in later in the day once the each team has confirmed its starting goaltender.
I have also found that changes from starter to back-up, in the limited time I've been doing this, can often be cause for overreaction in the bigger markets, and that leads to overreaction in the derivatives as a trickle-down.
I'd rather use a "best guess" goalie and have access to the softer opening number in the morning/early afternoon.
What value is there if the edges go away 15 minutes after you post?
Well, use your brain. If you actually see line movement correlated to my exact posting (which would be arrogant of me to assume, and frankly unlikely), why not try to look at past results and figure out where I may find value?
Once you do that, if you grab one side of a market, I release my numbers, the prices move, and you can grab the other side to scalp. And that's just the most low-hanging-fruit, basic example that may not even come to fruition.
No matter what factors are in play in a given bet type or market, creativity and innovation can generally help create an approach to get value vs. them. Except the NFL. I hate betting the NFL.
So why do this?
Well, I actually think it's a way to help people learn a little bit more about this process while also not disturbing my edge. If all you learn is that when I put up prices, they change, and the edge goes away, and you shouldn't bet anymore, that's actually very valuable information for a LOT of people who don't consider such things when making decisions.
Also, just the idea of playing with prices in the spreadsheet, and seeing how changes can impact your bottom line and bet-size, are valuable. In that way, maybe it's just the equivalent of a basic workbook exercise that teaches a lesson. And that's fine.
It will have been worth it if that gets across, and nothing else.
But also, I'm just getting started here too. I'm not particularly adept at machine-learning or programming language (yet) so this is one of my first forays into such an analytical approach.
It will make me work hard to improve it as much as I can, too, basically thru peer pressure of having the results on here.
Whatever you decide to do with this information, best of luck in the markets.
How would you rate this article?


