6 NASCAR Prop Bets for Sunday’s Coca-Cola 600 at Charlotte
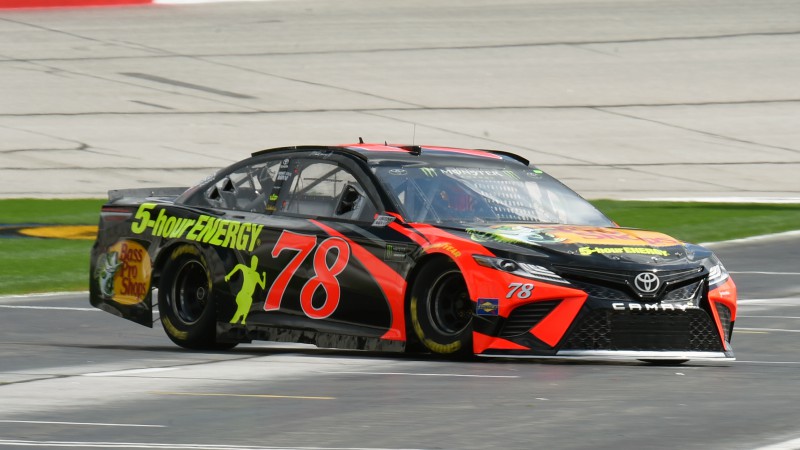
Adam Hagy-USA TODAY Sports. Pictured: Martin Truex Jr.
It's Memorial Day weekend, which means that it's time for the greatest motor sports day of the year. In the morning (9:10 a.m. ET), we have the Monaco Grand Prix. In the afternoon (12:19 p.m. ET), we have the Indianapolis 500, where …
- Alexander Rossi is favored.
- Danica Patrick has a shot to win her last career race.
- One prop in particular is highly exploitable.
- Value picks abound.
And then in the evening (6:18 p.m. ET) at Charlotte Motor Speedway we have the Coca-Cola 600, the longest NASCAR race of the season. Featuring a combination of day, dusk, and night racing, the Coca-Cola 600 is an institution. I mean, Bryan Mears' grandmother rents a limo and goes to the race every year: That's how awesome it is.
If you love motor sports, Sunday is your Super Bowl.
A popular track hosting two NASCAR races per year (plus the All-Star race), Charlotte is a fairly standard 1.5-mile asphalt quad oval with 24-degree banking in the turns. For this race, here are the main metrics I’m considering:
- Projected finishing position
- Starting position
- Long-run practice time
- Year-to-date performance
- 1.5-mile oval history
- Track-specific history
Per usual, I rely on the machine learning statistical models and similarity scores at RotoViz, created by Nick Giffen (RotoDoc). For more on the race, check out the podcast I recorded this week with Nick Giffen (RotoDoc).
Normally I highlight just three props, but because this is the Coca-Cola 600 I'm going big with SIX. And that's not all: They're all underdogs.
Let's do this[
Martin Truex Jr. (+130) Over Kyle Busch (-160)
Busch is starting on the pole and in excellent form with the best driver rating (116.8), running position (6.2), and quality pass percentage (81.5) of any driver over the past eight races, but since last season Truex — the reigning NASCAR Cup Series champion — has owned the 1.5-mile tracks with top-three marks in finishing position (5.4), driver rating (121.2), running position (7.0), quality pass percentage (66.7), laps led percentage (25.2), and fastest laps percentage (14.2), besting Busch in every category.
In final practice, Truex had the eighth-fastest 10-lap average while Busch had just the 15th-fastest mark. In the RotoViz model, Truex has a top-three projected finish of 8.79. Busch has the eighth-highest projection at 9.81.
Brad Keselowski (+130) Over Kyle Larson (-160)
Keselowski and Larson are evenly matched. Since last year Kez has had the edge at 1.5-mile tracks in finishing position (13.3 vs. 13.6) and quality pass percentage (67.4 vs. 65.8), while Larson has had the superior driver rating (100.2 vs. 94.9) and running position (10.4 vs. 13.3). In final practice Larson had the second-fastest 10-lap speed while Kez was 11th, but Kez is in better recent form with the superior driver rating (98.8 vs. 94.4), running position (10.0 vs. 13.9), and quality pass percentage (71.1 vs. 55.4) over the past eight races.
Kez has historically been able to run well despite poor practices, and he has the better starting position (5 vs. 11). Given the elevated rate of incidents at Charlotte, it makes sense to steer into the swerve and take the plus odds. In the RotoViz models Kez has a projected finish of 9.27; Larson, 9.45.
Joey Logano (+115) Over Erik Jones (-145)
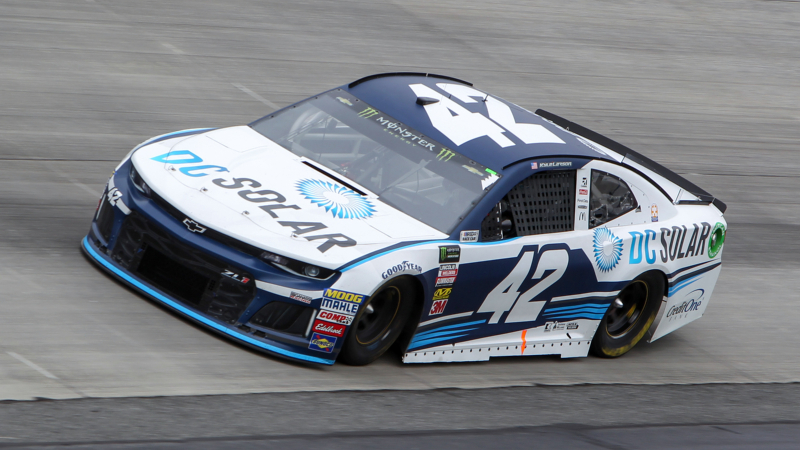
It's tempting to go with Jones, who had the fastest single- and 10-lap speed in final practice, but Logano has the superior starting position (2 vs. 4), and he was no slouch in practice with top-five single- and 10-lap marks. Jones is a good driver with five top-10 finishes this year, but Logano has 10 such finishes on the season and vastly superior data.
- Finishing position: 6.9 vs. 16.2
- Driver rating: 104.5 vs. 79.1
- Running position: 7.5 vs. 15.9
- Quality pass percentage: 72.1 vs. 57.1
Logano is one of the best drivers in NASCAR. Jones is a second-year driver on a hot streak. There's a big difference between the two. In the RotoViz model, Logano has the highest projected finish at 6.47. Jones is outside of the top eight with a mark of 9.87.
Jimmie Johnson (+105) Over Daniel Suarez (-135)
This year hasn't been kind to Johnson, but he's still JJ, and Suarez isn't. Although these two are close, Johnson has the edge in almost every category. This season Johnson has the superior finishing position (16.6 vs. 18.2), driver rating (78.5 vs. 71.2), and running position (17.3 vs. 18.6). Since last year Johnson has also been better at the 1.5-mile ovals in finishing position (18.4 vs. 18.7), driver rating (80.1 vs. 69.8), and running position (16.9 vs. 18.6).
Suarez has the better starting position (10 vs. 23), but Johnson had the better single- and 10-lap times in practice (11 and 19 vs. 21 and 20). JJ isn't what he once was, but whenever he's getting plus odds against a mid-tier driver he probably warrants investment. In the RotoViz models, he has a projected finish of 16.13. Suarez is projected for 17.31.
Chase Elliott (+115) Over Kurt Busch (-145)
Busch has been the better overall driver this year . . .
- Finishing position: 13.2 vs. 14.5
- Driver rating: 95.9 vs. 80.9
- Running position: 10.0 vs. 14.7
- Quality pass percentage: 72.8 vs. 60.2
. . . and he also has the better starting position (16 vs. 22), but Elliott smoked Busch with his 10-lap speed in final practice (4 vs. 17), and since joining Hendrick Motorsports as a full-time driver in 2016 the youngster has had the better driver rating (94.4 vs. 90.2) and quality pass percentage (60.9 vs. 56.6) at the 1.5-mile ovals.
This line should be much closer to a pick'em than it is. In the RotoViz Models, Elliott has a 10.58 projected finish; Busch the Elder, 11.13.
David Ragan (+110) Over Chris Buescher (-140)
This is an ugly matchup. On the one hand, Ragan finished dead last in 10-lap speed in final practice. On the other hand, Buescher didn't even string 10 laps together. In single-lap speed (28 vs. 29) and starting position (18 vs. 19), Buescher and Ragan are literally neck and neck. On the season, though, Ragan has been better than Buescher in finishing position (21.8 vs. 22.4), driver rating (57.1 vs. 55.7), and quality pass percentage (16.2 vs. 12.8).
In total, Ragan and Buescher are almost equally bad, but Ragan has plus odds and the better projected finish in the RotoViz model (20.22 vs. 20.69). It's not sexy, but it's positive expected value.
——
Matthew Freedman is the Editor-in-Chief of FantasyLabs. He has a dog and sometimes a British accent. In Cedar Rapids, Iowa, he’s known only as The Labyrinthian.
How would you rate this article?


