


Talk about your mixed bag of results.
Recent data reveals a drop in foot traffic at casinos across the United States, echoing trends seen since the COVID-19 pandemic.
August saw a 5.4% drop compared to the same month in 2024. When looking further back to pre-pandemic August 2019 levels, visitation was down by a significant 17.5%, according to a report from Jefferies Equity Research analyst David Katz.
Katz found a similar trend that we reported on last month. It was a pattern that has been ongoing since the end of last year.
Despite these figures, gross gaming revenue (GGR) remains strong, suggesting changes in gambler behavior and spending patterns.
Pre-Pandemic Casino Visitation Numbers
Before the pandemic, 2019 marked a high point for U.S. casino visitation.
Casinos thrived as popular entertainment destinations, attracting diverse audiences drawn by any number of factors, including:
- Gaming
- Dining
- Shows
Other attractions will also bring people in, such as conventions or a big sporting event like the Super Bowl. This bustle was characterized by steady year-over-year growth in foot traffic and revenue.

There have been months where casinos experience a jump in attendance, similar to what was witnessed last November, but the consistent trend has been downward.
Current Casino Trends and Analysis
When analyzing data and trends in the U.S. casino industry, it's important to distinguish between short-term irregularities (or anomalies) and long-term changes (or patterns). Some changes in visitor numbers or revenue might be temporary blips that don't indicate a lasting trend, while others might signal significant shifts in the industry. Understanding the difference helps industry experts make informed decisions and predictions.
August Decline: The latest analysis confirmed a 5.4% year-over-year drop in U.S. casino visitation in August 2025. The gap widens considerably when compared to 2019's numbers, with a striking 17.5% fall.
July Anomaly: Katz reported that July appeared to be an unusual blip in an otherwise stable 2025, with a 10.1% drop in visitation compared to July 2024. He sees this as an anomaly rather than a continuation of a downward trend.
Stability with a Gap: While visitation remains lower than in 2019, the 2025 trend has settled into a quieter rhythm, showing consistent month-on-month results.
Robust Revenue: Even as fewer patrons visit, total gross gaming revenue remains strong due to increased spending per visitor or improvements in casino operations and offerings.
Katz explained that August's foot traffic was in line with trends seen throughout 2025. He noted the data “supports our view that the greater step back in July was more outlier than trend,” referring to a 10.1 percent decline in July 2025 compared to the previous year.
What Are Some Regional Differences Between Casinos?
Regional variations in casino attendance are driven by a complex mix of local economic conditions, regulatory factors, competition, property development, and consumer preferences. The impact of these variables leads some markets to experience growth or resilience, while others see persistent declines.
These differences are having an impact on U.S. casino visitation trends in 2025, with some states and cities outperforming others due to local factors, new openings, and market maturity.
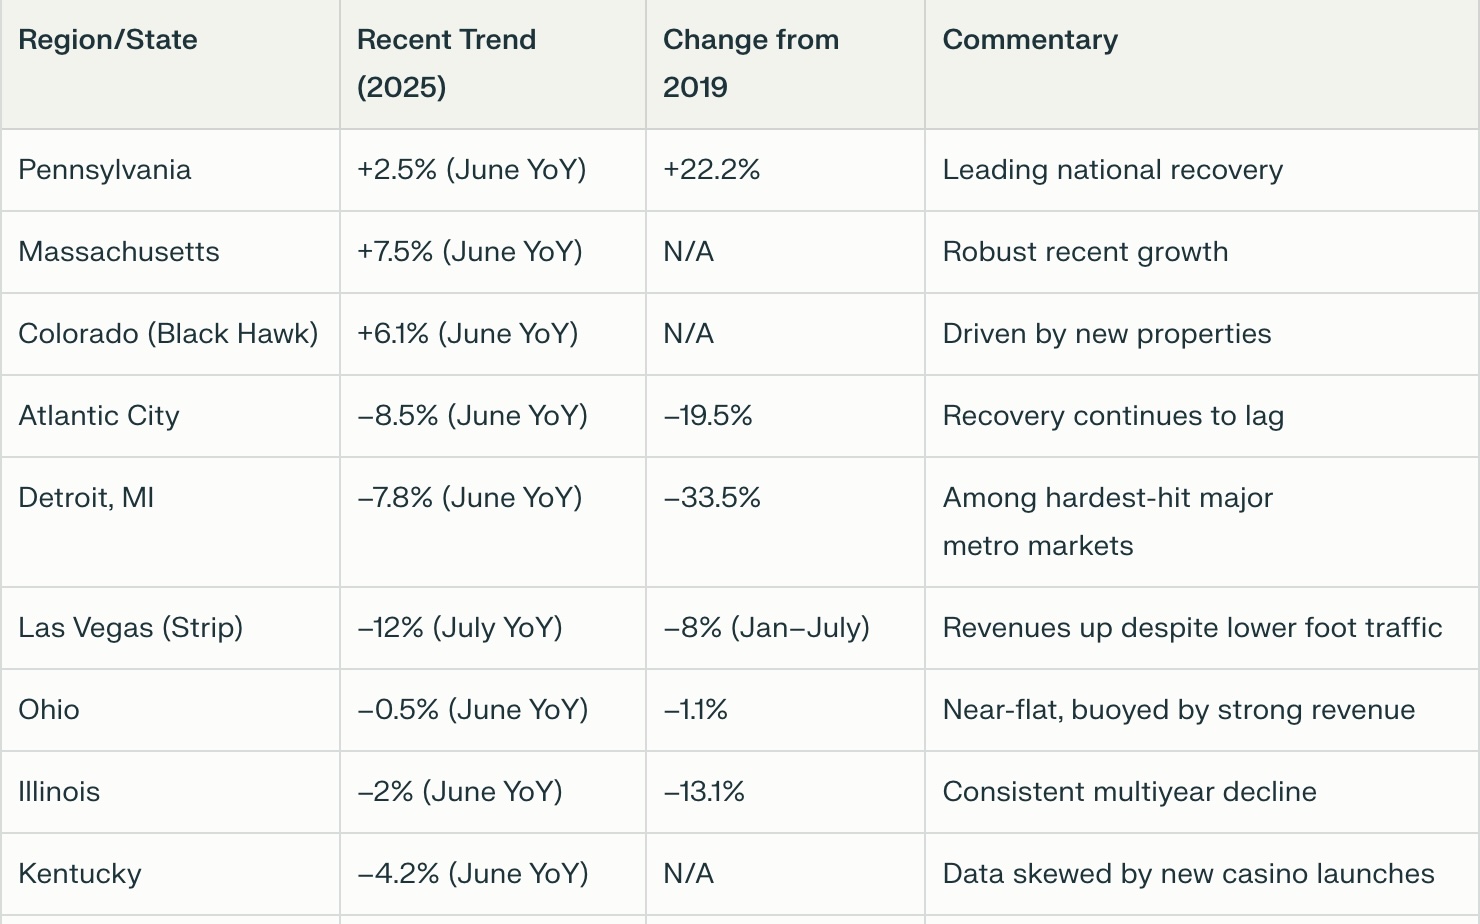
Varied Performance
Certain regions outperform others. Pennsylvania demonstrated growth surpassing 2019 levels, while states like Illinois and New Jersey experienced more significant declines.
Factors Informing Trends
- Increased individual spending means fewer attendees but more revenue.
- New properties, like Churchill Downs' The Rose in Virginia, may invigorate interest and drive future visitation.
- Adaptation to post-pandemic trends and market conditions is evident, with shifts towards higher-yield activities.
Black Hawk, Colorado, saw a 5% increase in visitation. However, Katz pointed out that this might not be entirely accurate because Monarch Casino Resorts had just opened a new property there in mid-2022, which could be boosting the numbers.
“We continue to believe regional gaming is better positioned for growth in the near term compared to Las Vegas, where expectations for the Strip are confirmed to be low until the group slate accelerates in the final trimester of 2025,” Katz summarized.
Katz is optimistic about two companies in particular: Penn Entertainment and Churchill Downs. Penn Entertainment has recently redeveloped casinos in Illinois and Ohio, while Churchill Downs has opened new locations in Kentucky, Virginia, and New Hampshire. Katz highlighted Churchill Downs's new slot parlor, The Rose, in Henrico County, Virginia, and its newly acquired casino in Salem, New Hampshire.
Implications for the Casino Industry
The current state of the U.S. casino industry reflects a period of adjustment and resilience. While visitation remains below pre-pandemic figures, the sector has shown an ability to maintain strong financial performance.
Analysts like Katz suggest this may be due to higher spending patterns among remaining visitors and innovation in the form of new properties and offerings.
Regional diversity, event-driven openings, and market adaptation continue to shape the industry's evolving landscape. As behavioral shifts settle, the industry is still poised for potential growth, balancing current challenges with strategic opportunities for increased engagement and visitation stabilization.


