


Handicapping NASCAR races is all about projecting speed.
The two avenues bettors use to project speed are:
- Looking at on-track activity (practice, qualifying) during the race weekend
- Using past races at the current track and similar tracks
There is plenty of value in mid-week betting. However, that occurs before any on-track activity takes place. That means we're focused on the second method.
Metrics like average green flag speed, average running position, driver rating, fastest laps and laps led are nice, but they often don't tell the full story.
Projecting Speed: An Example
As a good example, let's look at Tyler Reddick's race in the Coca-Cola 600 earlier this year.
Reddick was running solid for 322 of the 400 scheduled laps. Undoubtedly, he had a top-10 car.
However, on lap 323 rubber build up started accumulating in his tire and impacting it's performance. Eventually, that caused the tire to shred, costing Reddick a lap and damaging his car. He was unable to run the same speed the rest of the race.
Graphically, we can see Reddick was hanging out between 30.5- and 31.25-second laps for the bulk of the race.
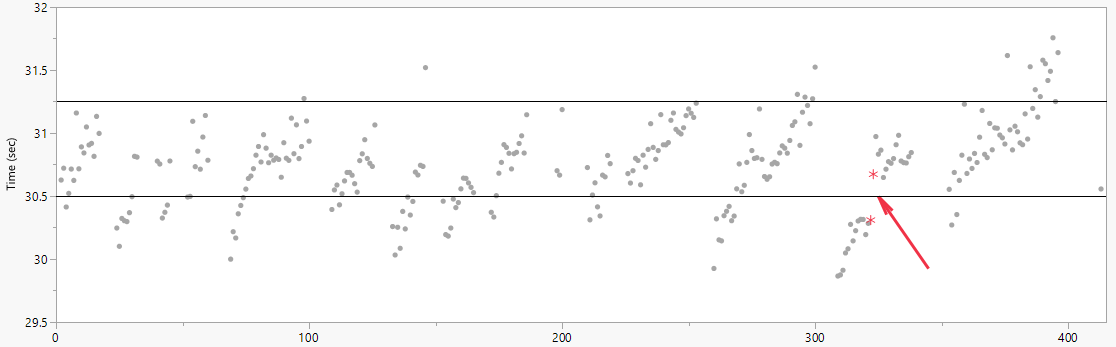
After the rubber build up and subsequent incident (indicated by the red arrow), Reddick only had two laps faster than 30.5 seconds over the final 91 laps, a 2.2% rate.
Prior to the incident, he had 62 such laps over a 322 lap span, a 19.3% rate.
Additionally, Reddick recorded only six race-speed laps above 31.25 seconds prior to the incident. After the incident, he had 10.
A New Speed Metric: FLAGS
Clearly, in the example above, Reddick's true speed was impacted by an incident.
While incidents do happen, projecting them is largely out of our control as bettors. They are essentially random events, so the better option is to project true speed.
To do so for Reddick, I'm simply looking at his healthy car lap times (prior to lap 323) and comparing them to the rest of the field.
Doing this for every driver on a lap-by-lap basis gives us a fixed number of healthy cars on the track each lap. That number can obviously change, so it behooves us to adjust each lap's time for the healthy car field size.
When all is said and done, we get my new metric called Field-Level Adjusted Green Speed, AKA, FLAGS.
Going back to the Reddick example, NASCAR's metric, average green flag speed, shows Reddick was ninth fastest.
However, that average includes all his times after lap 322.
Because he finished on the lead lap in sixth place, largely due to the attrition of others, bettors and analysts may think that whole race was representative of his pace.
But, by performing this deeper analysis, we know that was not the case.
Using my FLAGS metric, Reddick actually ranked fourth at Charlotte. This gives us a truer picture of his race pace prior to any speed-impacting incidents.
How to Use FLAGS
Each week, I'll have a FLAGS ranking for each race. This weekend, as we head to Michigan, I've decided to use regular season data from the 1.5-mile ovals of Las Vegas, Kansas and Charlotte.
All three are good approximations for speed at Michigan and correlate well. Averaging my FLAGS ranking at those three tracks, we get the following ranking:
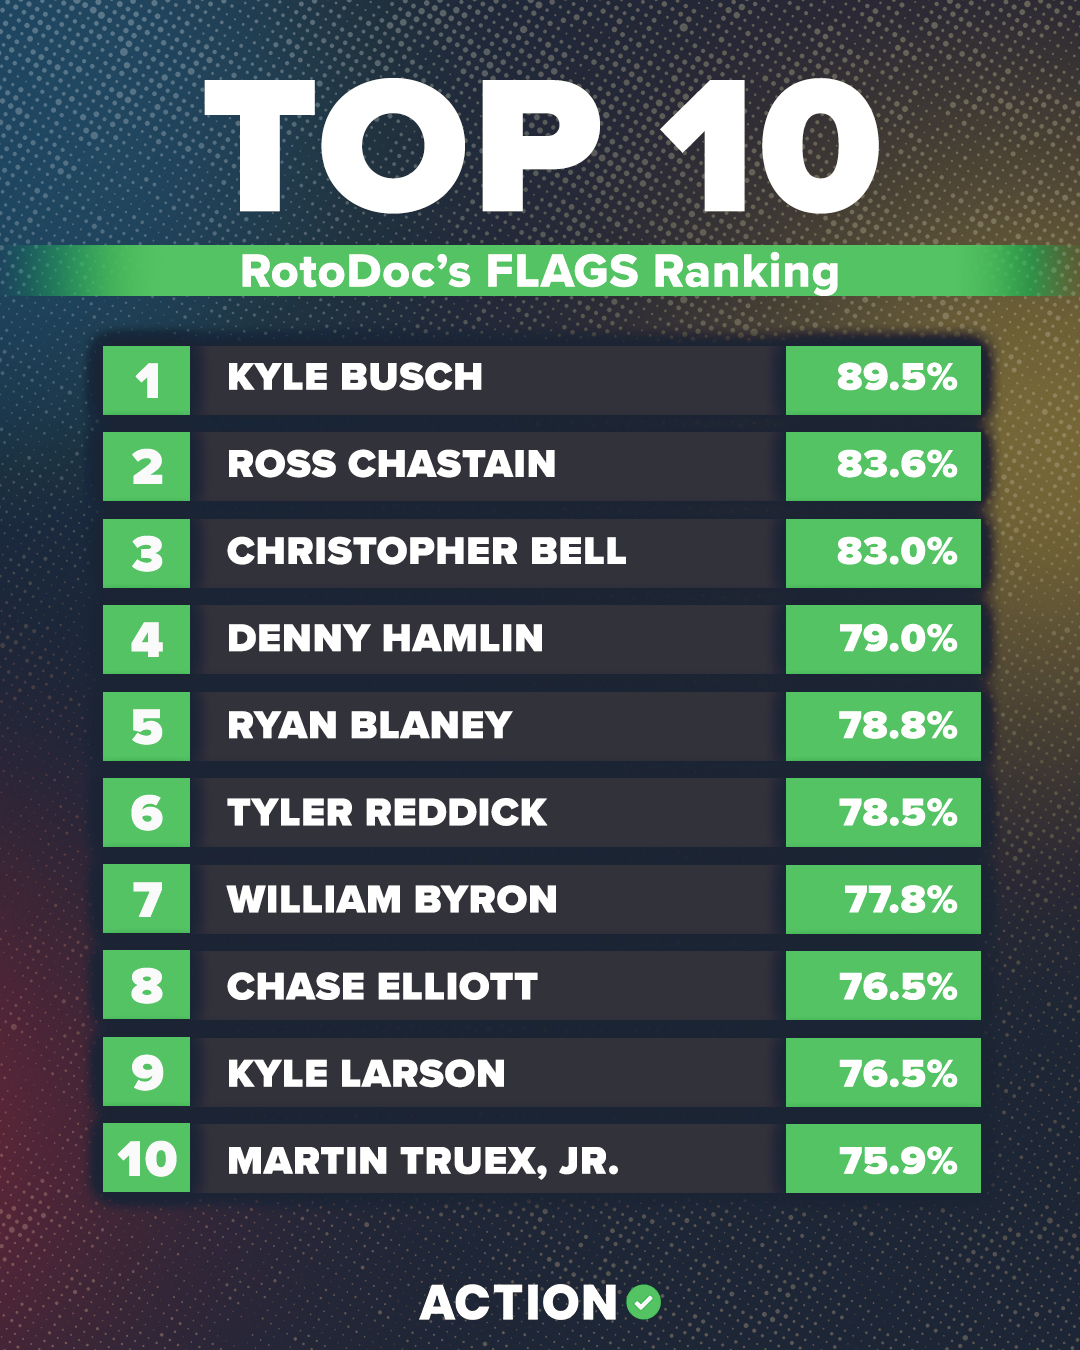
At these races, we can see Kyle Busch leads all drivers in speed.
If we just looked at some other speed rankings that don't take into account post-incident speed, those rankings will be much lower on a driver like Christopher Bell, who encountered speed-impacting events at all three races.
Nonetheless, Bell still pulled off two top-five finishes and another top-10 finish in those three races despite not having a perfect car by the end of each race. Imagine what he could have done with a healthy car.
It's also possible to add in other somewhat similar tracks to Michigan. Both Auto Club Speedway and Pocono have some correlation to Michigan in the horsepower department, but for different reasons, I'm not including either one.
Going forward, I'll try to look at different subsets of similar tracks to give you all a full picture of which drivers should be fast each week heading into the race weekend!
Good luck with your bets and may you take some checkered … ahem, FLAGS … this week!


