


With summer in full swing, millions of Americans are heading to the coast with friends and family, but crowded beaches can also attract opportunistic thieves. Phones, wallets, and bags left unattended while people swim or take a walk are frequent targets, particularly in areas with higher rates of property crime.
A new study from The Action Network reveals which U.S. beaches are located in areas with elevated rates of theft, vehicle break-ins, and burglary, helping travelers understand where they’re more likely to experience theft or loss during a day at the beach. While some of these spots are popular vacation destinations, it’s worth exercising extra caution when visiting.
To uncover these findings, the research team at The Action Network analyzed ZIP-code-level crime statistics to assess theft-related risks in the neighborhoods surrounding more than 500 beach locations across the U.S.
We focused on four types of property crime most relevant to beachgoers:
- Theft – unattended personal belongings on or near the beach.
- Robbery – confrontational theft in public areas around the beach.
- Vehicle theft – stolen cars, bikes, or scooters from nearby parking lots or access roads.
- Burglary – break-ins reported in surrounding areas, including vacation rentals and storage facilities.
Using this data, our odds experts developed a weighted scoring model to calculate the implied probability of theft-related incidents for each beach area, giving travelers a clearer picture of where to stay alert and take precautions.
U.S. Beach Areas With the Highest Risk of Theft
After analyzing property crime patterns across hundreds of ZIP codes, these beach areas stood out with the highest implied probability of theft-related incidents. While many remain scenic getaways, the surrounding neighborhoods report elevated rates of theft, robbery, vehicle crime, and burglary — all of which can impact beachgoers.
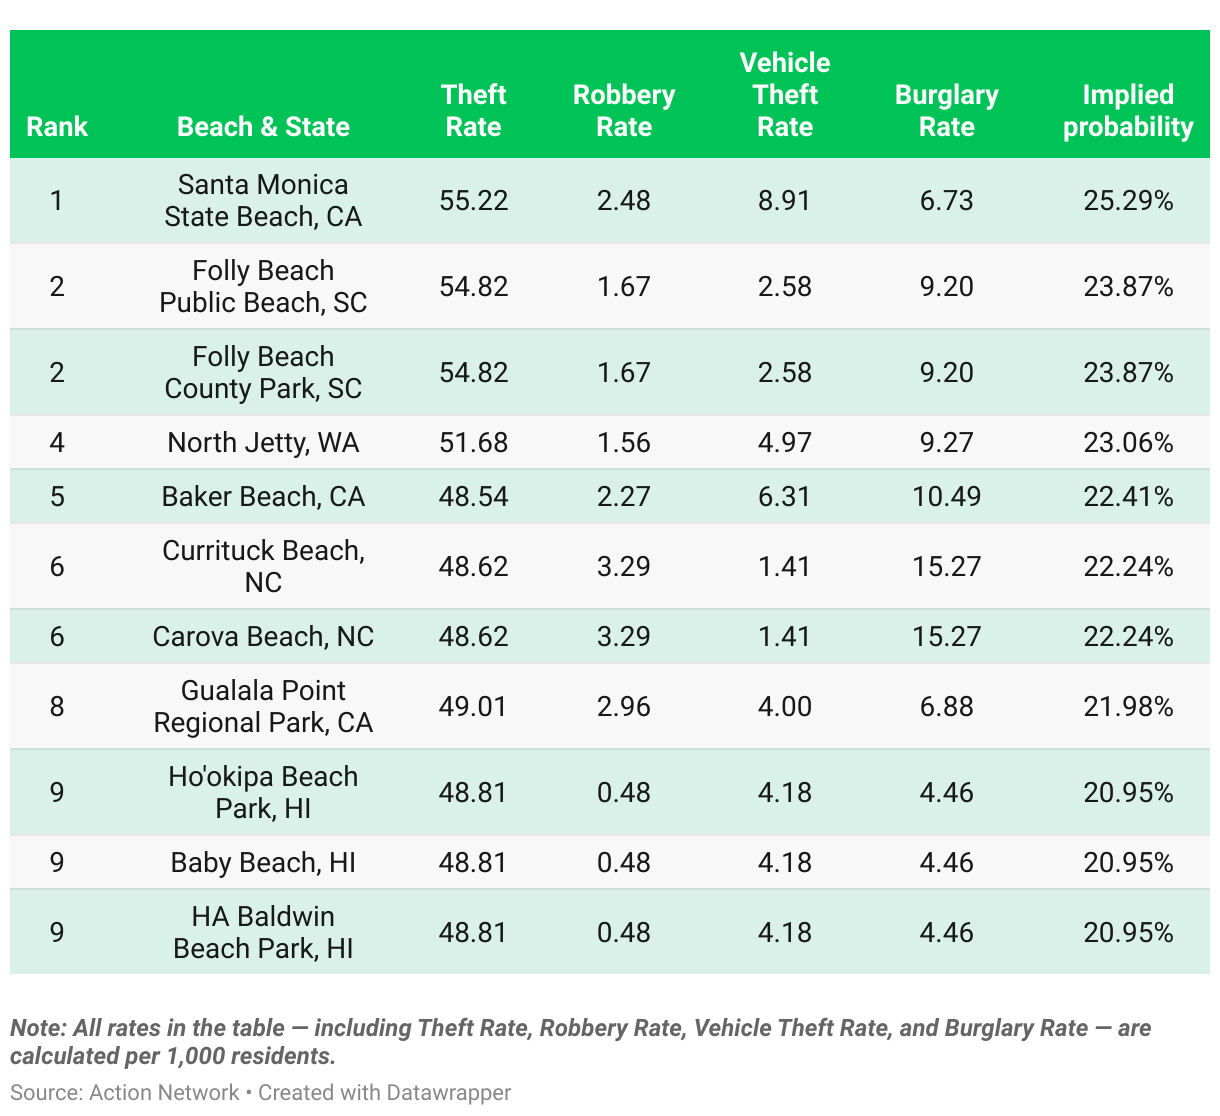
Key Findings: Where Beachgoers Face the Highest Risk of Theft
- Santa Monica State Beach, CA, comes in first, with a relatively high vehicle theft rate (8.91 per 1,000 residents) contributing to its 25.29% theft probability.
- Folly Beach claims a tie for the No. 2 spot, with both its Public Beach and County Park access points sharing the same ZIP code and identical implied theft probability — suggesting a consistent level of risk across the area in South Carolina.
- Three Hawaiian beaches — Ho'okipa, Baby Beach, and Baldwin Beach Park — share the same ZIP-code-level crime profile, landing them all in the No. 9 spot.
- California and Hawaii each have three beaches in the top 10. While the beaches in California indicate broader crime concerns across multiple coastal communities, Hawaii’s reflect a concentrated risk within a single coastal region.
U.S. Beach Areas With the Lowest Risk of Theft
These U.S. beach areas reported the lowest levels of theft-related crime, making them some of the safest spots to enjoy a worry-free beach day.
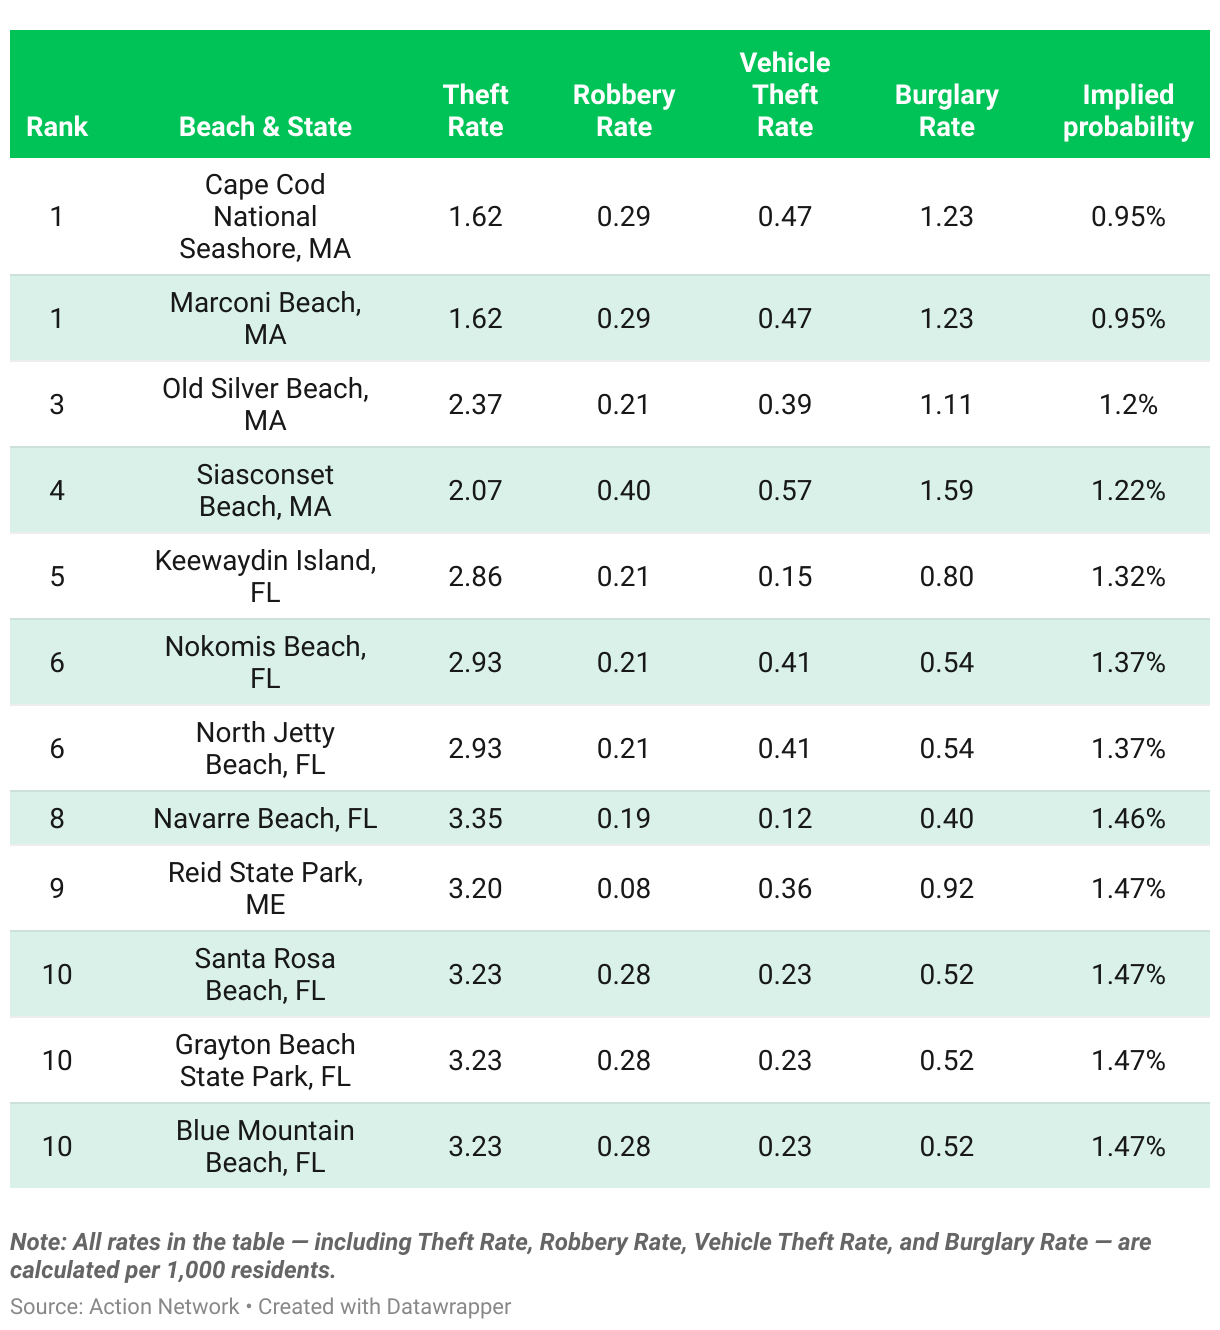
Key Findings: Where Beachgoers Face the Least Risk of Theft
- Cape Cod National Seashore and Marconi Beach (MA) share the top spot with the lowest implied theft risk in the country — just 0.95%, supported by low theft (1.62 per 1,000 residents) and burglary (1.23 per 1,000 residents) rates in the surrounding area.
- Massachusetts dominates the top five with four entries, including Old Silver Beach and Siasconset Beach — all reporting theft rates under 2.5 per 1,000 residents
- Florida also features heavily, with seven beaches in the top 10, most showing very low vehicle theft and burglary rates, highlighting safer conditions in parts of the state’s Gulf and Atlantic coasts.
- Reid State Park in Maine stands out for having the lowest robbery rate among all entries — just 0.08 per 1,000 residents — contributing to its low implied probability of theft at 1.47%.
Which States Have the Most Theft-Prone Beaches?
While over 500 beaches were analyzed, only a handful of states consistently appeared in the top 20 highest-risk locations, based on how often their beaches ranked among those with the greatest risk of theft.
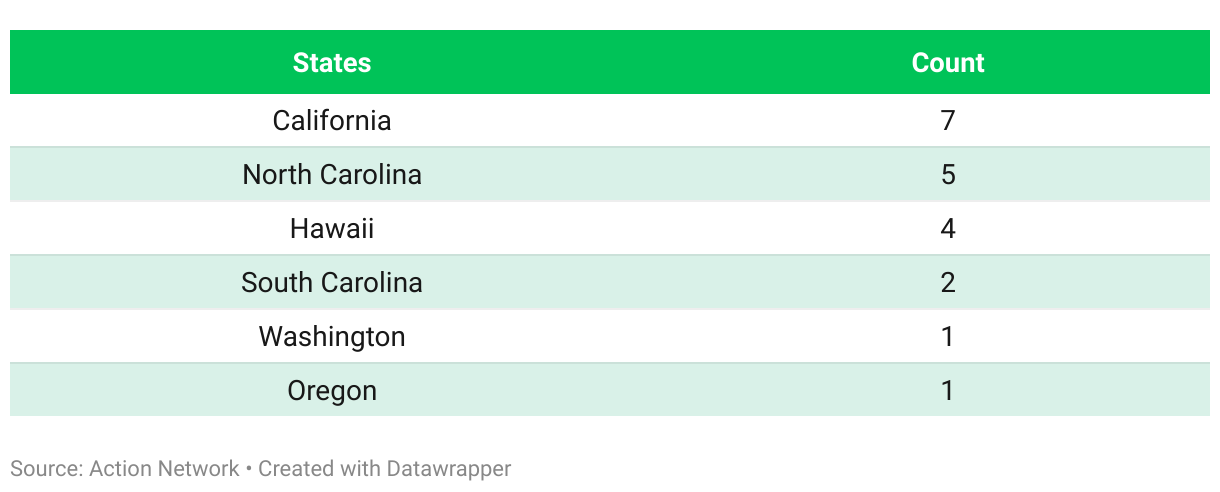
California, North Carolina, and Hawaii account for over 80% of the top 20 highest-risk beach areas, pointing to a clear concentration of theft risk across multiple coastal locations within these states. While states like South Carolina, Washington, and Oregon also made the list, their limited presence suggests the issue is more localized to specific beach regions.
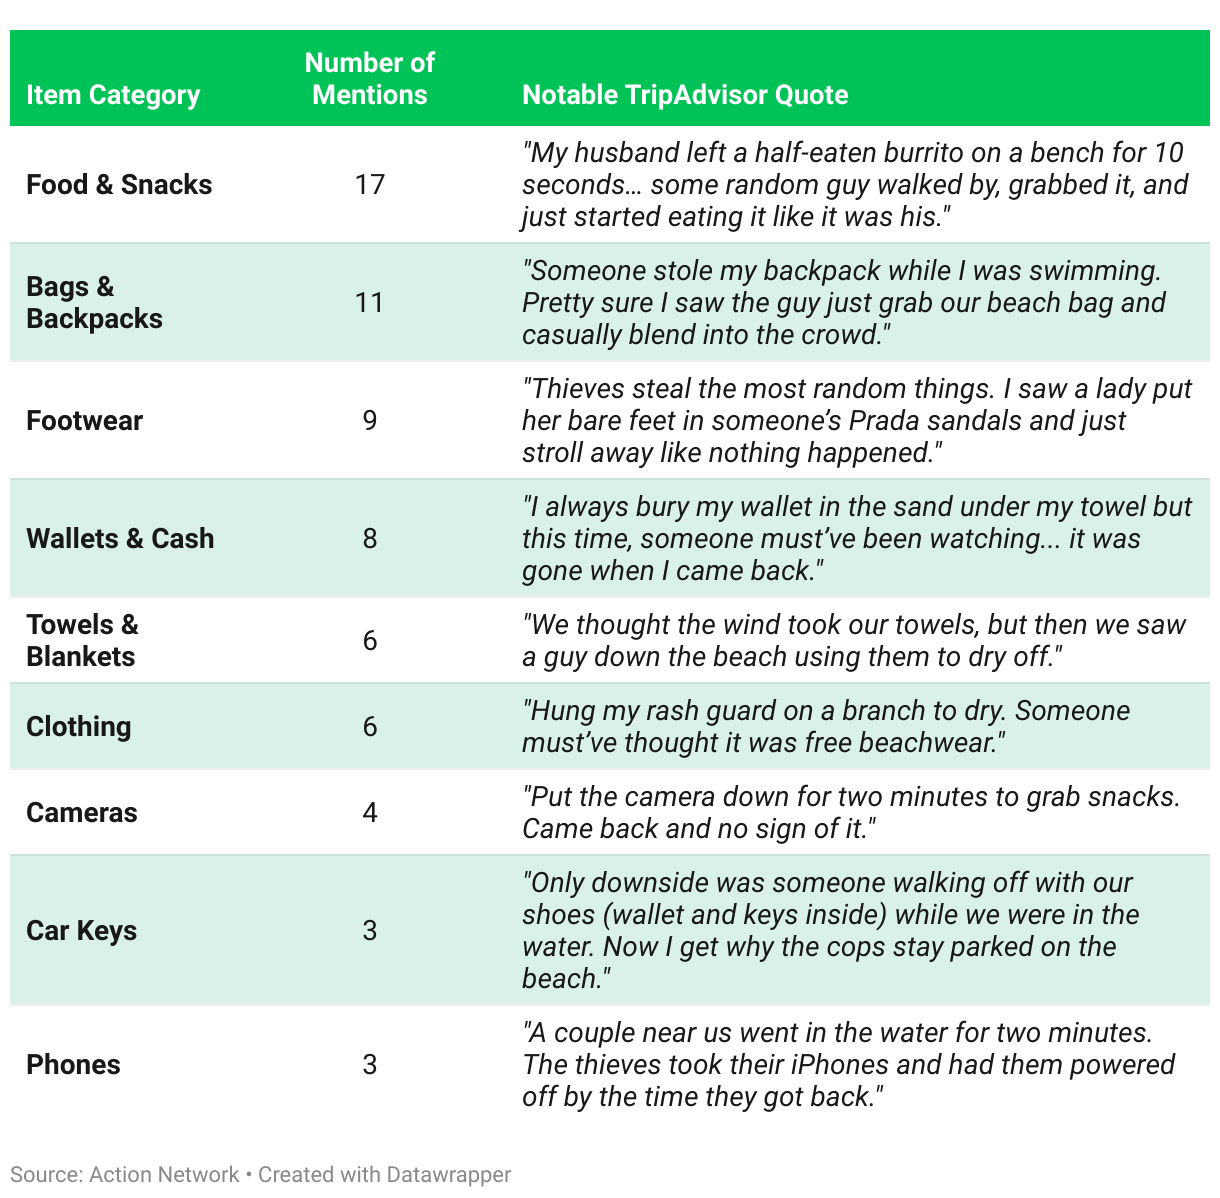
What Beachgoers Are Losing — And Who’s Taking It
From burritos and backpacks to iPhones and even designer sandals, nothing’s safe once you step away from your towel. Based on real TripAdvisor reviews, here’s a breakdown of the most commonly stolen beach items — and what beachgoers are really saying about the ones swiping their stuff.
But Not All Beach Thieves Walk on Two Legs
While most beach thefts are blamed on opportunistic passersby, some beaches in Florida — like Clearwater Beach and Fort De Soto Park — prove that nature can be just as mischievous. From seagulls swiping sandwiches (and even cigars), to raccoons unzipping backpacks and dolphins stealing fish off hooks, the culprits aren’t always human. Florida’s beaches are already notorious for shark encounters, but as these reviews show, even dry land has its fair share of wildlife surprises.
Here are a few notable TripAdvisor reviews that caught our attention:
“The raccoons were fearless. They opened our cooler and stole snacks while we were standing right there.” – Fort De Soto, Florida
“We saw dolphins hanging out by the pier… waiting for people to catch fish so they could snatch them off the line.” – Fort De Soto, Florida
“Seagulls at Clearwater Beach are savages. One stole a cigar right out of my husband’s hand.” – Clearwater Beach, Florida
Turns out, when it comes to beach theft, even the locals with wings, fins, or fur can’t be trusted.
This content was created to inform and entertain both general readers and risk-aware decision-makers. If you enjoy weighing the odds — whether it's spotting theft risk at the beach or testing your luck in a more controlled environment — you might also be interested inFanatics Casino, BetMGM Casino, orDraftKings Casino.
Methodology
To identify which U.S. beaches pose the highest risk of theft or loss, we conducted a data-driven analysis using ZIP-code-level crime statistics most relevant to concerns commonly faced by beachgoers, including theft of personal belongings, vehicle break-ins, and burglaries in areas surrounding beach locations.
1. Collecting Beach and Crime Data
We began by compiling a list of U.S. beaches that could be clearly matched to ZIP codes with accessible, official crime data. Using public beach directories and tools like Zipcodebase, we identified the corresponding ZIP code for each beach location.
Next, we sourced crime data from CrimeGrade.org, which provides detailed ZIP-level crime statistics across the United States.
We focused on four types of property-related crime most relevant to beachgoers:
- Theft – incidents involving unattended bags, phones, wallets, or personal items left on or near the beach.
- Robbery – theft involving force, intimidation, or confrontation in public areas around the beach.
- Vehicle Theft – stolen cars, bikes, or scooters from nearby parking lots or beach access roads.
- Burglary – break-ins reported in the surrounding area, including vacation rentals, accommodations, or storage units near the beach.
Note: Beaches located in ZIP codes with no official crime data were excluded from the final dataset.
2. Scoring & Implied Probability
To calculate overall risk, our analysts applied a weighted scoring model that prioritizes crime types based on both their relevance to beach settings and their frequency. The weights were distributed as follows:
- Theft – 40%
- Robbery – 30%
- Vehicle Theft – 20%
- Burglary – 10%
These weighted scores were used to calculate an implied probability for each beach, providing a simplified and user-friendly snapshot of theft-related risk at each location.


