At the All-Star break, no team in the NBA had been more profitable against the spread than the Boston Celtics. Brad Stevens' team is 34-23-2 (60%) ATS, meaning a $100 bettor would have returned a profit of $971 betting Boston each game this season.
Casual bettors took notice and the Celtics received 50% or more of spread tickets in 54 of 59 games to start the season. The C’s first game back is on Friday in Detroit against the Pistons. Squares will be on Boston, but will the Celtics continue to cover during the second half of the season?
To answer that question using the Bet Labs database, I pulled the pre-All-Star and post-All-Star ATS records for every team since 2005. Then I used the correlation coefficient to determine if there was a relationship between a team’s ATS record before and after the break. A correlation coefficient of 1 indicates perfect correlation, -1 means there is perfect negative correlation and 0 indicates no correlation.
The correlation coefficient between a team’s pre-All-Star ATS record and its post-All-Star ATS record is -0.07. What this tells us is that a team’s ATS record before the All-Star break is not predictive of how it’ll perform against the number down the stretch.
Extreme Regression
Boston isn’t your average team, its pre-All-Star break ATS win percentage of 60% is rare. Less than 10% of teams in our database covered the number at that rate before the break. How did those squads perform over the last quarter of the season?
Looking at all teams that covered 60% or greater ATS before the All-Star break (average of 63% ATS), those same teams covered 47% ATS after the break.
On the other end of the spectrum, the worst teams at covering the spread experience positive regression. This is good news for Cleveland Cavaliers backers who have gone 18-37-1 (33%) ATS, the worst mark in the league this season. Since 2005, teams that covered 40% or less of games before the All-Star break (average among the teams was 39% ATS) managed to hit 54% ATS after the All-Star game.
Boston was the best team ATS before the break, though cracks were beginning to appear in their shiny ATS record. The team has lost three straight ATS and failed to cover in four of its last five games. Cleveland is headed in the opposite direction having covered four in a row.
An NBA team’s ATS record is not predictive. Post-All-Star break regression is coming for the best and worst ATS teams in the league.
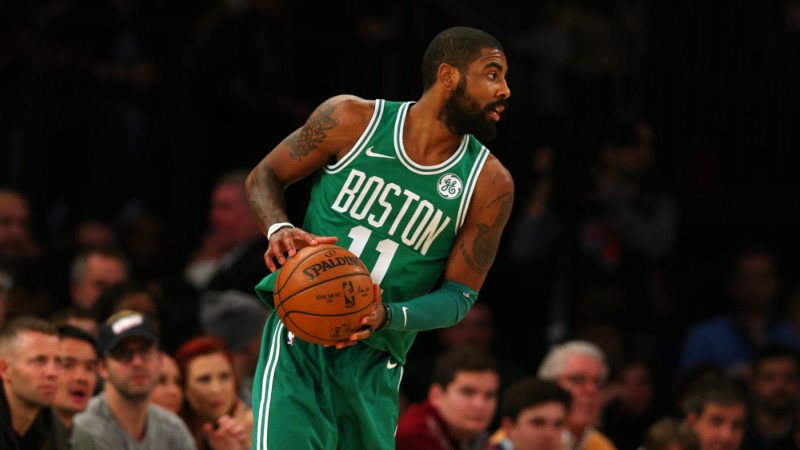
Top photo: Boston Celtics Kyrie Irving
Photo via Brad Penner-USA TODAY Sports


