


Every (ok almost every) week we publish an article detailing what games could be particularly impacted by teams' HAVOC Ratings, whether that be on the offensive or defensive side of the ball as I think those storylines are both interesting and informative.
The only issue? There are several other factors that play into success Against the Spread! For an awesome, in-depth breakdown of what metrics are most important, please check out this piece by our very own Collin Wilson. But, for a quick summary, these factors are the most important that determine ATS Success (in no particular order):
- Havoc
- Success Rate
- Finishing Drives
- Explosiveness
With these factors in mind, let's dive in and see what teams may have an edge in Week 6!
Havoc
Havoc is a college football term defined as a play where there’s an unexpected outcome.
Pass breakups, forced fumbles and tackles for loss are just a few of the plays that cause pandemonium on any given Saturday. These plays, collectively, are used to build an identity for a team. The calculation for Havoc is simply a cumulative number of tackles for loss, interceptions, fumbles and passes defensed divided by the number of plays on both sides of the ball.
Our Havoc portion will look at the defensive Havoc and offensive Havoc allowed each week. Let's dive in!
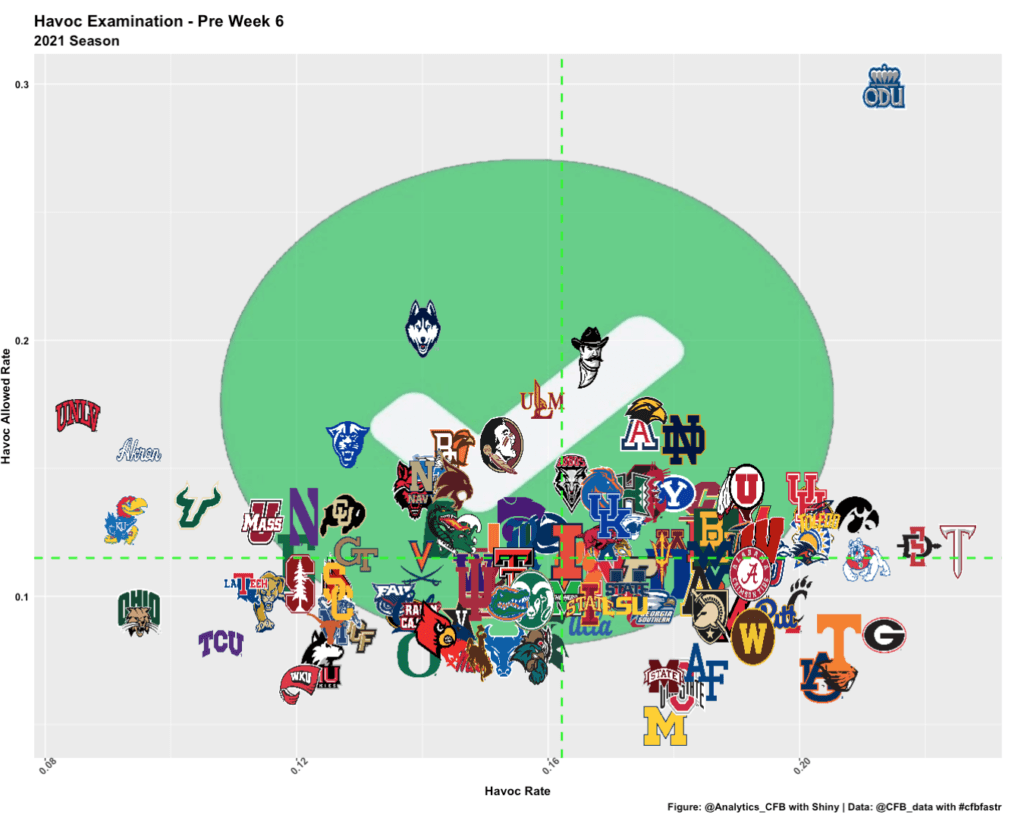
This scatter plot is cool, but its a bit crowded, and it also doesn't dive into this on a matchup level. For reference, bottom right is good, top left is bad (but you could probably guess that by UConn and Akron's locations on the chart!). What if we had a way to view this at a game level?
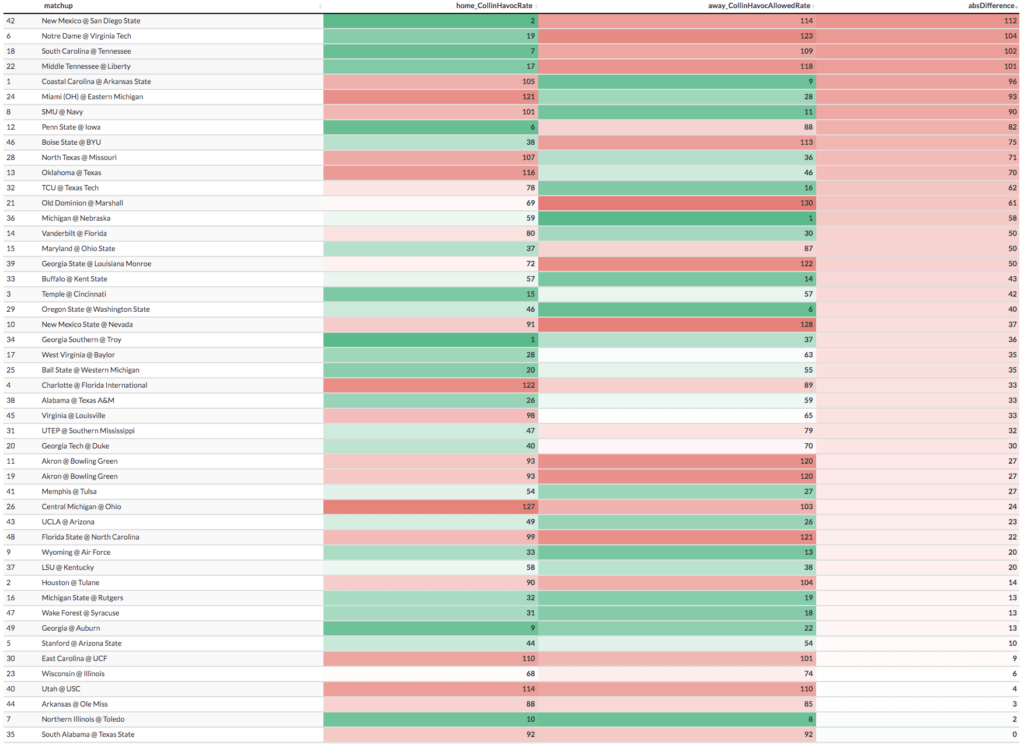
Ah, that's better. So what is this table? It's looking at the ranks of the home team's Havoc Rating Rank vs the away team's Havoc Allowed Rating Rank. For example, this means that New Mexico's offense could be in disarray against a San Diego State team that ranks second in havoc rating.
Notre Dame could run into similar issues against Virginia Tech (a game in which the Fighting Irish are currently favored). This goes all the way down to South Alabama at Texas State where neither team has an edge in this respective part of the game.
Now let's show the away team defenses some love!
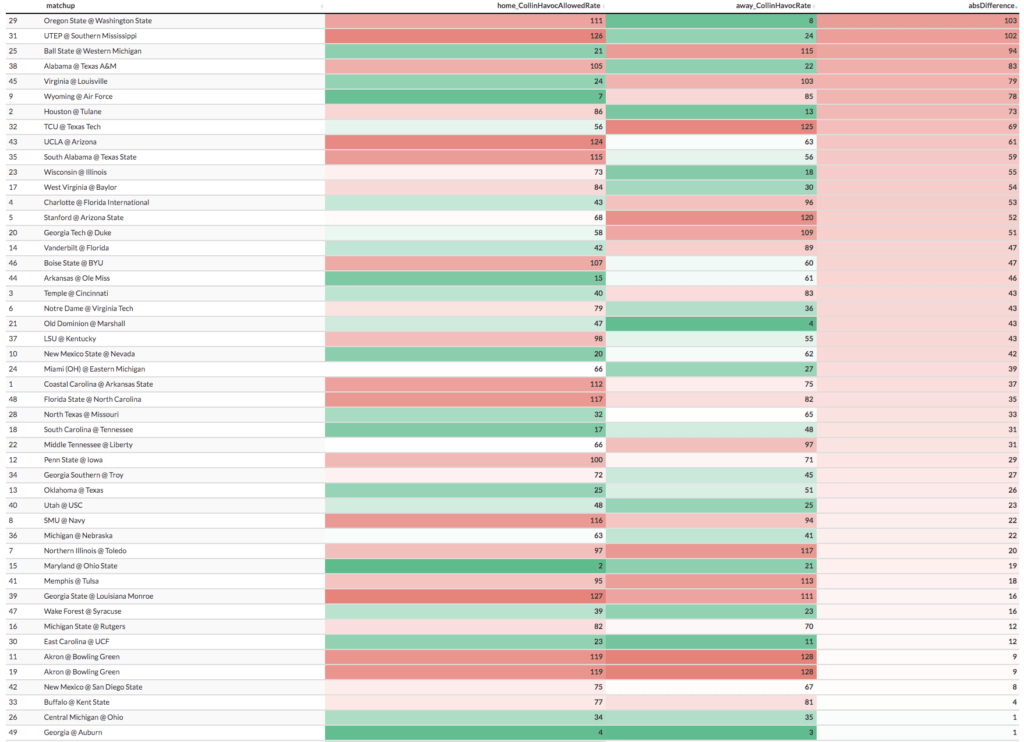
So, the biggest mismatches according to this table are:
- Oregon State's Defense (8th) vs Washington State's Offense (111th)
- UTEP's Defense (24th) vs Southern Mississippi's Offense (126th)
- Western Michigan's Offense (21st) vs Ball State's Defense (115th)

![]()
![]()
![]()
Success Rate
To start – what is success rate?
Success rate is an advanced metric in football that measures efficiency, but with the important context of down and distance considered.
A play is defined as successful if:
- It gains at least 50% of the yards required to move the chains on first down
- 70% of yards to gain on second down
- 100% of yards to gain on third or fourth down
To calculate success rate, simply divide the number of successful plays (as defined by down and distance above) by total plays.
This definition is straight from our article on success rate. So, who excels at moving the chains?
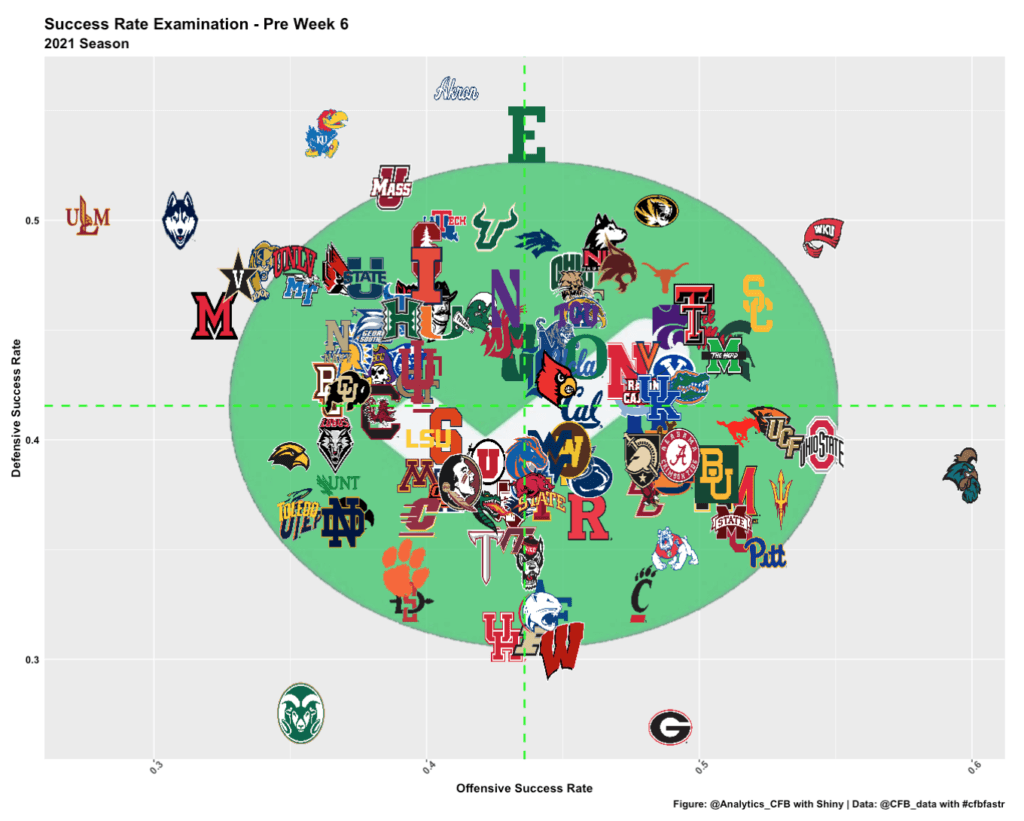
For this chart, bottom right is good, and top left is bad (though once again, Akron and UConn probably gave that away). My most interesting takeaway from this chart is the fact that Georgia and Alabama's offenses are on the same level, but the Dawgs' defense is much better at this point in the season.
Let's do the same thing we did with Havoc and check this out on a game level.
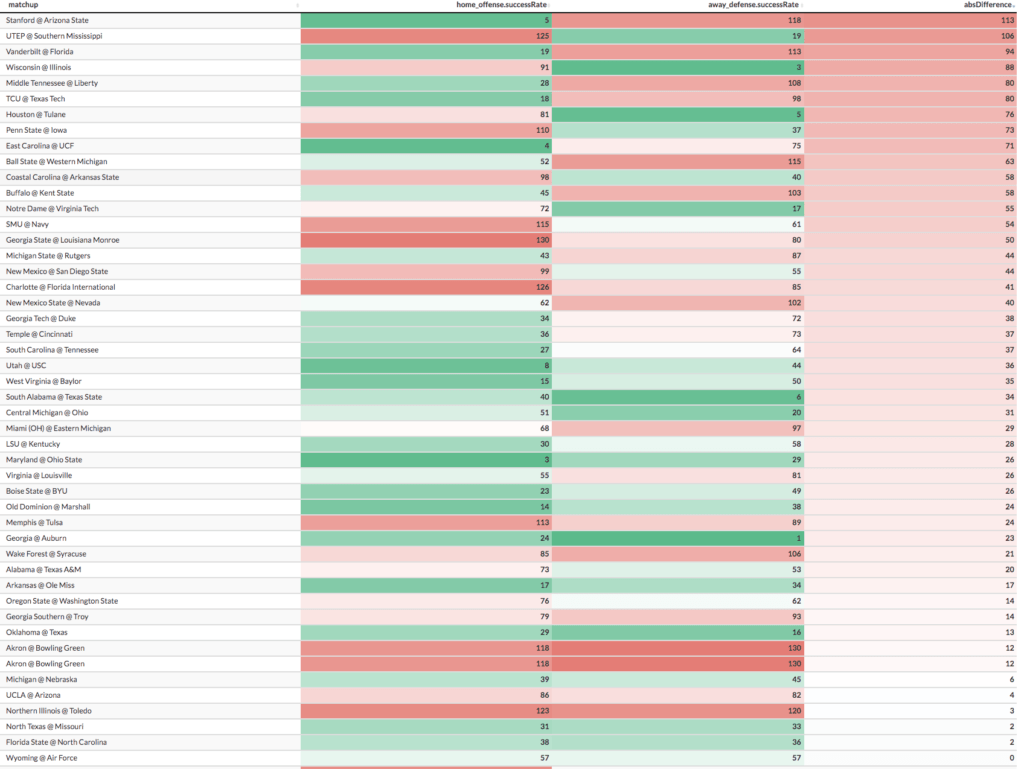
This table is the Home Team's Success Rate vs the Away Team's Success Rate Allowed. The biggest mismatches here are:
- Arizona State's Offense (5th) vs Stanford's Defense (118th)
- UTEP's Defense (19th) vs Southern Mississippi's Offense (125th)
- Florida's Offense (19th) vs Vanderbilt's Defense (113th)
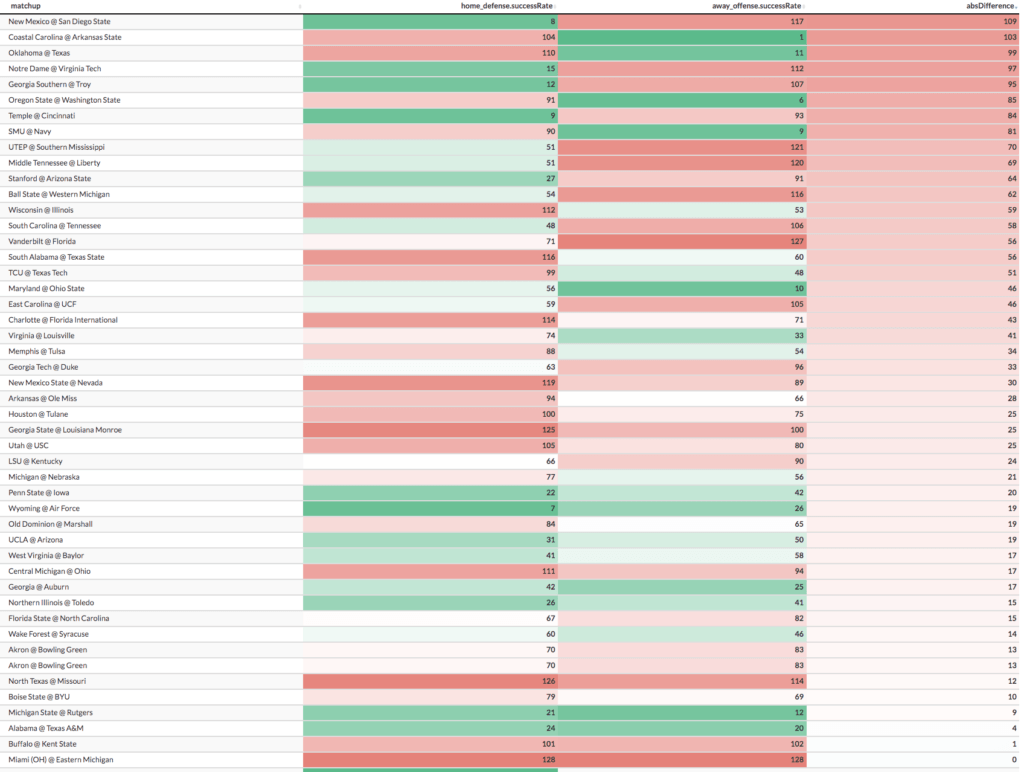
This table is the Home Team's Success Rate Allowed vs the Away Team's Success Rate. The biggest mismatches here are:
- San Diego State's Defense (8th) vs New Mexico's Offense (117th)
- Coastal Carolina's Offense (1st) vs Arkansas State's Defense (104th)
- Oklahoma's Offense (11th) vs Texas' Defense (110th)
Finishing Drives
Finishing Drives is points per opportunity when the offense is past the 40 Yard Line. Defensively, this is how many points per opportunity a defense allows when the opposing offense crosses the 40 yard line. 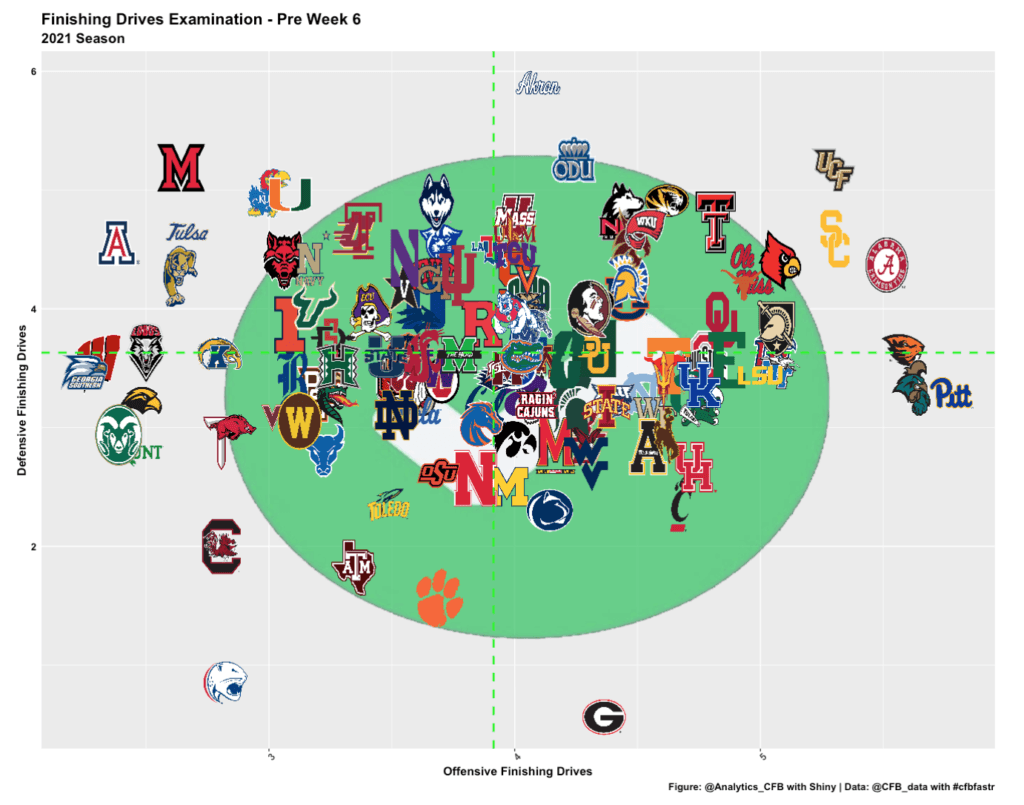
Once again, top left is bad, bottom right is good (holy cow Georgia!), but let's break this down by game to make it easier to examine.
First up, the Home Team's Offensive Finishing Drives vs the Away Team's Defensive Finishing Drives:
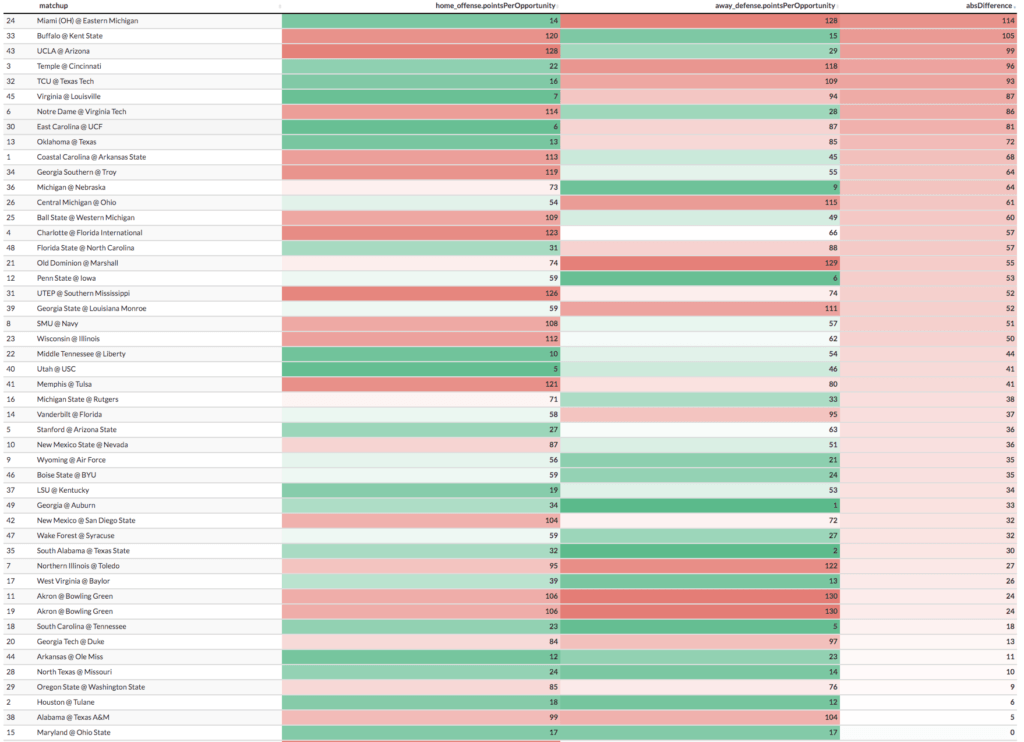
Biggest Mismatches:
- Eastern Michigan's Offense (14th) vs Miami (OH)'s Defense (128th)
- Buffalo's Defense (15th) vs Kent State's Offense (120th)
- UCLA's Defense (29th) vs Arizona's Offense (128th)
Now let's take a look at the Home Team's Defensive Finishing Drives Rankings vs the Away Team's Finishing Drive Rankings.
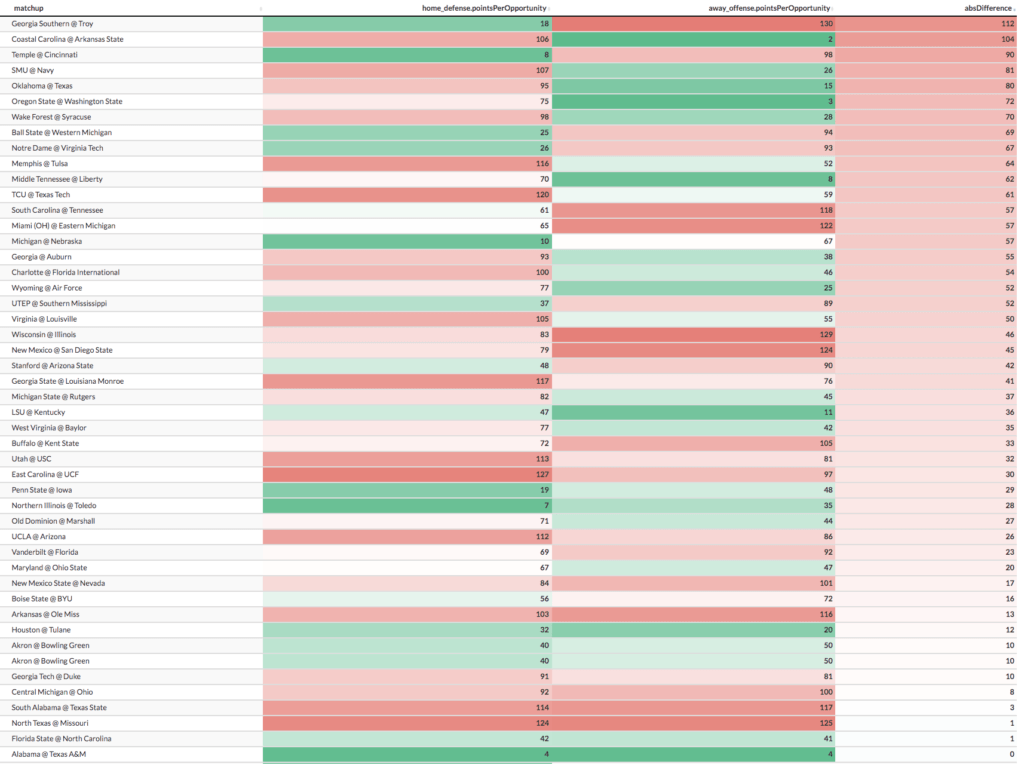
Biggest Mismatches:
- Troy's Defense (18th) vs Georgia Southern's Offense (130th)
- Coastal Carolina's Offense (2nd) vs Arkansas State's Defense (106th)
- Cincinnati's Defense (8th) vs Temple's Offense (98th)
Explosiveness
Per Collegefootballdata.com, Explosiveness measures the average EPA on plays which were marked as successful. We are using this definition since we are using their metrics.
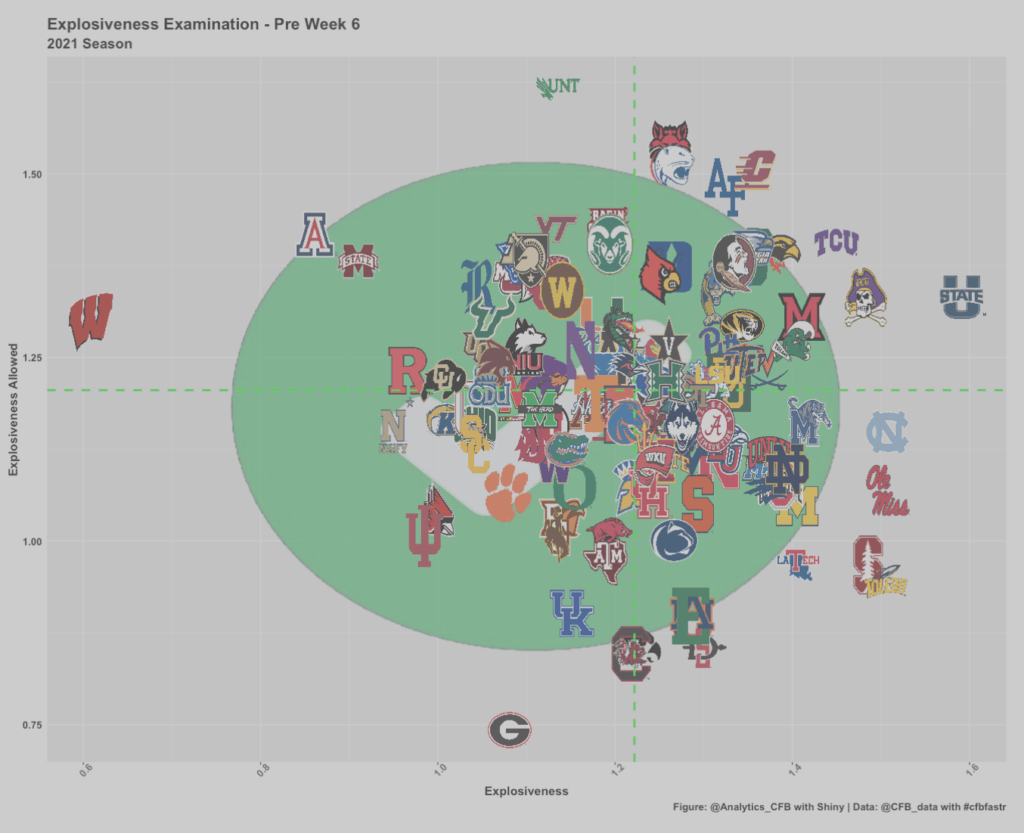
Wisconsin, something has to change. I also do not expect to see a Mike Leach-coached team in the bottom three of offensive explosiveness. Meanwhile, in the era of run-and-gun SEC football we may be witnessing a historic defense in Athens.
Let's break this down at a game level, first looking at Home Explosiveness vs Away Explosiveness Allowed.
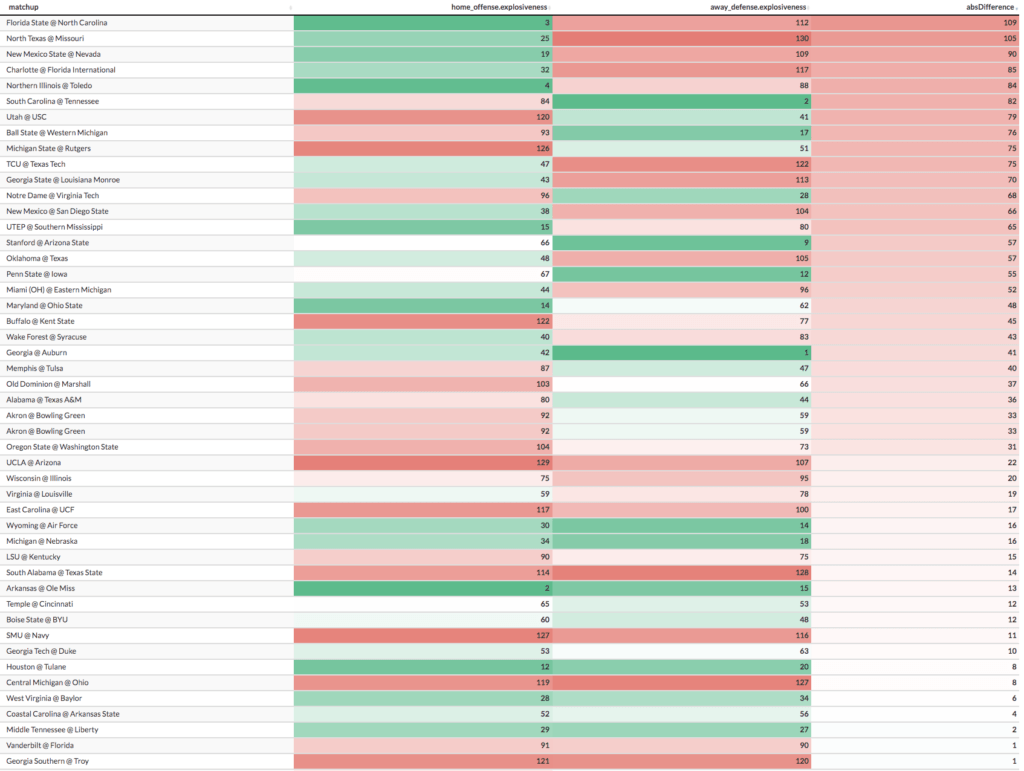
Biggest Mismatches:
- North Carolina's Offense (3rd) vs Florida State's Defense (112th)
- Missouri's Offense (25th) vs North Texas' Defense (130th)
- Nevada's Offense (19th) vs New Mexico State's Defense (109th)
Now let's look at Home Explosiveness Allowed vs Away Explosiveness.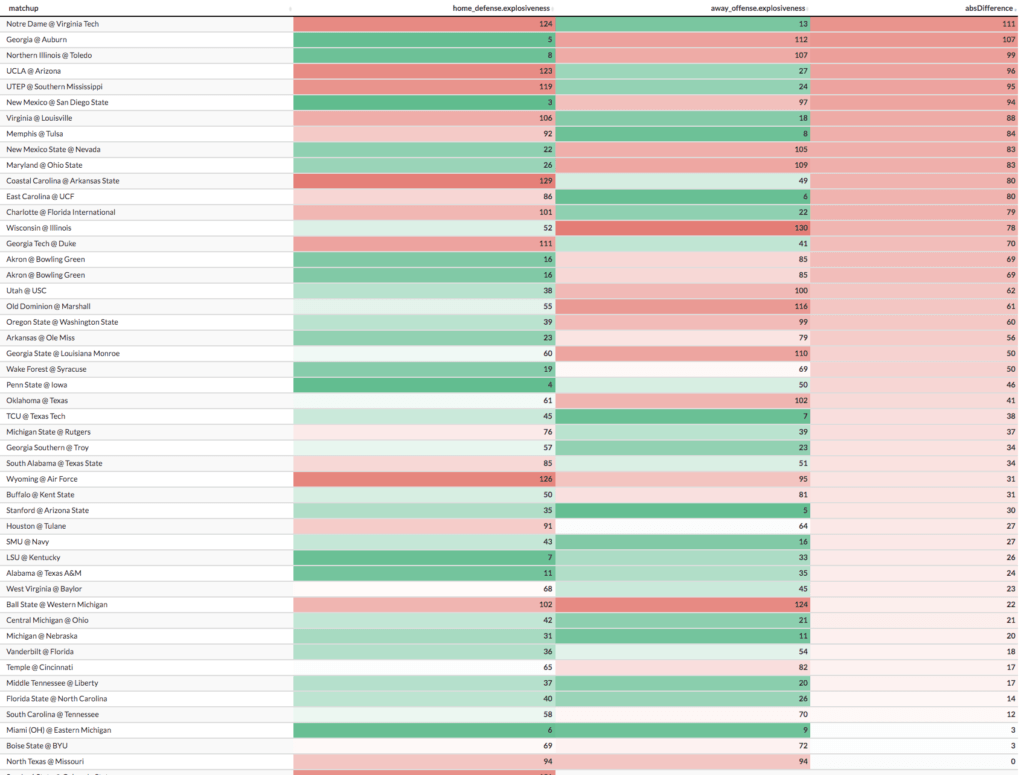
Biggest Mismatches:
- Notre Dame's Offense (13th) vs Virginia Tech's Defense (124th)
- Auburn's Defense (5th) vs Georgia's Offense (112th)
- Toledo's Defense (8th) vs Northern Illinois' Offense (107th)
Takeaways
So you've seen all these tables, now what? How does this apply to betting? Well, one game I keep seeing pop up as a mismatch is Oklahoma's Offense vs Texas' Defense, particularly in Success Rate. So, let's take a deeper dive into that game: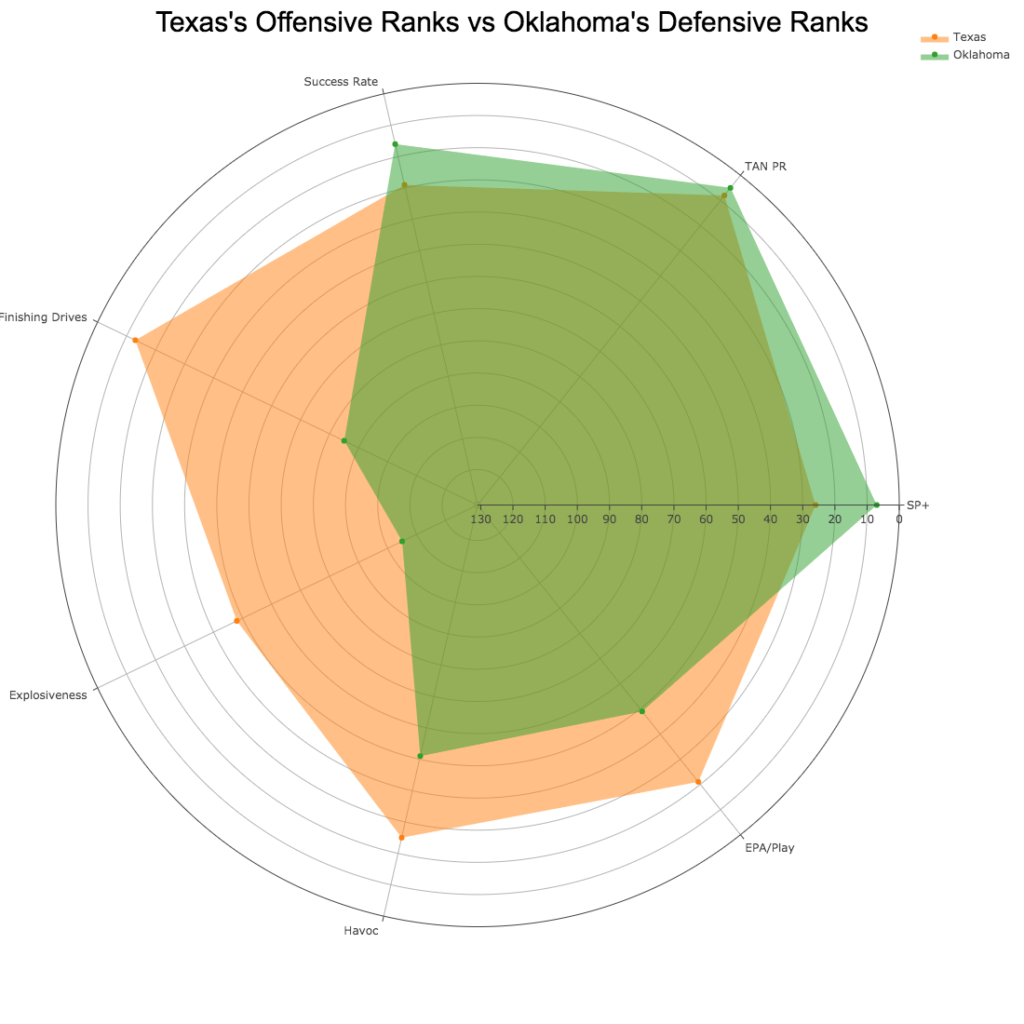
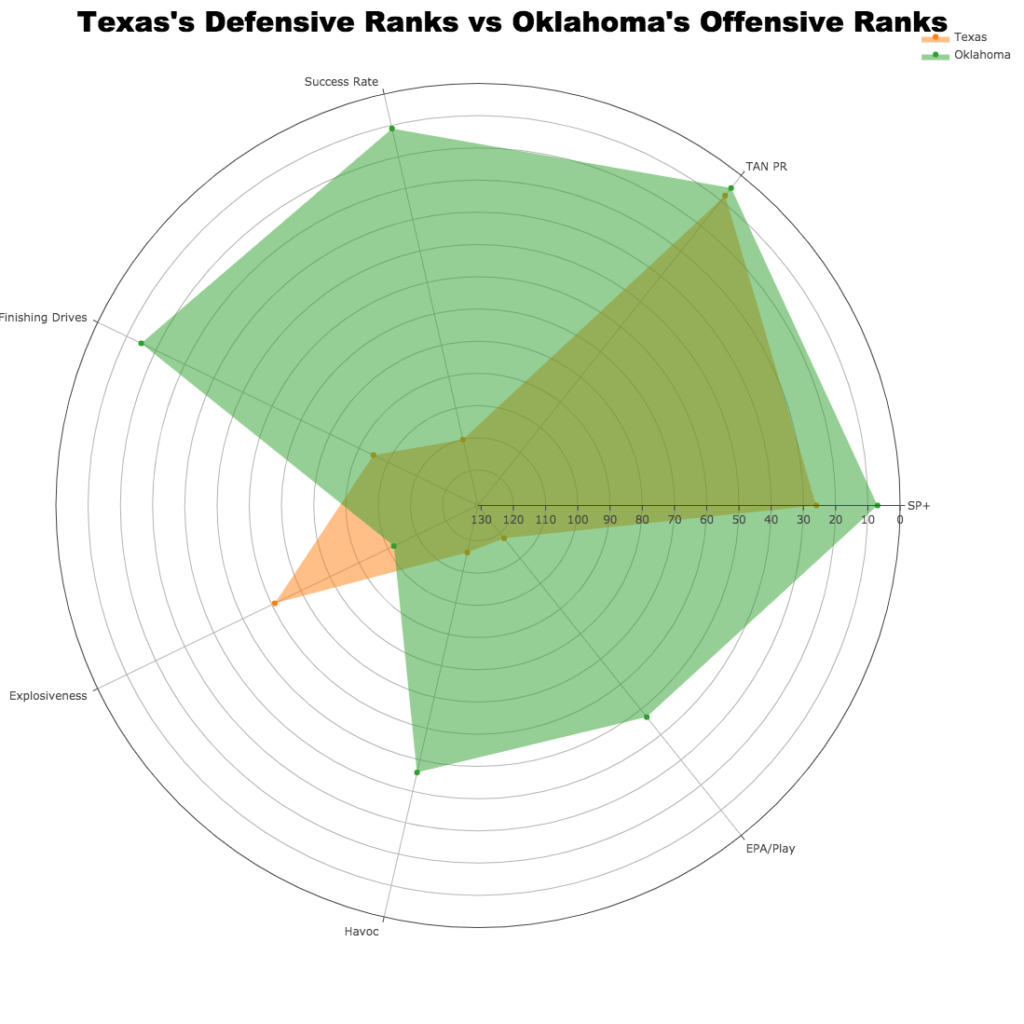
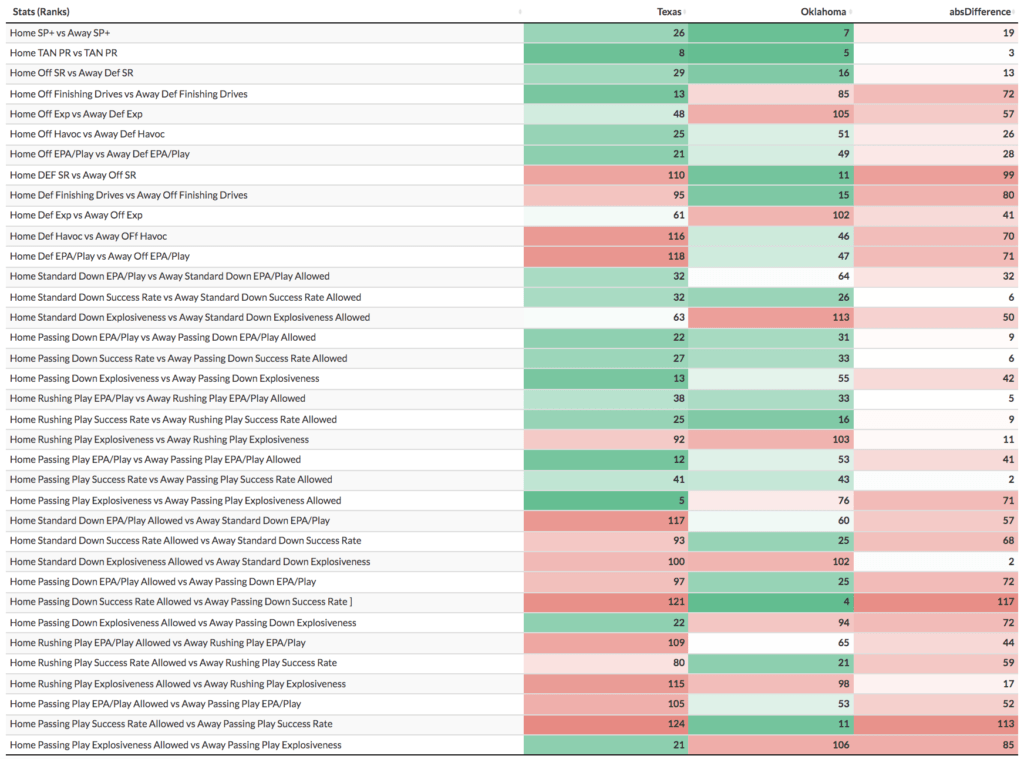
I am seeing a massive mismatch between Oklahoma's Offense and Texas's Defense, while this looks like a relatively even matchup between Oklahoma's Defense and Texas's Offense. The spread on this game is Oklahoma -3.5, after opening at Circa at -3. I think this line will move in Oklahoma's direction as the week progresses, so I would grab Oklahoma -3.5 while you still can, and absolutely snag any -3 numbers you see throughout the week.
If you like breakdowns like this, check out our Twitter, where we post these charts for almost every game each weekend! If you want to see a certain game and it is not up yet, feel free to give us a shout and we are happy to oblige!

![]()
![]()
![]()


