
NCAAF Teams
Big Ten
 Illinois Fighting Illini
 Indiana Hoosiers
 Iowa Hawkeyes
 Maryland Terrapins
 Michigan State Spartans
 Michigan Wolverines
 Minnesota Golden Gophers
 Nebraska Cornhuskers
 Northwestern Wildcats
 Ohio State Buckeyes
 Oregon Ducks
 Penn State Nittany Lions
 Purdue Boilermakers
 Rutgers Scarlet Knights
 UCLA Bruins
 USC Trojans
 Washington Huskies
 Wisconsin Badgers
ACC
 Boston College Eagles
 California Golden Bears
 Clemson Tigers
 Duke Blue Devils
 Florida State Seminoles
 Georgia Tech Yellow Jackets
 Louisville Cardinals
 Miami (FL) Hurricanes
 North Carolina State Wolfpack
 North Carolina Tar Heels
 Pittsburgh Panthers
 SMU Mustangs
 Stanford Cardinal
 Syracuse Orange
 Virginia Cavaliers
 Virginia Tech Hokies
 Wake Forest Demon Deacons
Big 12
SEC
PAC-12
SBC
 Appalachian State Mountaineers
 Arkansas State Red Wolves
 Coastal Carolina Chanticleers
 Georgia Southern Eagles
 Georgia State Panthers
 James Madison Dukes
 Louisiana Ragin' Cajuns
 Marshall Thundering Herd
 Old Dominion Monarchs
 South Alabama Jaguars
 Southern Miss Golden Eagles
 Texas State Bobcats
 Troy Trojans
 UL-Monroe Warhawks
CUSA
American
MAC
MWC
FBS (Ind)
2024 College Football Preview
After an entertaining 2023 season of NCAA football, we are ready for an even more exciting 2024 season. This year we have more conference realignments than you can count on two hands, which brings with it a boatload of tasty matchups between powerhouse teams. After what should be a great regular season, we will be treated to the first year of an expanded 12-team playoff. 2024 promises to be one of the best college football seasons in recent memory, and Action Network is your home for all the info you need to get ready for each week's slate of games.
On this page, you'll find links to betting team pages for every FBS college football team. Those pages are loaded with team information and betting data, including season schedules, odds for every game, against-the-spread (ATS) performance, injuries, news, depth charts, standings, and much more.
How to Bet on College Football
If you're new to the world of college football betting, get to know a few of the key and most popular markets: point spreads, totals, and moneylines.
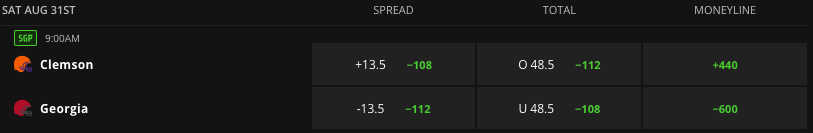
Here is an example of how a college football game appears on a sportsbook website or app:
Point Spread
Let's talk about the point spread bet (listed as "spread" in the image above), which is the most popular type of wager in U.S. online sports betting. These bets are simply wagers on how much a team will win or lose a game by. Using the example above, we see the following:
- Clemson: +13.5 -108
- Georgia: -13.5 -112
The teams have the same numbers next to them, but the plus and minus signs are critical. The plus sign indicates which team is the underdog, a term for the team less likely to win. The minus sign is for the favorite, or the team more likely to win.
In this example, the Clemson Tigers are 13.5-point underdogs to Georgia, which means if you bet on them you would win your wager if they won the game outright or lost by up to 13 points. Georgia bettors would need a victory by at least 14 points to cash.
The other numbers (-108 and -112) are the price for each wager. If you bet $108 on Clemson and they win or lose by fewer than 13 points, you win $100. It costs a bit more ($112) to win $100 on Georgia. Most of the time, these numbers are at -110 for each side, but in big games like this one, we can see different prices due to the volume of wagers coming in on the game.
Many college football bettors enjoy referencing against-the-spread (ATS) records, which are indicative of how often a team "covers the spread."
Totals
Totals is another popular wager type. Also known as over/under, this is a simple bet on whether the total score will be above or below a certain number. Totals can be for a quarter, half, or the entire game. You can also bet on over or under the number of points a team will score. Totals are also available as a live wager, with the number changing throughout the game.
In the above example, the O 48.5 is the total points for both teams combined, not just Clemson. It can be a little confusing because it's listed in the Clemson line, but that's just the way the sportsbooks list the numbers. Again, we see -112 and -108 listed. This means that slightly more $ is coming in on the Over because it is priced slightly higher. Sometimes, the sportsbooks adjust the prices instead of adjusting the total number.
Moneyline
A moneyline wager is the simplest bet type. You are just picking which team will win the game. No point spread involved. If the team you pick wins the game, you win the bet. Of course, the price can vary wildly between teams, particularly if a team is heavily favored.
In the matchup listed above, Georgia is listed as a 6/1 favorite (-600), so if you want to bet on them to win the game, you have to wager a lot more to make the same amount of money. In this case, you would have to wager $600 to win $100. This is not a good value because it ties up a lot of your bankroll, and, of course, there is still a chance Clemson could win the game, in which case you would lose your entire $600 wager. Still, if you're confident Georgia will win but aren't sure they will win by 14+, a moneyline wager is your best option.
College Football Win Totals
Futures bets are incredibly fun wager types that don't revolve around a single game. They refer to any bet that is settled at the end of the season. Examples include regular season win totals, Heisman Trophy odds, national title odds, and more.
Regular season win totals for college football have become quite popular in recent years, as you can really buy or fade a particular team. Sportsbooks will list a number of how many games a team should win in the regular season, and bettors can wager either "over" or "under" that number.
Here are the win totals for every FBS college football team entering the 2024 season. All numbers are courtesy of our friends at FanDuel and were accurate as of August 27, 2024.
SEC
- Alabama: 9.5
- Georgia: 10.5
- Texas A&M: 8.5
- Florida: 4.5
- LSU: 9.5
- Ole Miss: 9.5
- Missouri: 9.5
- Auburn: 7.5
- Kentucky: 6.5
- Tennessee: 8.5
- Mississippi State: 4.5
- Arkansas: 4.5
- South Carolina: 5.5
- Vanderbilt: 2.5
- Oklahoma: 7.5
- Texas: 10.5
Big Ten
- Ohio State: 10.5
- Wisconsin: 6.5
- Penn State: 9.5
- Iowa: 8.5
- Michigan: 8.5
- Indiana: 5.5
- Minnesota: 5.5
- Northwestern: 4.5
- Nebraska: 7.5
- Maryland: 6.5
- Purdue: 4.5
- Michigan State: 4.5
- Rutgers: 6.5
- Illinois: 5.5
- Washington: 6.5
- Oregon: 10.5
- USC: 7.5
- UCLA: 4.5
Big 12
- Arizona: 7.5
- Arizona State: 4.5
- Iowa State: 7.5
- Texas: 8
- Oklahoma State: 8.5
- TCU: 7.5
- West Virginia: 6.5
- Kansas State: 9.5
- Baylor: 5.5
- BYU: 4.5
- Cincinnati: 5.5
- Colorado: 5.5
- Houston: 3.5
- Texas Tech: 7.5
- UCF: 7.5
- Utah: 9.5
- Kansas: 8.5
ACC
- Clemson: 8.5
- UNC: 7.5
- Miami: 9.5
- Boston College: 4.5
- Pittsburgh: 5.5
- Virginia Tech: 8.5
- Wake Forest: 4.5
- Louisville: 8.5
- NC State: 8.5
- Virginia: 4.5
- Florida State: 8.5
- Georgia Tech: 5.5
- Duke: 5.5
- Syracuse: 7.5
- Cal: 6.5
- Stanford: 3.5
- SMU: 7.5
PAC-12
- Washington State: 7.5
- Oregon State: 7.5
Independent Schools
- Notre Dame: 10.5
- Connecticut: 4.5
- Massachusetts: 3.5
AAC
- Army: 5.5
- Charlotte: 3.5
- Memphis: 9.5
- Tulsa: 4.5
- Tulane: 7.5
- East Carolina: 6.5
- Navy: 5.5
- South Florida: 7.5
- Temple: 2.5
- FAU: 6.5
- North Texas: 5.5
- Rice: 6.5
- UAB: 6.5
- UTSA: 8.5
Conference USA
- Jacksonville State: 7.5
- Kennesaw State: 2.5
- Liberty: 10.5
- Western Kentucky: 7.5
- Middle Tennessee: 4.5
- New Mexico State: 4.5
- Louisiana Tech: 4.5
- Sam Houston State: 4.5
- FIU: 4.5
- North Texas: 4
- UTEP: 4.5
MAC
- Buffalo: 8.5
- Ball State: 4.5
- Toledo: 8.5
- Ohio: 6.5
- Eastern Michigan: 4.5
- Central Michigan: 5.5
- Western Michigan: 6.5
- Kent State: 2.5
- Miami (OH): 7.5
- Northern Illinois: 6.5
- Akron: 3.5
- Bowling Green: 6.5
Mountain West
- Boise State: 9.5
- Wyoming: 6.5
- Nevada: 2.5
- San Jose State: 4.5
- Air Force: 6.5
- San Diego State: 5.5
- Hawaii: 5.5
- Fresno State: 7.5
- Colorado State: 6.5
- New Mexico: 2.5
- Utah State: 5.5
- UNLV: 7.5
Sun Belt
- Coastal Carolina: 6.5
- James Madison: 8.5
- Louisiana: 7.5
- Marshall: 5.5
- Old Dominion: 4.5
- Appalachian State: 8.5
- Troy: 6.5
- Georgia State: 4.5
- Georgia Southern: 5.5
- South Alabama: 6.5
- Southern Miss: 4.5
- Arkansas State: 6.5
- UL Monroe: 2.5

- Online Sports Betting

- New York Sports Betting

- Louisiana Sports Betting

- Illinois Sports Betting

- Pennsylvania Sports Betting

- Colorado Sports Betting

- Virginia Sports Betting

- New Jersey Sports Betting

- Michigan Sports Betting

- Arizona Sports Betting

- Kentucky Sports Betting

- Canada Sports Betting

- Ontario Sports Betting


- bet365

- Fanatics Sportsbook

- BetMGM

- DraftKings

- Caesars Sportsbook

- theScore Bet

- Fliff (Social Free to Play)

- Kalshi (Exchange)

- BetRivers

- Underdog (DFS)

- PrizePicks (DFS)

- Dabble (DFS)

- Sleeper (DFS)

- Betr Picks (DFS)

- DraftKings Pick6 (DFS)
- Bleacher Nation (DFS)

- Vivid Picks (DFS)

- Splash Sports (DFS)

- OwnersBox (DFS)

- SuperDraft (DFS)

- FanDuel


