


It's Thursday, and we have college football on tonight! This means it's time to adequately prepare bettors to do battle with sportsbooks this weekend. As a reminder, this is a weekly article that takes a look at each matchup through the lens of four metrics:
- Havoc
- Success Rate
- Finishing Drives
- Explosiveness
If you are interested in why these metrics have been chosen, check out this piece by Collin Wilson. To quote his findings:
"Data from the past five years indicates defensive Success Rate, Havoc and Finishing Drives are the biggest indicators in beating oddsmakers this college football season."
We're throwing explosiveness in here as well! With that in mind, let's dive in and see where we can find an edge in Week 7!
Havoc
Havoc is a college football term defined as a play where there’s an unexpected outcome.
Pass breakups, forced fumbles and tackles for loss are just a few of the plays that cause pandemonium on any given Saturday. These plays, collectively, are used to build an identity for a team.
The calculation for Havoc is simply a cumulative number of tackles for loss, interceptions, fumbles and passes defensed divided by the number of plays on both sides of the ball. Let's take a look at how each team's havoc rate and havoc allowed rate compare:
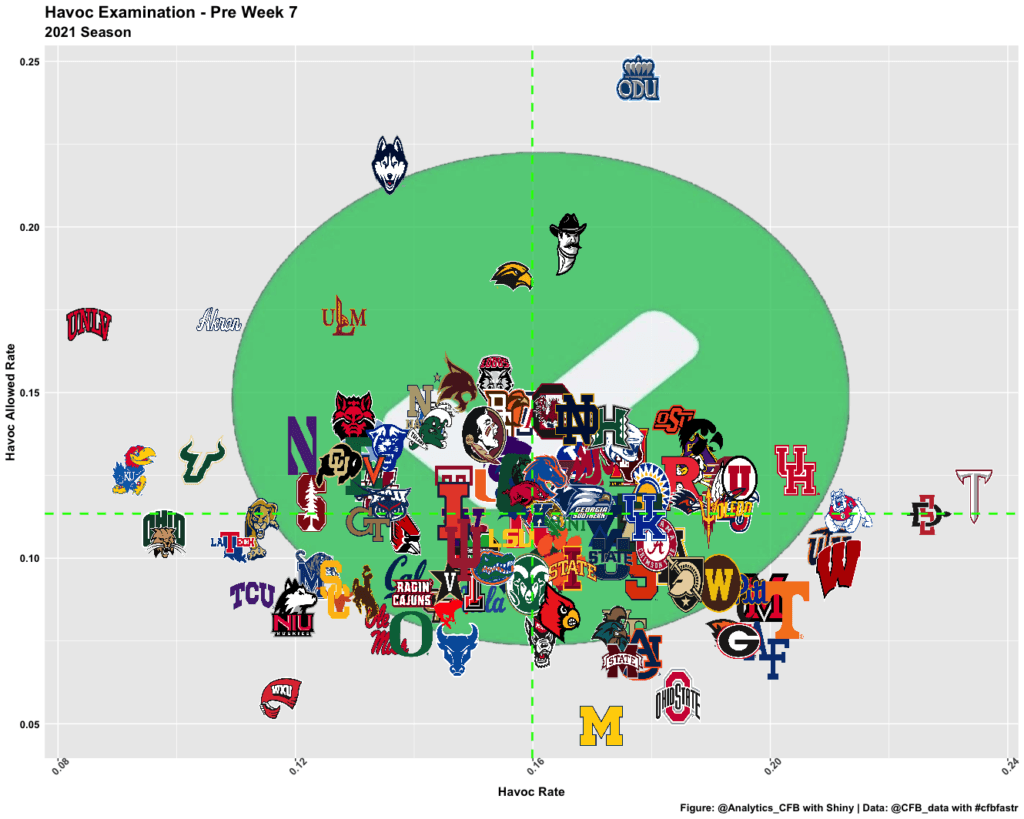
How do you read this chart? Bottom right is good, top left is bad. The Quadrant of Shame this year includes UNLV, Akron, ULM and UConn. Obviously there are other teams in that section, but these are outliers. Old Dominion is horrific on offense, but their slightly above average Havoc Rate keeps them out of that dreaded quadrant.
Some other takeaways from this chart:
- Troy's Defense has been on point this year!
- Michigan, Ohio State, and Wisconsin have all managed to keep opposing defenses from wreaking havoc on their offense, but in different ways. When we look at success rate, explosiveness and finishing drives, keep an eye on these three teams. Wisconsin LOOKS like they should be among the nation's elite if you only took this chart into account. This exact case is why you need to keep more than one metric in mind when you look at how teams stack up against each other.
- Alabama and Clemson are extremely middle of the pack this year.
- TCU's Defensive Havoc rate is shockingly low for a Gary Patterson Coached team. With Caleb Williams getting the nod for the Sooners this week, the Horned Frogs could be in for a world of hurt.
- Don't be surprised if the Mississippi State Bulldogs put up enough points against Alabama to keep it close, especially early.
- For being a top-three team, Iowa allows a lot of Havoc on Offense. This will come back to haunt them against another elite team.
- Want to know the impact of Kayvon Thibodeaux not playing for Oregon? They rank 100th in Havoc after losing him in Week 2.
- Navy being in the bottom ten of Havoc Allowed is shocking for a service academy. Their Triple Option style of play is usually great at limiting defensive disruption.
This is a great chart, but it doesn't tell us much on a game level. Don't worry, I've got those for you as well. First up: each Home Team's Havoc Rate vs each Away Team's Havoc Allowed Rate:
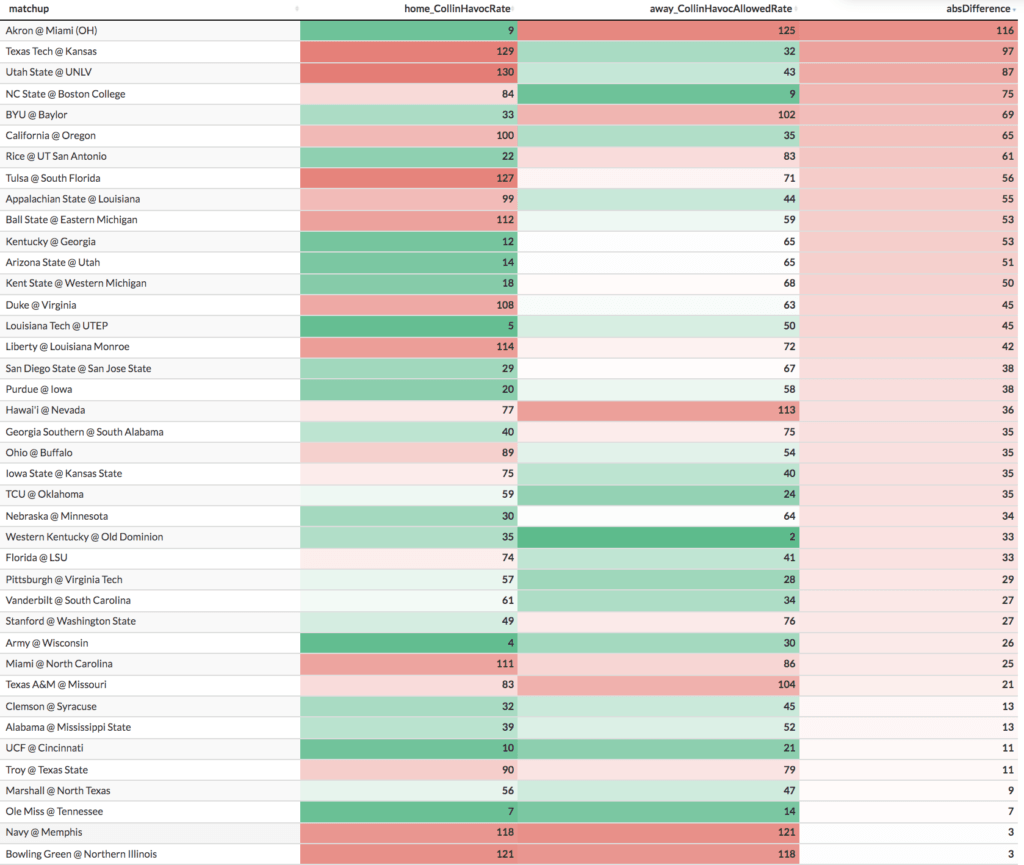
Biggest Mismatches
- Miami (OH)'s Defense vs Akron's Offense (if you've been reading these articles, you know Akron is a frequent flier on the mismatch list)
- Texas Tech's Offense vs Kansas' Defense
- Utah State's Offense vs UNLV's Defense
Now let's look at each Home Team's Havoc Allowed Rate vs each Away Team's Havoc Rate:
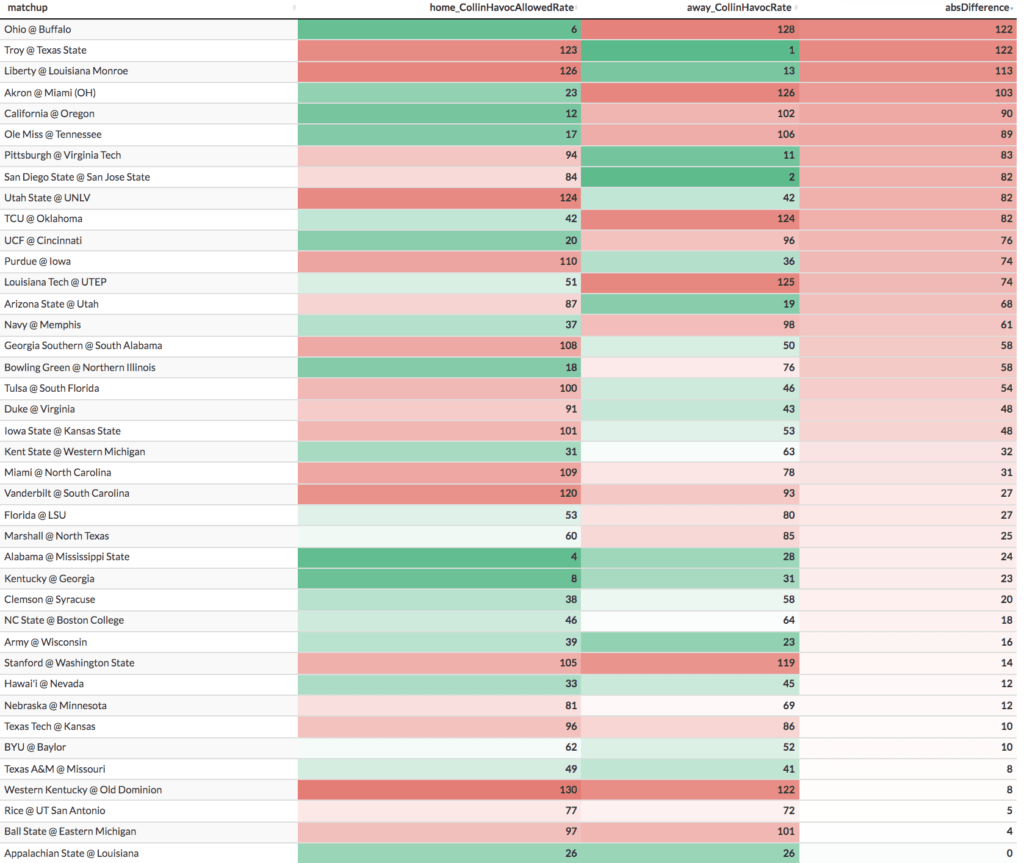
Biggest Mismatches
- Buffalo's Offense vs Ohio's Defense
- Troy's Defense vs Texas State's Offense
- Liberty's Defense vs ULM's Offense
Success Rate
What is success rate?
Success rate is an advanced metric in football that measures efficiency, but with the important context of down and distance considered.
A play is defined as successful if:
- It gains at least 50% of the yards required to move the chains on first down
- 70% of yards to gain on second down
- 100% of yards to gain on third or fourth down
To calculate success rate, simply divide the number of successful plays (as defined by down and distance above) by total plays.
This definition is straight from our article on success rate. So, who excels at moving the chains?
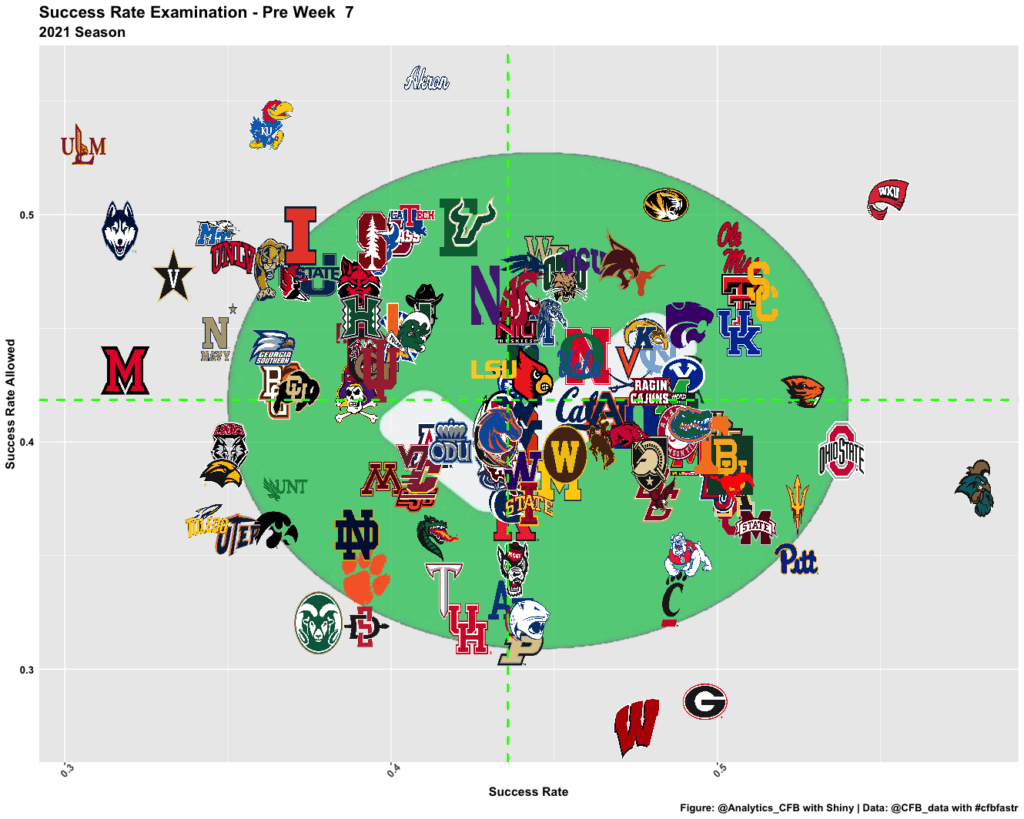
Once again, top left is bad and bottom right is good!
- San Diego State looked great on the Havoc chart but not so much here offensively.
- Pitt is quietly cementing its position as the team to beat in the ACC Coastal, and (I never though I'd say this in my lifetime) an ACC championship game of Wake Forest and Pitt could have CFP implications.
- Western Kentucky has the offense to be an elite Group of 5 team but their defense… yikes.
- Notre Dame is much worse than their record.
- Kentucky's Offense vs Georgia's Defense will be a great matchup this weekend.
Lets do a game level look now. First up, is each home team's Success Rate vs each away team's Success Rate Allowed:
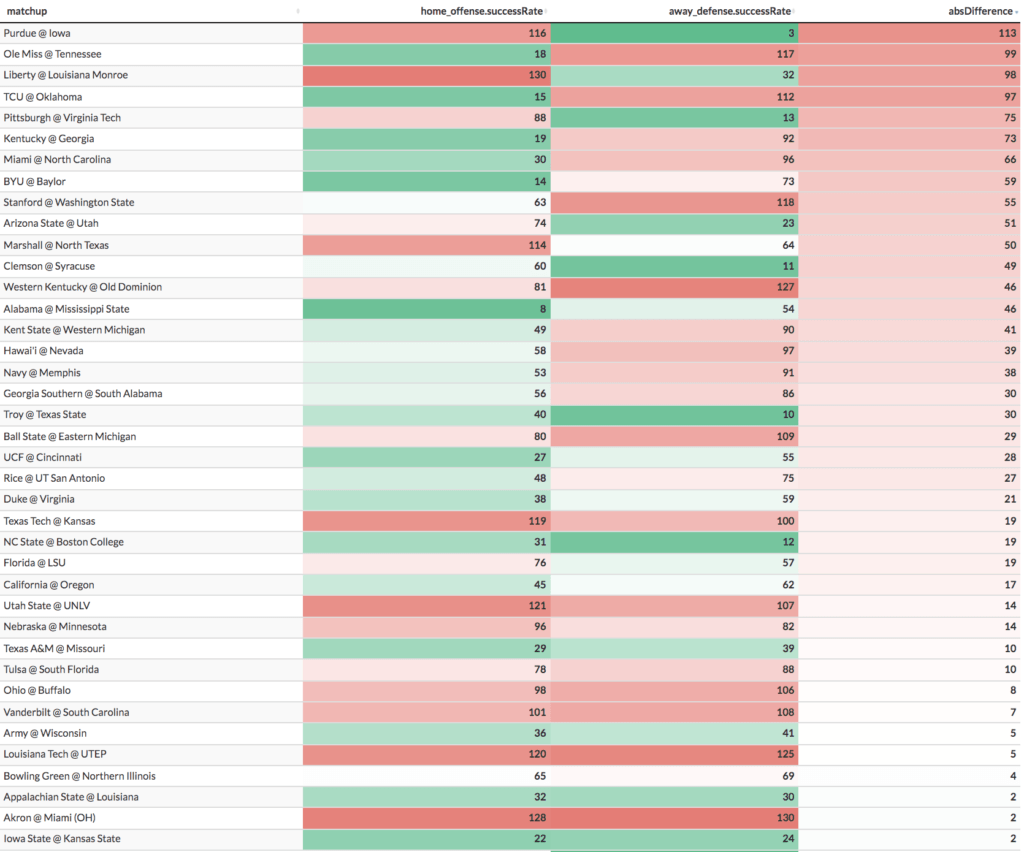
Biggest Mismatches
- Purdue's Defense ([!) vs Iowa's Offense
- Tennessee's Offense vs Ole Miss's Defense
- Liberty's Defense vs ULM's Offense
Now, each home team's Success Rate Allowed vs each away team's Success Rate:

Biggest Mismatches
- Texas Tech's Offense vs Kansas' Defense
- Liberty's Offense vs ULM's Defense
- South Alabama's Defense vs Georgia Southern's Offense
Finishing Drives
Finishing Drives is points per opportunity when the offense is past the 40 Yard Line. Defensively, this is how many points per opportunity a defense allows when the opposing offense crosses the 40 yard line.
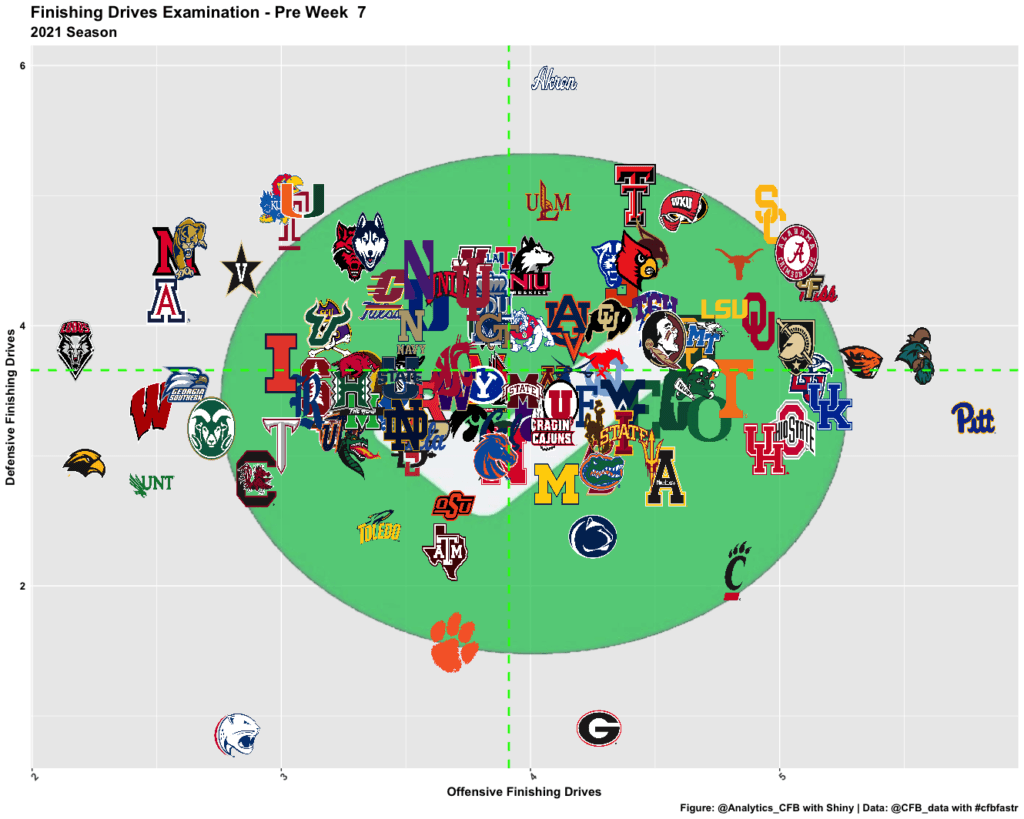
- Despite struggling this season Brent Venables has managed to keep Clemson elite at limiting opponents' points in scoring situations.
- Oregon State is looking like an elite offense through the last two charts.
- This is where Alabama has been struggling this season (which Texas A&M exposed). They cannot keep opponents out of the end zone after they cross the 40.
Let's take a look at each home team's Offensive Finishing Drives rank vs each away team Defensive Finishing Drive Rank:
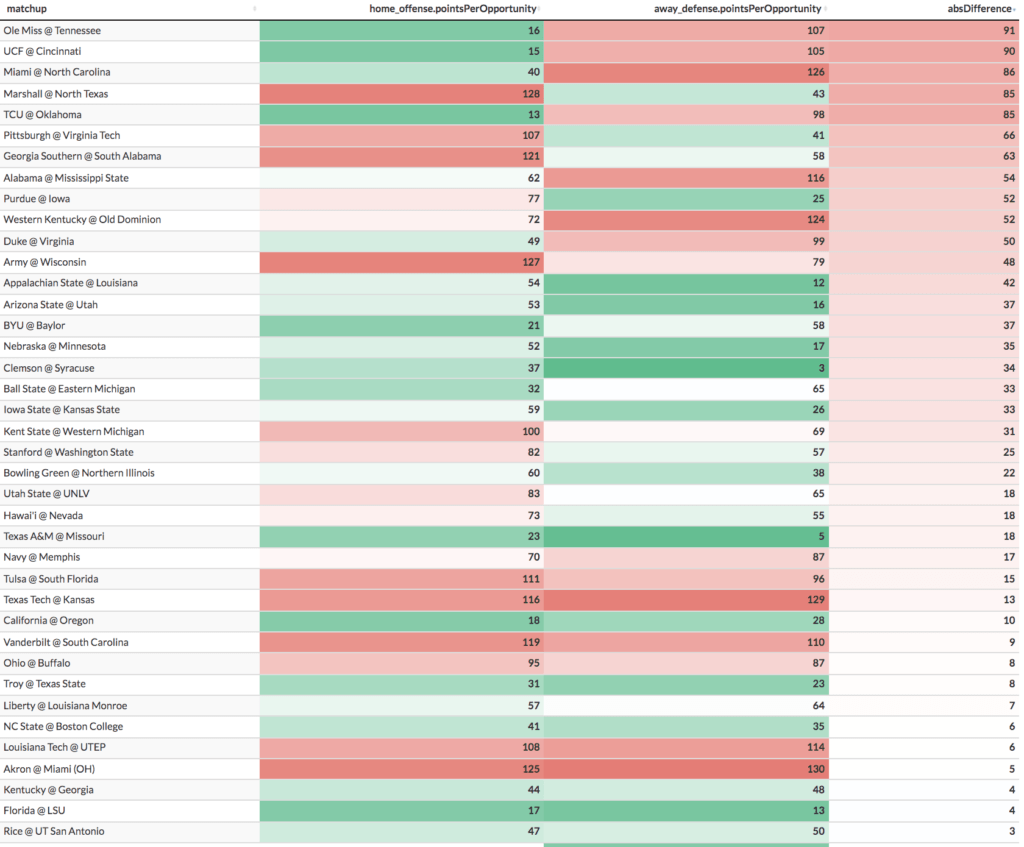
Biggest Mismatches
- Tennessee's Offense vs Ole Miss' Defense
- Cincinnati's Offense vs UCF's Defense
- North Carolina's Offense vs Miami's Defense
Now we can look at each home team's Defensive Finishing Drive Rank vs each away team's Offensive Finishing Drive Rank:
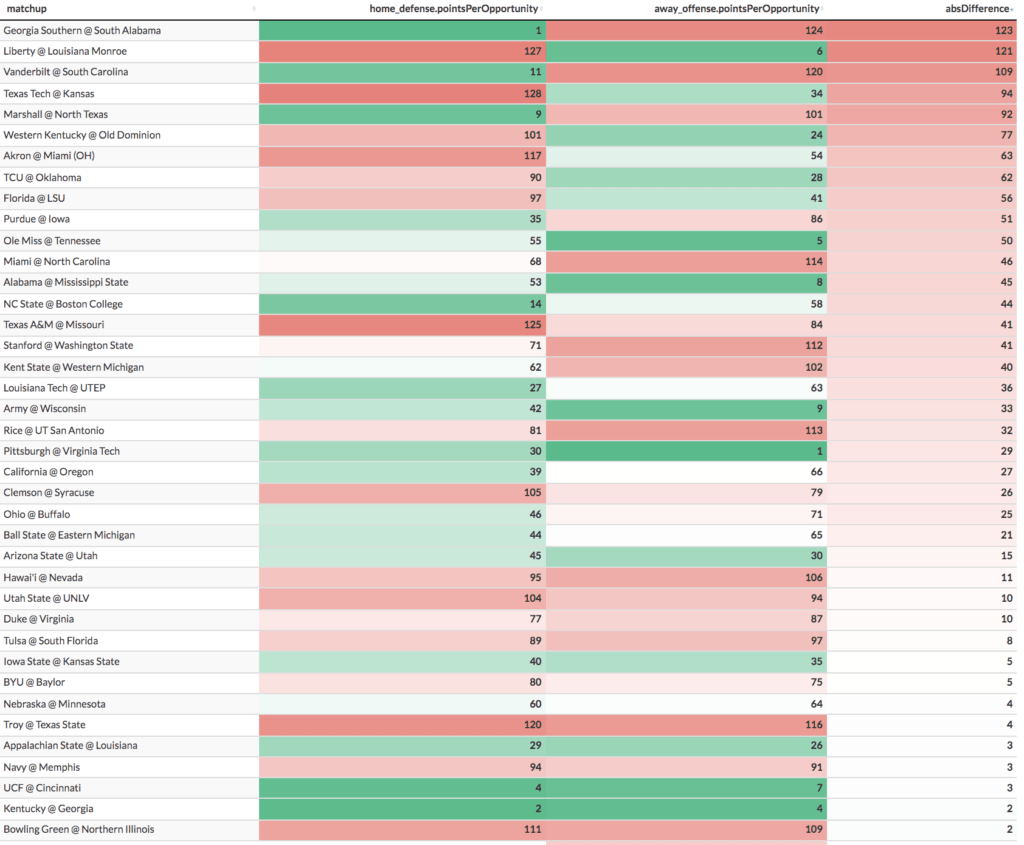
Biggest Mismatches
- South Alabama's Defense vs Georgia Southern's Offense
- Liberty's Offense vs ULM's Defense
- South Carolina's Defense vs Vanderbilt's Offense
Explosiveness
Per College Football Data (CFBD), Explosiveness measures the average EPA on plays which were marked as successful. We are using this definition since we are using their metrics.
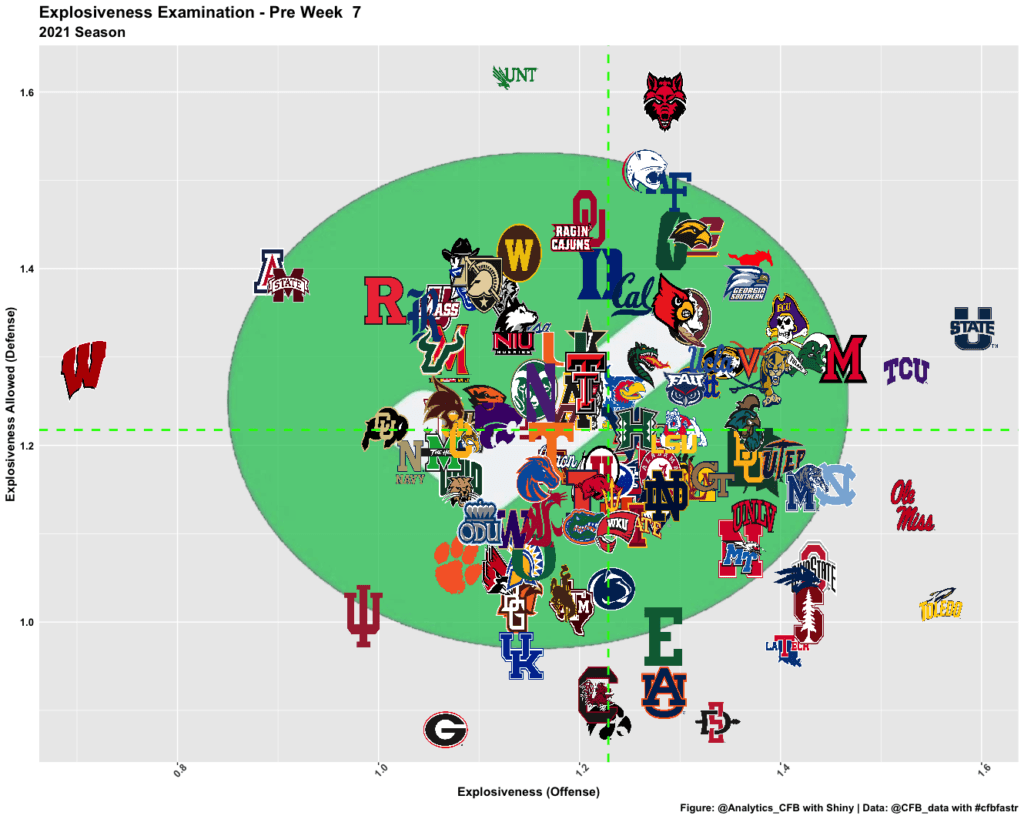
Remember earlier in the article when I said: "When we look at success rate, explosiveness, and finishing drives, keep an eye on these three [Michigan, Wisconsin and Ohio State] teams." Well this is why. Wisconsin is dead last in Offensive Explosiveness. In this chart, bottom right is good and top left is bad. Some Takeaways:
- Toledo is excelling in this area both offensively and defensively
- The tandem of Carson Strong and Romeo Dubs has lived up to the hype. These two possible first round picks have been lighting opposing defenses up so far this season.
- South Alabama may have one of the most interesting defenses in the country. They are elite in Success Rate and Finishing Drives but awful in this explosiveness metric. Keep in mind, explosiveness measures only successful plays so this could be a case of them not allowing many good plays to opposing offenses, but when they do let one up it tends to go a long ways.
Now let's look at each team's home explosiveness vs the away team's defensive explosiveness allowed.
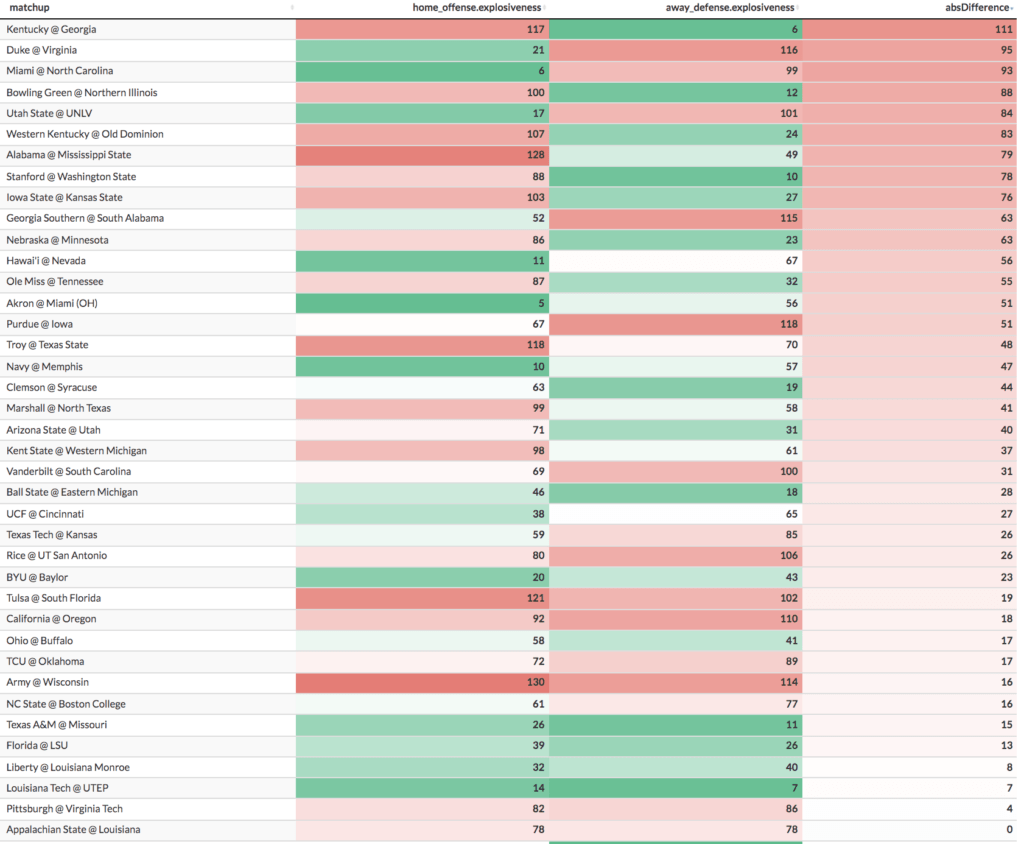
Biggest Mismatches
- Kentucky's Defense vs Georgia's Offense
- Virginia's Offense vs Duke's Defense
- North Carolina's Offense vs Miami's Defense
Let's flip it!
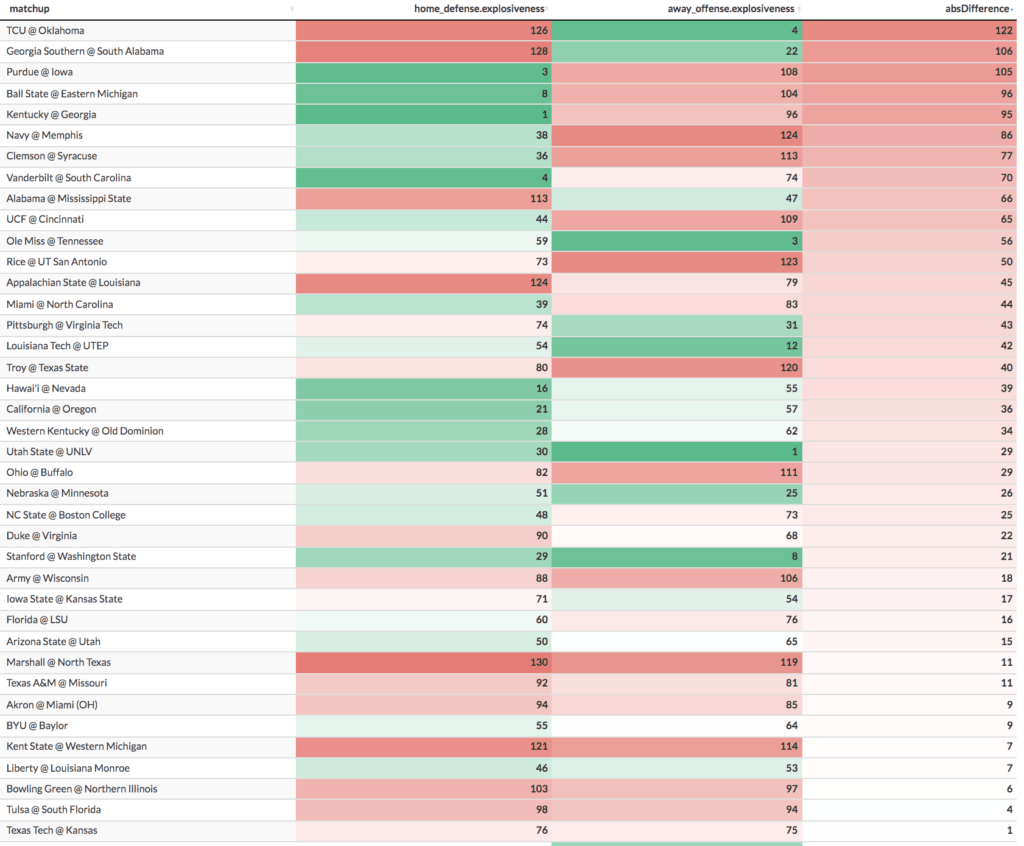
Biggest Mismatches
- TCU's Offense vs Oklahoma's Defense
- Georgia Southern's Offense vs South Alabama's Defense
- Iowa's Defense vs Purdue's Offense
Week 7 Betting Takeaways
So you've seen all these tables, now what? How does this apply to betting? Well, one game I am intrigued by is the Kentucky-Georgia game because it does not show up in these mismatches ever (except in Kentucky's favor!). Let's check out this matchup a little more in depth.
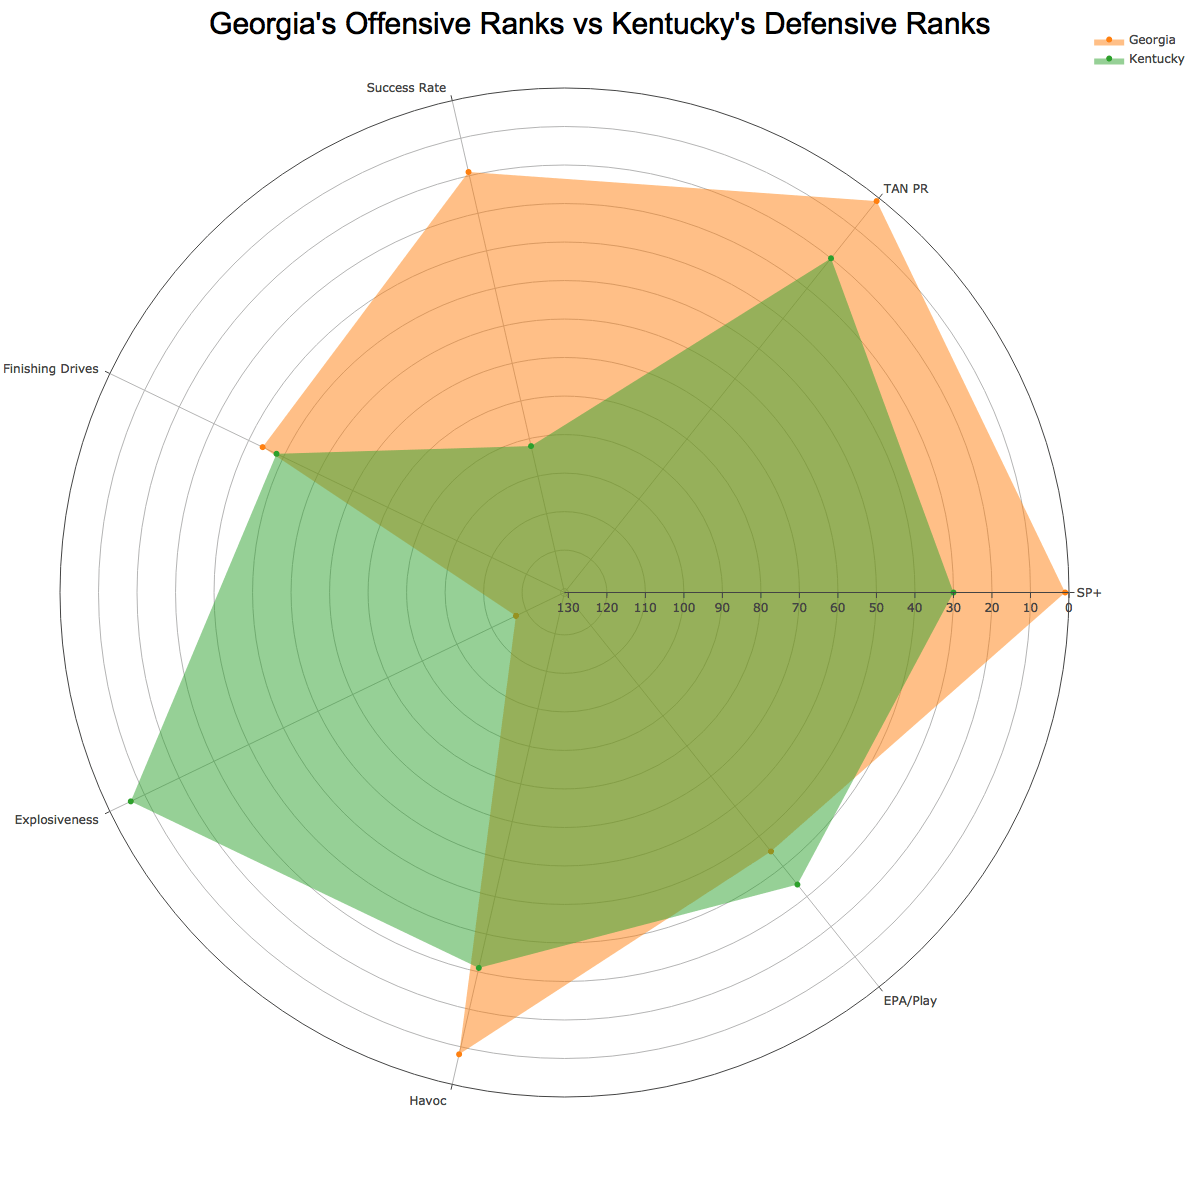
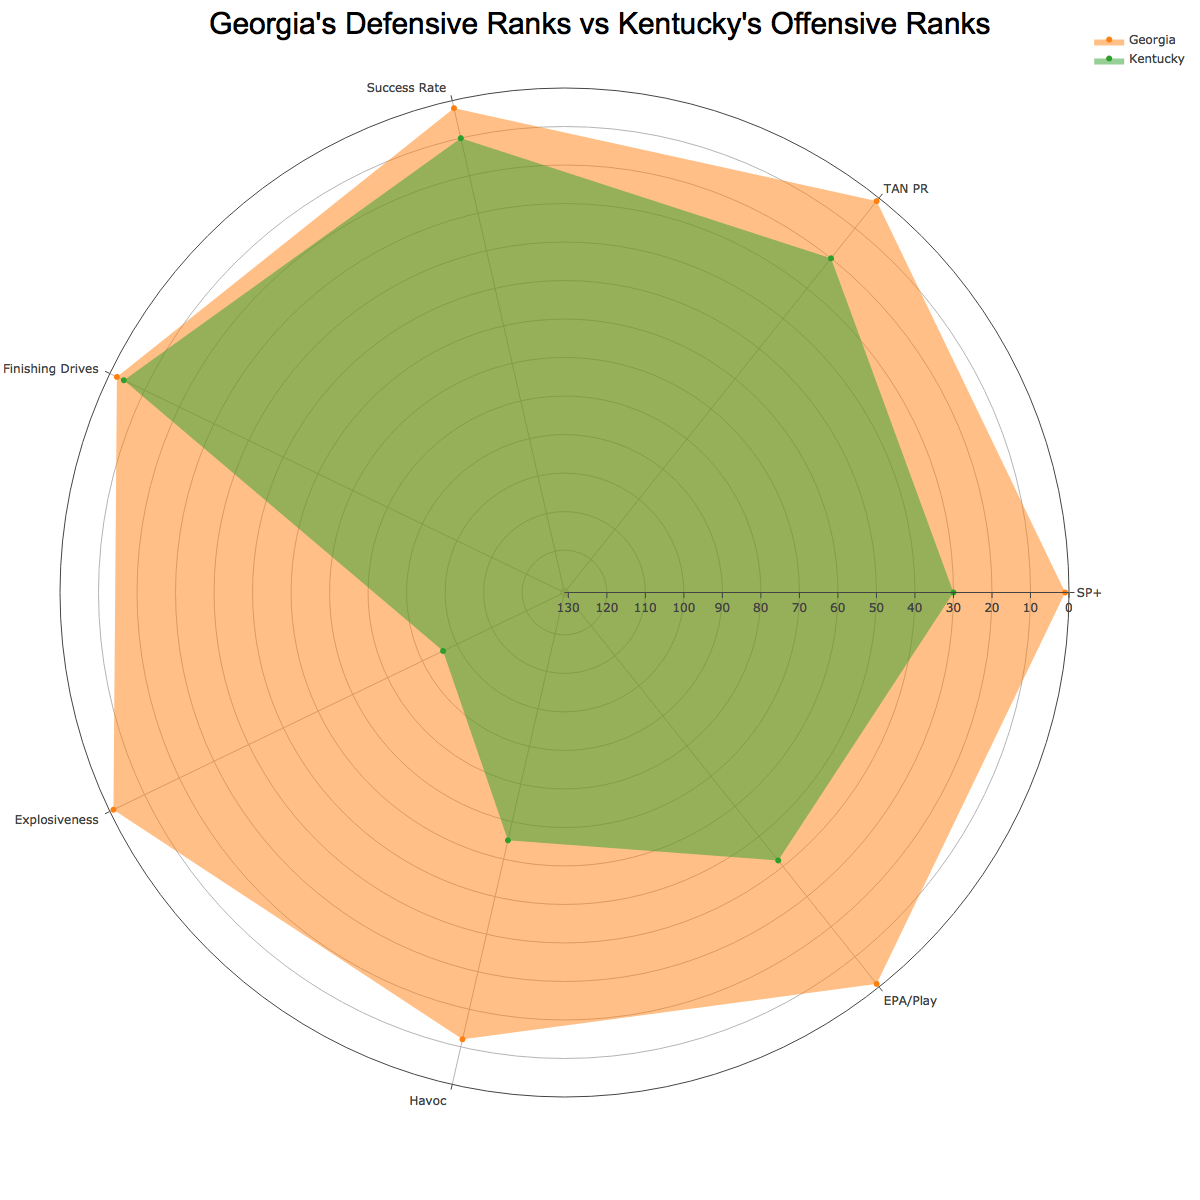

Kentucky is sitting at +23 after moving from +26.5. Based on these metrics, I would expect this to be a closer game, probably around 21 points. Our Pro Projection actually has this game at a 20.7 point spread.
I would hit this before it moves closer 21 as the weekend approaches. Last week's pick hit, even though it needed a Caleb Williams-induced miracle, so let's keep it going this weekend!


