


Let's flash back to 2015. I was fresh out of college, sitting in my one bedroom apartment, watching on as I lost my fifth-straight bet on a Tuesday night MLB slate. At the time, I thought my background knowledge of MLB alone would be enough to make money. I had been betting on MLB since 2010 and it took me five years to realize, there has to be better way to do this.
While trying to look up some baseball stats on the internet, I stumbled across Fangraphs for the first time and my eyes lit up brighter than when I got Ken Griffey Jr. baseball '98 for the Nintendo 64 as a Christmas gift. For the first few days, I thought I had it all figured out.
Fast forward a month, I am sitting alone in my apartment on a Saturday night watching King Felix get shelled as a road favorite against the Angels, on my way to a 1-7 night. The reality was, even though I had all of these stats at my disposal, they were useless unless I knew how to use them.
While doing some research online, I stumbled across the book Trading Bases by Joe Peta. After ordering the book and reading the first two chapters (I don't have the attention span to read an entire book), I became obsessed with trying to create an MLB model in excel to find an edge.
What are BaseRuns?
Before we go any further let me first say, I'm not all that fluent when it comes to advanced mathematics (I barely passed 100 level math in college). A lot of the advanced baseball statistic articles I was reading gave me a headache. So I needed to find something that made sense to me. After a month of researching advanced baseball stats online, I stumbled across the stat, "BaseRuns."
Here's the Fangraphs definition of BaseRuns:
"BaseRuns is a formula designed to estimate how many runs a team would be expected to score (or allow) given their underlying offensive (or defensive) performance. In other words, BaseRuns is a context-neutral run estimator used to evaluate teams."
In essence it's how many runs a team should score or allow. For those who have been reading my soccer articles, you've probably seen me write ad nauseam about expected goals.
BaseRuns is a very similar concept. Essentially, we are trying to remove variances due to luck. Teams and players can get lucky; there is no denying that. But removing luck from the equation can tell us exactly how good a certain player is in reality.
For next few months, I got way too deep into trying to create a model in excel centered around BaseRuns. I was on Fangraphs every day downloading gobs of data to put into my model. For years now, I have been making tweaks to it trying to make it better and more profitable. Hopefully it'll provide you with a more simplified way of betting on MLB.
How to calculate BaseRuns
Since I am not smart enough to explain them in detail, the link below will provide you with much better detail than anything I could.
Formula for hitters:
BaseRuns Terms:
A = H + BB + HBP – (0.5 * IBB) – HR
B = 1.1 * [1.4 * TB – 0.6 * H – 3 * HR + 0.1 * (BB + HBP – IBB) + 0.9 * (SB – CS – GDP)]
C = PA – BB – SF – SH – HBP – H + CS + GDP
D = HR
BaseRuns Formula:
Raw BaseRuns = [(A * B) / (B + C)] + D
BaseRuns League Adjustment:
BaseRuns League Adjustment = [Specific League Runs Scored or Allowed] / [Specific League Raw BaseRuns]
Formula for pitchers:
The great part about BaseRuns is there is a formula for pitchers as well:
A = H + W – HR
B = (1.4 * TBe – .6 * H – 3 * HR + .1 * W) * 1.1
C = 3 * IP
D = HR
Where TBe = 1.12 * H + 4 * HR
Essentially, the formula is trying to replicate how many runs a pitcher should give up in a given season, excluding the defense behind him.
Details on BaseRuns Formula
Tango Tiger is one of the first pages I came across when I was trying to better understand what all of this means. They provide great insight on the formula, to mathematically challenged people, like myself better understand BaseRuns.
Here's how Tango Tiger defines the formula above:
"The definitions of the four factors in the general BsR equation create a situation in which the elements (and their corresponding coefficients) to be included in the A, C, and D factors is generally straightforward. Thus the B factor is the only one with ambiguity, and is the area in which it is easiest to make alterations. One can "calibrate" Base Runs so that the output equals a desired value."
"In Smyth's equations presented above, the guiding principle has been that A represents "initial baserunners" (i.e. the number of runners known to have reached safely). One could alternatively use A to represent "final baserunners" (i.e. baserunners after removing runners known to have been retired on base, by being caught stealing or wiped out on a double play) as Runs Created does. Similarly, the C factor, could be defined as "batting outs" (AB – H + SH + SF), all outs (which would include CS and GIDP), or other combinations."
You can add linear weights to the "B" part of the equation to adjust for the specifics of the league. I won't try to pretend like I understand what they mean. Buckeyes and Sabermetrics do a great job of explaining them and how to implement them into the BaseRuns formula.
Applying it to the Model
For my model, I use ZIPS projections from Fangraphs and implement the formulas above to determine an individual batter's BasedRuns for the season. Then I break it down to an individual game by taking the total BaseRuns/Games played.
For pitchers, I break it down to per inning BaseRuns by taking the individual pitcher's BaseRuns/innings pitched.
Throughout the season, I start factoring in player's actual stats and prorate them with their projected stats based on the number of games played.
Applying BaseRuns to Individual Players
Now, it's time to put all of that math into perspective. For hitters, think of data below as a measure of how many runs each player contributes to his team per game. For pitchers, think of it as how many runs they should give up per inning.
Using the ZIPS projections from Fangraphs combined with the BaseRuns formula, here are the top 25 ranked players in my model heading into the season:
Hitters
| Player | Team | BaseRuns/Game |
|---|---|---|
| Mike Trout | Angels | 0.96 |
| Christian Yelich | Brewers | 0.87 |
| Juan Soto | Nationals | 0.87 |
| Mookie Betts | Dodgers | 0.83 |
| Alex Bregman | Astros | 0.83 |
| Ronald Acuna Jr. | Braves | 0.81 |
| Cody Bellinger | Dodgers | 0.80 |
| Freddie Freeman | Bravers | 0.79 |
| Yordan Alvarez | Astros | 0.77 |
| Bryce Harper | Phillies | 0.77 |
| Aaron Judge | Yankees | 0.76 |
| Francisco Lindor | Indians | 0.76 |
| Nolan Arenado | Rockies | 0.76 |
| J.D. Martinez | Red Sox | 0.75 |
| Giancarlo Stanton | Yankees | 0.74 |
| Charlie Blackmon | Rockies | 0.74 |
| Kris Bryant | Cubs | 0.73 |
| Anthony Rizzo | Cubs | 0.73 |
| Jose Ramirez | Indians | 0.73 |
| George Springer | Astros | 0.73 |
| Jose Altuve | Astros | 0.72 |
| Pete Alonso | Mets | 0.72 |
| Nelson Cruz | Twins | 0.71 |
| Trea Turner | Nationals | 0.71 |
| Fernando Tatis Jr. | Padres | 0.71 |
Starting Pitchers
| Player | Team | BaseRuns/Inning |
|---|---|---|
| Chris Sale | Red Sox | 0.37 |
| Max Scherzer | Nationals | 0.39 |
| Stephen Strasburg | Nationals | 0.39 |
| Gerrit Cole | Yankees | 0.39 |
| Jacob deGrom | Mets | 0.39 |
| Jack Flaherty | Cardinals | 0.40 |
| Justin Verlander | Astros | 0.41 |
| Walker Buehler | Dodgers | 0.41 |
| Charlie Morton | Rays | 0.41 |
| Blake Snell | Rays | 0.41 |
| Lucas Giolito | White Sox | 0.41 |
| Clayton Kershaw | Dodgers | 0.42 |
| Yu Darvish | Cubs | 0.42 |
| Noah Syndergaard | Mets | 0.43 |
| Luis Severino | Yankees | 0.43 |
| Mike Soroka | Braves | 0.43 |
| Luis Castillo | Reds | 0.44 |
| Sonny Gray | Reds | 0.44 |
| Aaron Nola | Phillies | 0.45 |
| Mike Clevinger | Indians | 0.45 |
| Marcus Stroman | Mets | 0.45 |
| Shane Bieber | Indians | 0.46 |
| Tyler Glasnow | Rays | 0.46 |
| Chris Paddack | Padres | 0.46 |
| Kyle Hendricks | Cubs | 0.46 |
Relievers
| Player | Team | BaseRuns/Inning |
|---|---|---|
| Josh Hader | Brewers | 0.31 |
| Felipe Vazquez | Pirates | 0.32 |
| Austin Adams | Mariners | 0.35 |
| Edwin Diaz | Mets | 0.36 |
| Aroldis Chapman | Yankees | 0.36 |
| Seth Lugo | Mets | 0.37 |
| Taylor Rogers | Twins | 0.37 |
| Liam Hendriks | Athletics | 0.38 |
| Alex Claudio | Brewers | 0.38 |
| Trevor Gott | Giants | 0.39 |
| Roberto Osuna | Astros | 0.39 |
| Drew Pomeranz | Padres | 0.39 |
| Jake Diekman | Athletics | 0.39 |
| Giovanny Gallegos | Cardinals | 0.39 |
| Joe Kelly | Dodgers | 0.39 |
| Kirby Yates | Padres | 0.39 |
| Nick Anderson | Rays | 0.40 |
| Darren O'Day | Braves | 0.40 |
| Brad Hand | Indians | 0.40 |
| Adam Kolarek | Dodgers | 0.40 |
| Brusdar Graterol | Dodgers | 0.40 |
| Jose Alvardo | Rays | 0.40 |
| Ryan Pressly | Astros | 0.40 |
| Kenley Jansen | Dodgers | 0.40 |
| Taylor Guilbeau | Mariners | 0.40 |
How BaseRuns Apply to Betting
Now that I have the BaseRuns for each individual hitter, starting pitcher and reliever, I can calculate the runs for and against for each team.
I prefer to wait until lineups are posted before placing a bet, but since lineups usually aren't posted until about five hours before the game, I rely on FantasyLabs' projected lineups for determining BaseRuns for each team.
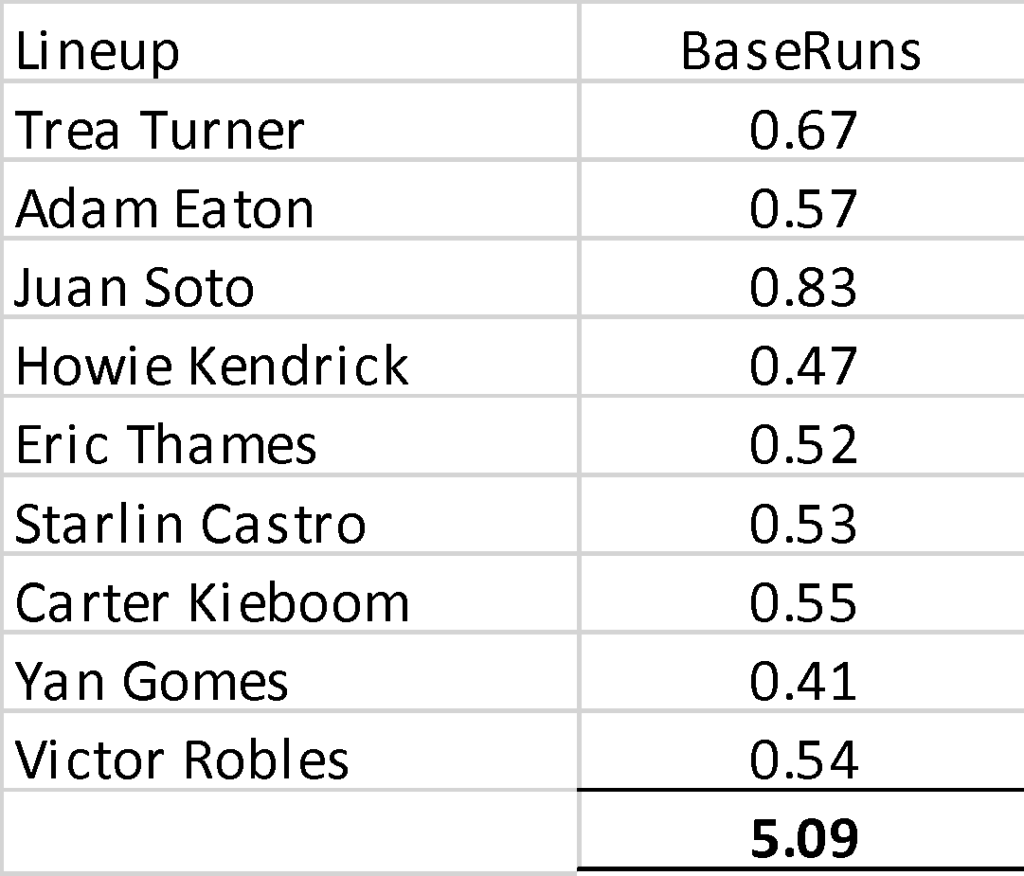
Batting Lineup
In my articles, I will be posting the FantasyLabs projected lineups along with the projected BaseRuns for each individual player. Here is what it will look like:
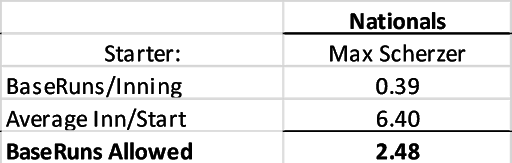
Starting Pitching
Then calculate the number of runs allowed by the projected starter by taking the BaseRuns per inning times the projected average innings per start (Total Innings/Total Number of Starts).
Here is an example for Max Scherzer:
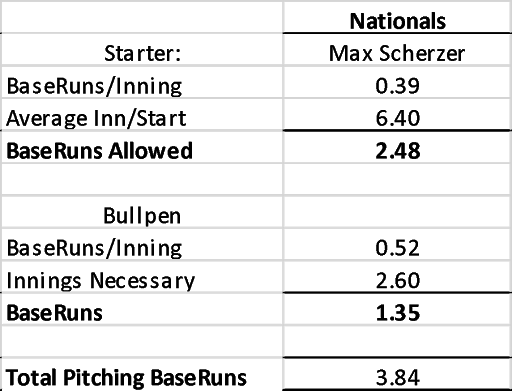
Bullpen
Projecting a team's bullpen is always tricky. As bettors we don't know how a manager is going to use his bullpen on any given day. What I do is go through each team's projected bullpen (on Fangraphs) and try to calculate the average BaseRuns for each bullpen as a total.
I sum up the total BaseRuns for each bullpen divided by the projected number of innings pitched. This isn't an exact science, but it's a way to put a value on each bullpen.
Here is an example of the Nationals Bullpen:

Projecting Runs Allowed
So, now that I have the average bullpen BaseRuns per Inning, I take nine innings minus the projected starting pitchers innings. In the example above, it would be nine innings minus Max Scherzer's 6.40 innings to get 2.60 innings for which the bullpen would be responsible.
From there, I take the bullpen's BaseRuns per inning times the innings necessary to determine the amount of runs allowed by the bullpen.
I then add the starting pitcher and bullpen BaseRuns to get the total runs allowed.
Projecting Win Probability
First, I have to figure out how many runs a team's offense will score against the opposing pitching staff.
Nationals Runs Scored: ((Nationals Projected BaseRuns Scored x Opponents Projected BaseRuns allowed) / MLB average BaseRuns per game).
I then do the same formula for the opponent and I now have the projected final score.
Note: I add in a park factor and weather adjustment to the final projected runs.
Once I have the projected BaseRuns for each team, I do a simple Pythagorean expectation formula (I use 1.83 as my exponent) to calculate the win probability for each team and the over/under.
I haven't really taken the time to figure out what the true home-field advantage is for each park. I'm sure someone smarter than me has figured it out.
Since there will be no fans in the stadium this season, I'm using 2% as the home-field advantage — essentially, subtracting 1% from the away team and adding 1% to the home team.
Calculating Expected Value
After I figure out the win probability for each team, I then compare my projected line to the actual line to find the expected value for both the moneyline and over/under.
Here is what the finished product looks like:
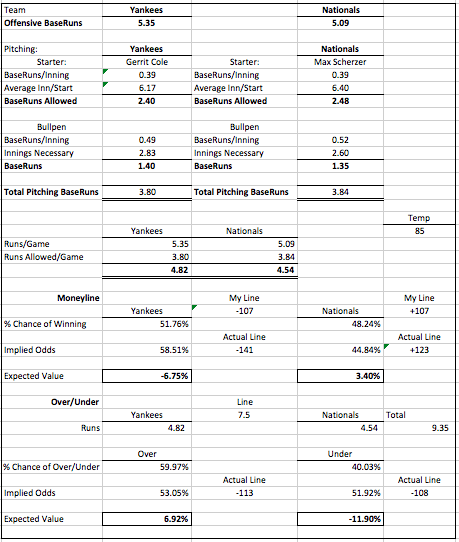
As you can see I have some value on the Nationals and the over Thursday night.
Final Thoughts
This model I've created is by no means a perfect system. I've tried to apply formulas and theories from people who are a lot smarter to make betting on baseball simpler.
We live in an era where MLB is a data-driven sport. There are so many advanced stats out there and it can be difficult to understand what all of them mean. The main thing I hope you take away from this article is that BaseRuns can simplify things.
I will be writing articles and providing picks all throughout the MLB season. You can follow all of my picks at The Action Network or on my twitter @BJCunningham22.
Here are some of the resources that helped me understand BaseRuns:


