


There are a lot of different ways to compare the Eastern and Western conferences in the NBA.
We can talk about titles, records, ATS results, futures, win totals, offseason transactions and a lot more.
Let's go category by category to go through a few metrics for each and see what this means for the upcoming 2025-26 NBA season.

NBA Conference Win Totals
Let's start with the most glaring difference from what I've seen so far and that is preseason win totals.
The Western Conference has had a higher average win total among its 15 teams entering the regular season in 17 of the last 18 seasons, with the lone exception coming in 2022-23. It is important to note, though, that it seems like each team had a bit of an inflated win total altogether that year, with both conferences totaling over 85 wins on average in 2022 — the last three seasons, the average has been 82.8 wins combined.
In 2025-26, the West has an average of 42.4 wins for its 15 teams, while the East sits at 39.8 — for a difference of +2.6 wins. Last year, that difference was +4.1 for the Western Conference.
Maybe the most remarkable number, aside from the West's 17 of 18 figure above, is their dominance at the top. Going back to 2000-01, the West owns 18 of the top 19 average win totals among both conferences, with the East's 2022-23 season again being the outlier.

On The Court Results: SU and ATS
Next, let's look at on-court results, both from a straight-up and against-the-spread perspective.
Straight Up
The West has finished the regular season above .500 straight up on the moneyline vs. the Eastern Conference in 14 of the last 16 seasons, losing the battle against its foes in both 2021 and 2022.
Over the last two seasons, the West has posted a 56.4% straight-up mark against the East according to Bet Labs, beating them by over 2 PPG. The West has been favored in 59% of their games vs. the East over this span, winning those games at a 72.1% rate and beating the East by a whopping 7.6 PPG. Last two years, 12 of the 15 Western Conference teams are at least .500 SU or better against the East, with just the Jazz, Pelicans and Spurs under .500 SU.
Against The Spread
When looking at results against the number, the West has continued its reign over the East, but just not as drastic.
The West has finished above .500 ATS against the East in 4 of the last 5 seasons and 6 of the last 9 seasons dating back to 2016.
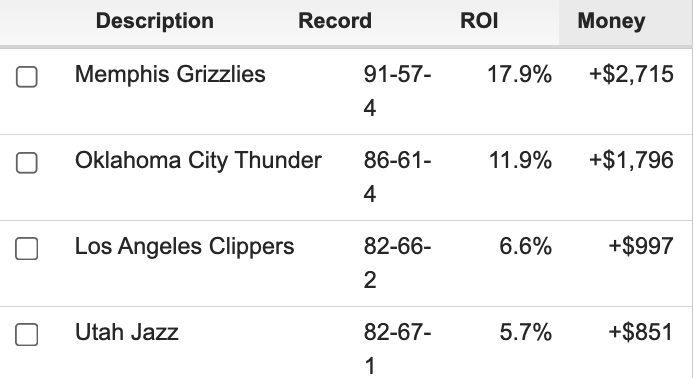
From an ATS perspective, the West's dominance over the East over the last 5 years has come primarily from four teams: Grizzlies, Thunder, Clippers and Jazz — but it's Memphis and OKC leading the way, for a combined 177-118-8 ATS (60%) vs. the East with a $100 bettor up over $4,500 for almost a 15% ROI for bettors.

NBA Finals Results
Now that we've discussed the regular season, let's do the playoffs — or in this case, the NBA Finals.
Since Michael Jordan won his last title with the Bulls in 1997-98, the West has won 18 of the 27 championships in that span, exactly two-thirds, with the East winning 9 of the 27 titles.
The West's championships have come from the Lakers (6), Spurs (5), Warriors (4), Mavericks (1), Nuggets (1) and Thunder (1), while the East's have come from the Heat (3), Celtics (2), Pistons (1), Cavaliers (1), Raptors (1) and Bucks (1).
Both conferences with exactly six teams each, but the West with a lot more hardware.
Looking specifically since 2004-05, the full scope of betting data for the NBA in Bet Labs, which is a total of 21 seasons, the West has an edge, but it's tighter than the titles itself. The West is 68-53 SU (56.2%) and 61-58-2 ATS (51.3%) in the NBA Finals vs. the East in that span.
In Game 1 of the NBA Finals, the West has dominated the East recently, going 15-6 SU and 14-7 ATS against the East since 2004-05, including the Spurs, who are 4-0 SU/ATS in NBA Finals Game 1s vs. the East in that span.

NBA Title Favorites
When it comes to title favorites, the East and West usually go on runs. Here are the title favorites by year, by conference, since 1989, just as an example.
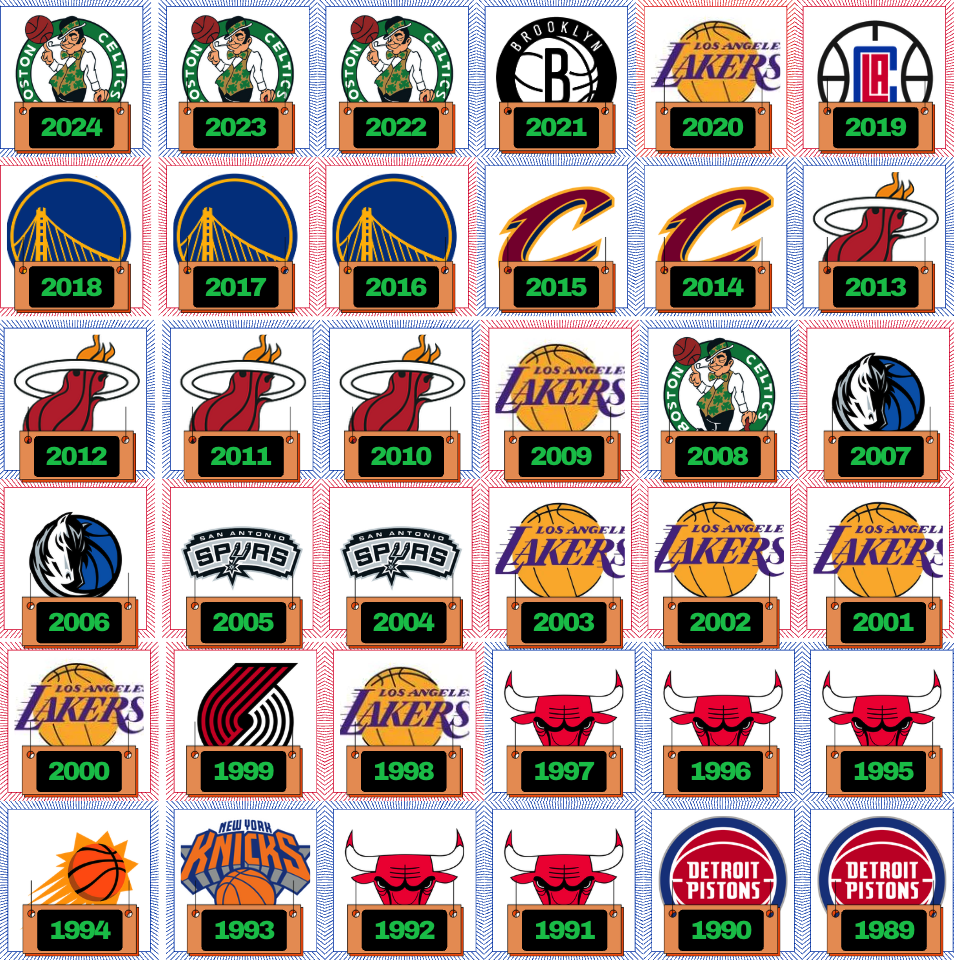
Except for a few outliers, the dominance usually comes from a player or dynasty that carries the weight of the run till it is over…
10 years: West (1998-07)
9 years: East (1989-97)
6 years: East (2010-15)
5 years: West (2016-20)
4 years: East (2021-24)

Highest and Lowest Win Totals
Another aspect I thought would be interesting to dive into is expectations. Primarily over/unders in terms of the highest and lowest win totals and then looking at making or missing the playoffs as a season goal.
Let's start with win totals.
- Since 2000, we've had 28 win totals close below 22 entering the regular season, 21 of those 28 teams (75%) have come from the Eastern Conference.
- Since 2000, we've had 61 win totals closed at 55 or higher; 42 of those 61 win totals (69%) have come from the Western Conference.
That alone explains the discrepancy between conferences in win totals described at the top.
Now let's talk expectations. Since 2000, we've had 133 teams enter the year with a top-5 highest win total in the NBA. 84 of those teams have come from the West, while just 49 have come from the East.
- Of the 84 Western Conference "good" teams, they are 32-52 to the over on their win total (38.1%), going under their win total by 1.4 wins per team. Those 84 teams averaged 53.3 wins per season for an average win total of 54.6.
In terms of playoffs, 80 of 84 made it; they averaged 1.3 series wins per team, with 11 champions and 30 teams who failed to win a playoff series.
- Of the 49 Eastern Conference "good" teams, they are 18-31 to the over on their win total (36.7%), going under their win total by 2.5 wins per team. Those 49 teams averaged 51.7 wins per season for an average win total of 54.2.
In terms of playoffs, 48 of 49 made it ('07 Bulls), they averaged 1.7 series wins per team, with 7 champions and 13 teams who failed to win a playoff series.
What does this all mean? Similar to the NFL, high win totals are a difficult journey to go over — everything has to go right.
Since 2000, the 133 teams with a top-5 win total are 50-83 to their win total over (37.6%). Of those 133 teams, 16 went over their win total by 5 wins or more, while 42 went under by five-plus wins.
Even if you look since 2020, these top-5 win totals are 10-16 to the over, with an almost identical average win differential margin since 2000 (-1.76 wins per team).

Failure To Launch
Lastly, I took a look at team performance. Specifically, those top-5 highest yearly win totals.
It makes sense that the teams with the highest expectations, who end up failing the most, would come out of the West, given how many more teams are in the pool from the conference.
Looking at franchises that have had a top-5 yearly win total at least four times since 2000 — there are 15 teams — 10 from the West and 5 from the East.
Six of those 15 teams averaged fewer than one playoff series win per season, with the top-five highest win totals:
Bulls (0.25 series wins/season), Suns (0.5), Rockets (0.56), Clippers (0.75), Nuggets (0.75) and Mavericks (0.86) — five from the West and one from the East.

Superstar Expectations
On the higher side, it's worth looking at how some superstars have dealt with the expectations.
A LeBron James-led team has had a win total in the top-5 entering a season 11 times, his teams are 2-9 to the over on their win total in those seasons, but he is averaging 2.6 series wins per season, basically getting a game or two away from the Finals on average each season.
Let's look at a few more…
Nikola Jokic: 3 seasons, 2-1 to over, 3 series wins (1 per)
Stephen Curry: 5 seasons, 2-3 to over, 15 series wins (3 per)
Giannis A.: 5 seasons, 1-4 to over, 6 series wins (1.2 per)
Tim Duncan: 15 seasons, 11-4 to over, 29 series wins (1.9 per)
Kobe Bryant: 12 seasons, 4-8 to over, 29 series wins (2.4 per)
Shaquille O'Neal: 15 seasons, 6-9 to over, 34 series wins (2.3 per)
Kevin Durant: 11 seasons, 4-6 to over, 20 series wins (1.8 per)
Chris Paul: 10 seasons, 2-8 to over, 8 series wins (0.8 per)
(Note: no win totals in 1998-99 for the strike)


