


NBA salaries are some of the highest in professional sports, with even average players earning millions each year. But how do those figures compare to the paychecks of everyday Americans?
A new analysis from The Action Network reveals just how many years and lifetimes it would take for the average worker in each U.S. state and major city to match both the league’s average on-field salary and its highest on-field earnings. By combining household income data with life expectancy figures, the results highlight the stark gap between NBA players’ on-court pay and the average American’s income.
Based on 2025–26 NBA on-field earnings, the average player salary used in this study was $11,633,289.77, while the highest on-field salary was $59,606,817, earned by Stephen Curry.
In comparison, our nationwide analysis shows that the average U.S. household, earning about $65,000 per year, would need 178.85 years to match an NBA player’s average on-field salary. To reach the league’s top contracts, it would take 916.39 years—the equivalent of more than 12 lifetimes.
That is the picture nationwide, but the story becomes even more striking when you break it down by region and city.
States Where It Takes the Longest to Match NBA Salaries
When it comes to states where residents face the longest road to NBA-level wealth, the results are dominated by the South. Low household incomes paired with shorter life expectancies mean that residents in these states would need centuries and more than a dozen lifetimes to match what the league’s top stars take home.
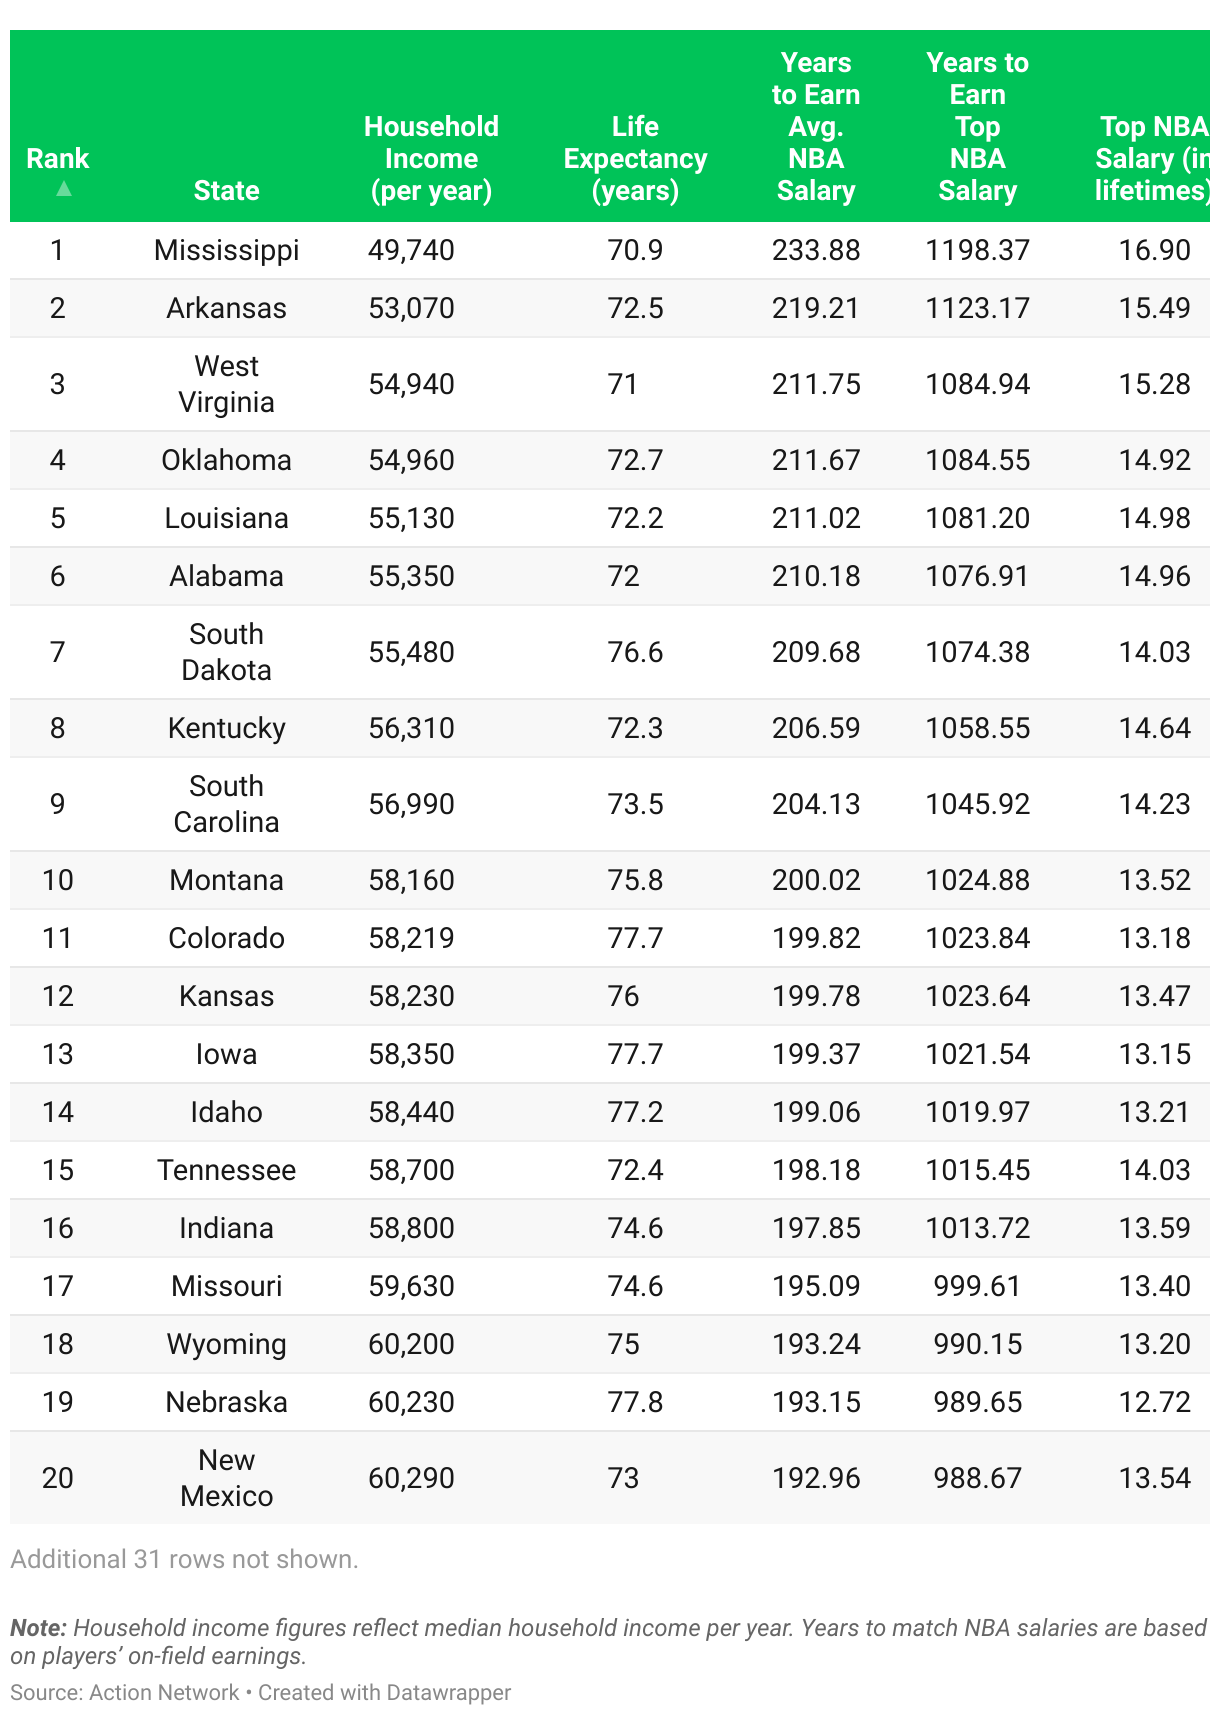
Here are the 10 states with the largest gap:
1. Mississippi – The hardest place to catch up with NBA money
- Median household income: $49,740
- Years to match average NBA salary (on-field earnings): 233.88
- Years to match top NBA salary: 1,198.37
- Equivalent of: ~17 lifetimes
Mississippi ranks as the hardest state in America to catch up with NBA salaries. With the lowest household incomes in the nation, it highlights the sharpest divide between professional athletes and everyday workers, making the state the clearest example of how far behind ordinary paychecks fall.
2. Arkansas – Still more than 15 lifetimes away from the top
- Median household income: $53,070
- Years to match average NBA salary (on-field earnings): 219.21
- Years to match top NBA salary: 1,123.17
- Equivalent of: ~15 lifetimes
Arkansas is second only to Mississippi in the struggle to reach NBA-level wealth. With modest wages and limited economic growth, residents face one of the steepest climbs in the country, showing how Southern households remain among the furthest from pro athlete earnings.
3. West Virginia – Long road to NBA-level wealth
- Median household income: $54,940
- Years to match average NBA salary (on-field earnings): 211.75
- Years to match top NBA salary: 1,084.94
- Equivalent of: ~15 lifetimes
West Virginia stands out as the hardest state in the East to close the NBA gap. Generations of economic challenges in Appalachia have left households here among the most disadvantaged, needing centuries to reach even average player salaries.
4. Oklahoma – Among the most distant from NBA wealth
- Median household income: $54,960
- Years to match average NBA salary (on-field earnings): 211.67
- Years to match top NBA salary: 1,084.55
- Equivalent of: ~15 lifetimes
Oklahoma underscores how geography offers no protection from income gaps. Despite its central position in the country, residents earn so little that it would take more than 1,000 years to match the league’s top salaries.
5. Louisiana – A daunting climb for residents
- Median household income: $55,130
- Years to match average NBA salary (on-field earnings): 211.02
- Years to match top NBA salary: 1,081.20
- Equivalent of: ~15 lifetimes
Louisiana highlights how health and income combine to widen the divide. With both low wages and shorter life expectancy, the state shows how structural disadvantages make NBA-level earnings even more unattainable.
6. Alabama – Nearly 15 lifetimes behind
- Median household income: $55,350
- Years to match average NBA salary (on-field earnings): 210.18
- Years to match top NBA salary: 1,076.91
- Equivalent of: ~15 lifetimes
Alabama ranks among the states with the starkest pay gap. Even with slightly higher wages than in Mississippi, households here remain almost 15 lifetimes behind the league’s top earners, reflecting the South’s deep wage divide.
7. South Dakota – Longer lives, but still too far behind
- Median household income: $55,480
- Years to match average NBA salary (on-field earnings): 209.68
- Years to match top NBA salary: 1,074.38
- Equivalent of: ~14 lifetimes
South Dakota offers a striking paradox. Despite one of the longest life expectancies in the top ten, incomes remain so low that residents are still left more than two centuries away from an average NBA salary.
8. Kentucky – A gap stretching over 1,000 years
- Median household income: $56,310
- Years to match average NBA salary (on-field earnings): 206.59
- Years to match top NBA salary: 1,058.55
- Equivalent of: ~15 lifetimes
Kentucky is another Appalachian state where the wealth divide is most severe. With wages stuck just over $56,000, residents face a gap of more than a millennium to match the league’s top contracts, underlining the region’s ongoing economic struggles.
9. South Carolina – Over 200 years from the average
- Median household income: $56,990
- Years to match average NBA salary (on-field earnings): 204.13
- Years to match top NBA salary: 1,045.92
- Equivalent of: ~14 lifetimes
South Carolina proves that stronger wages don’t guarantee real progress. Even with higher household incomes than some Southern neighbors, residents are still more than 200 years away from NBA averages, exposing the limits of wage growth in the region.
10. Montana – Rounding out the top ten
- Median household income: $58,160
- Years to match average NBA salary (on-field earnings): 200.02
- Years to match top NBA salary: 1,024.88
- Equivalent of: ~14 lifetimes
Montana rounds out the list, proving the challenge isn’t confined to the South. Even with higher household incomes than many states, residents still need nearly two centuries to reach NBA wealth, showing how vast the pay gap remains nationwide.
At the Other End of the Income Spectrum
The District of Columbia stands out with the nation’s highest household income of $109,420. Yet even here, workers would still need 106 years to match an average NBA salary and 544.75 years for a top-tier player’s contract. That equals seven lifetimes of earnings, showing that even America’s most affluent workers remain a world away from NBA wealth.
Cities Where It Takes the Longest to Match NBA Salaries
The story deepens at the city level, where incomes vary dramatically. To provide a wide and balanced representation, the analysis considered U.S. cities with populations of 50,000 or more. Some of the hardest places to catch up with NBA money are older industrial hubs and smaller metro areas with lower wage averages.
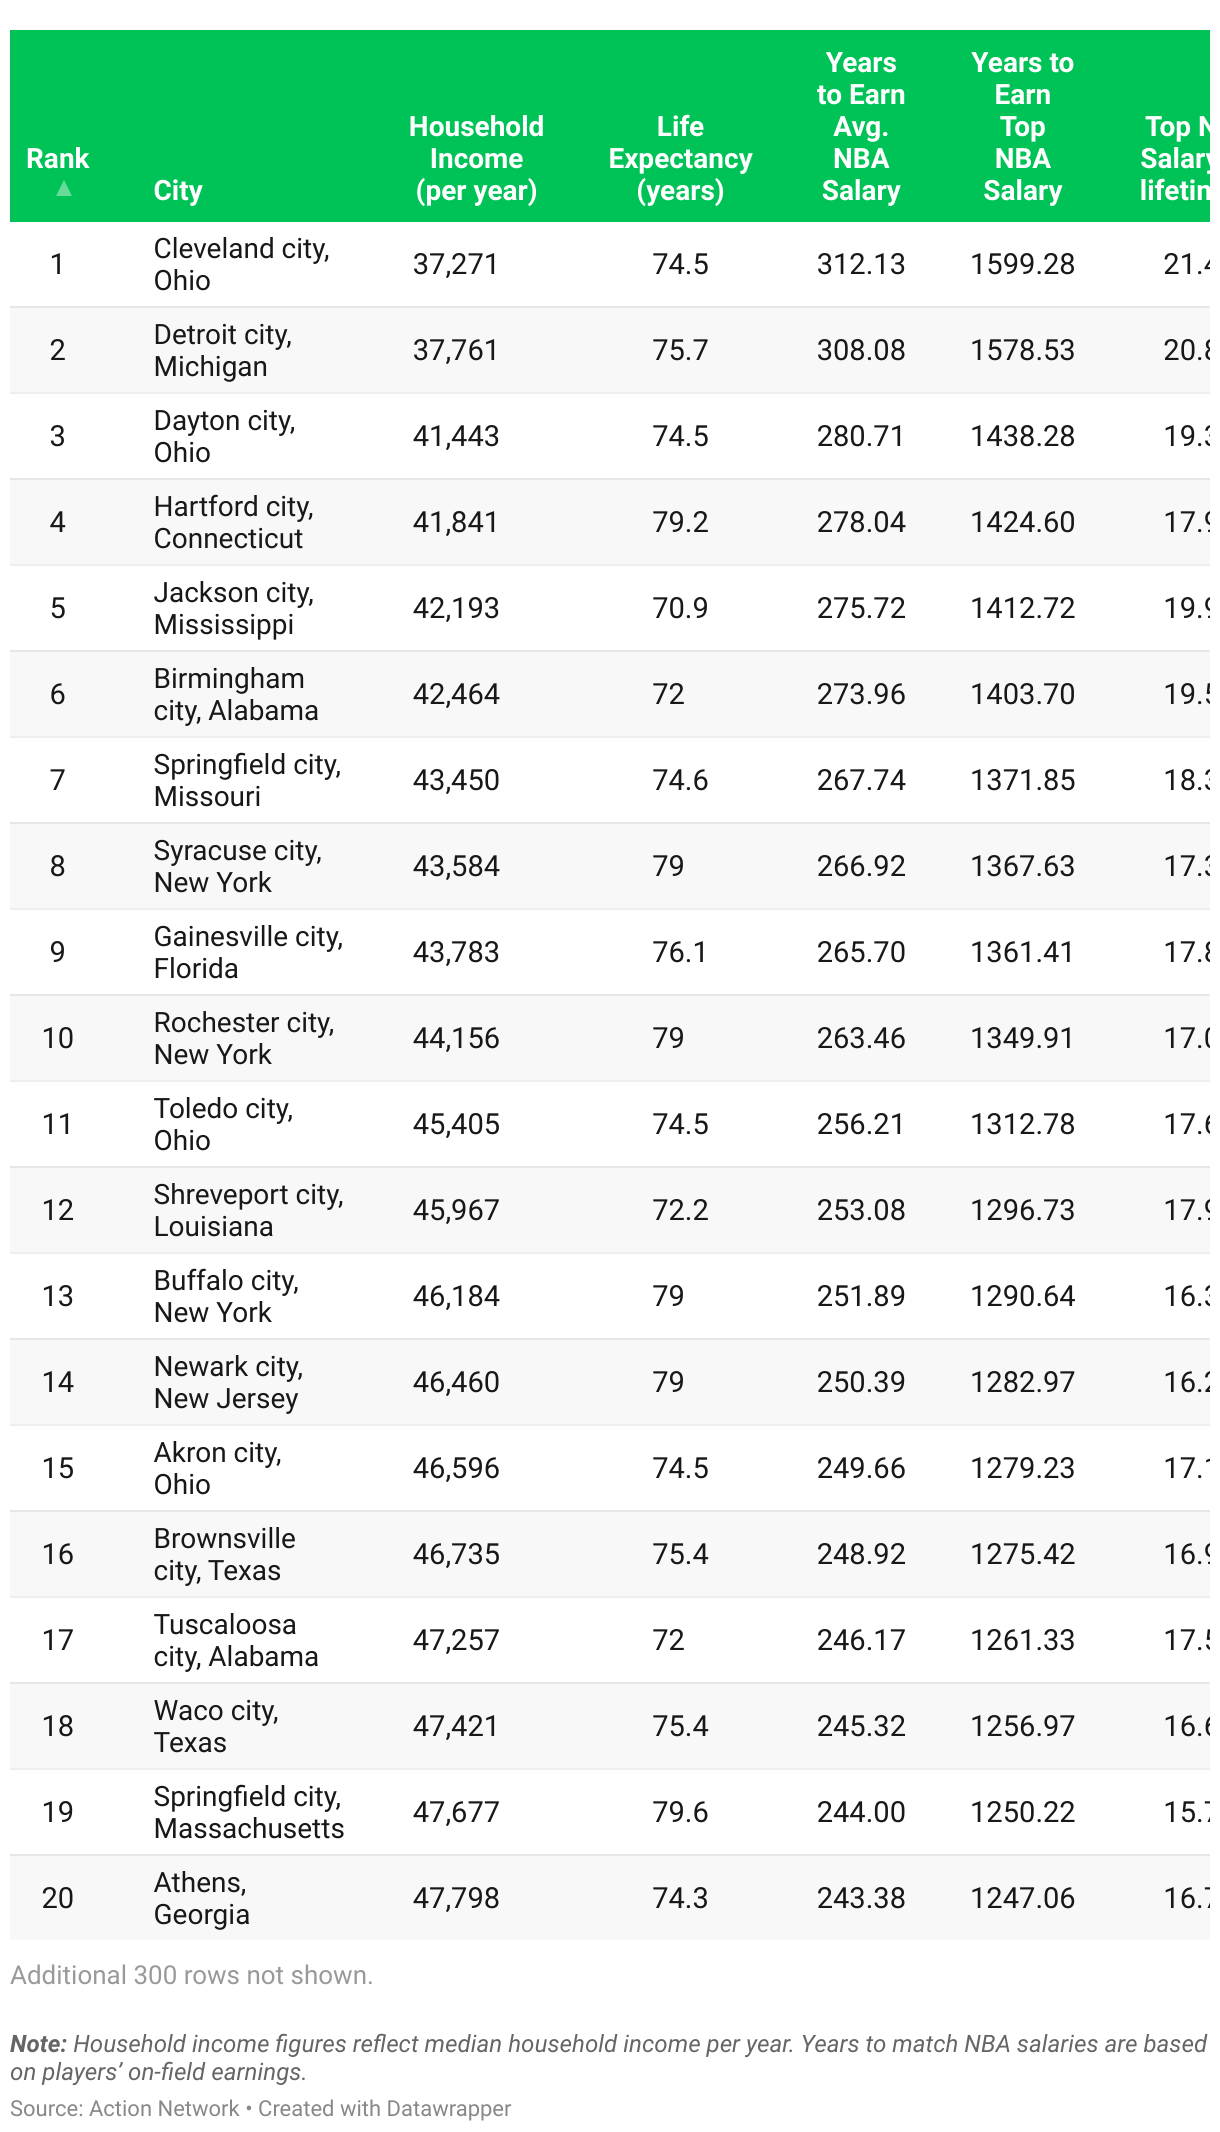
Here are the 10 cities with the largest gap:
1. Cleveland, Ohio – The toughest city to close the gap
- Median household income: $37,271
- Years to match average NBA salary (on-field earnings): 312.13
- Years to match top NBA salary: 1,599.28
- Equivalent of: ~21 lifetimes
The Forest City tops the list as the hardest place in America to catch up with NBA wealth. With some of the lowest household incomes nationwide, Cleveland highlights just how far everyday workers lag behind professional athletes.
2. Detroit, Michigan – Close behind Cleveland
- Median household income: $37,761
- Years to match average NBA salary (on-field earnings): 308.08
- Years to match top NBA salary: 1,578.53
- Equivalent of: ~21 lifetimes
The Motor City remains a symbol of America’s industrial decline, and that economic reality shows up in this ranking. Detroit residents face one of the steepest climbs in the country to match NBA-level salaries.
3. Dayton, Ohio – More than 19 lifetimes away
- Median household income: $41,443
- Years to match average NBA salary (on-field earnings): 280.71
- Years to match top NBA salary: 1,438.28
- Equivalent of: ~19 lifetimes
Dayton reflects the broader struggles of Rust Belt cities. Even with slightly higher wages than in Cleveland or Detroit, households here are still among the furthest in the nation from NBA-level wealth.
4. Hartford, Connecticut – Higher incomes, but still far behind
- Median household income: $41,841
- Years to match average NBA salary (on-field earnings): 278.04
- Years to match top NBA salary: 1,424.60
- Equivalent of: ~18 lifetimes
Often called The Insurance Capital of the World, Hartford shows that higher wages and longer life expectancy still aren’t enough. Residents face one of the longest climbs in the Northeast to reach NBA earnings.
5. Jackson, Mississippi – Nearly 20 lifetimes away
- Median household income: $42,193
- Years to match average NBA salary (on-field earnings): 275.72
- Years to match top NBA salary: 1,412.72
- Equivalent of: ~20 lifetimes
The City with Soul may be rich in culture, but its incomes tell another story. Jackson ranks among the hardest Southern cities to close the gap with NBA salaries, underscoring the South’s deep wealth divide.
6. Birmingham, Alabama – Among the hardest Southern cities
- Median household income: $42,464
- Years to match average NBA salary (on-field earnings): 273.96
- Years to match top NBA salary: 1,403.70
- Equivalent of: ~20 lifetimes
The Magic City underscores the South’s income divide. Despite its size and historic role as an industrial hub, Birmingham remains one of the toughest places in the region to even approach NBA-level wealth.
7. Springfield, Missouri – Over 18 lifetimes to match the top
- Median household income: $43,450
- Years to match average NBA salary (on-field earnings): 267.74
- Years to match top NBA salary: 1,371.85
- Equivalent of: ~18 lifetimes
Known as the Queen City of the Ozarks, Springfield reflects the struggles of smaller Midwestern cities. Despite its regional importance, residents here remain centuries away from NBA-level paychecks.
8. Syracuse, New York – A Northeastern city still far behind
- Median household income: $43,584
- Years to match average NBA salary (on-field earnings): 266.92
- Years to match top NBA salary: 1,367.63
- Equivalent of: ~17 lifetimes
Salt City, once built on salt mining, proves that even Northeastern hubs can’t escape the gap. Despite higher life expectancy, Syracuse households remain hundreds of years away from NBA salaries.
9. Gainesville, Florida – Nearly 18 lifetimes from the top
- Median household income: $43,783
- Years to match average NBA salary (on-field earnings): 265.70
- Years to match top NBA salary: 1,361.41
- Equivalent of: ~18 lifetimes
Home to the University of Florida and known as Gator Country, Gainesville highlights how even vibrant college towns fall far short of professional sports earnings.
10. Rochester, New York – Rounding out the top ten
- Median household income: $44,156
- Years to match average NBA salary (on-field earnings): 263.46
- Years to match top NBA salary: 1,349.91
- Equivalent of: ~17 lifetimes
The Flower City rounds out the top ten. Once a hub for photography and optics, Rochester today shows how even mid-sized Northeastern cities with stronger wages still fall centuries behind NBA wealth.
On the High-Income Side of U.S. Cities
In Sunnyvale, California — at the heart of Silicon Valley — household incomes average $174,506. Yet even here, residents would still need 66.66 years, or more than four lifetimes, to match NBA earnings. The finding shows that professional basketball salaries outpace even the nation’s most affluent tech hubs.
Missouri Spotlight: How Local Incomes Stack Up Against NBA Salaries
With Missouri sportsbooks preparing to launch, we also conducted a closer examination of how residents across the state compare when it comes to NBA-level salaries. To ensure wider representation, the analysis included Missouri cities with populations of 50,000 or more.
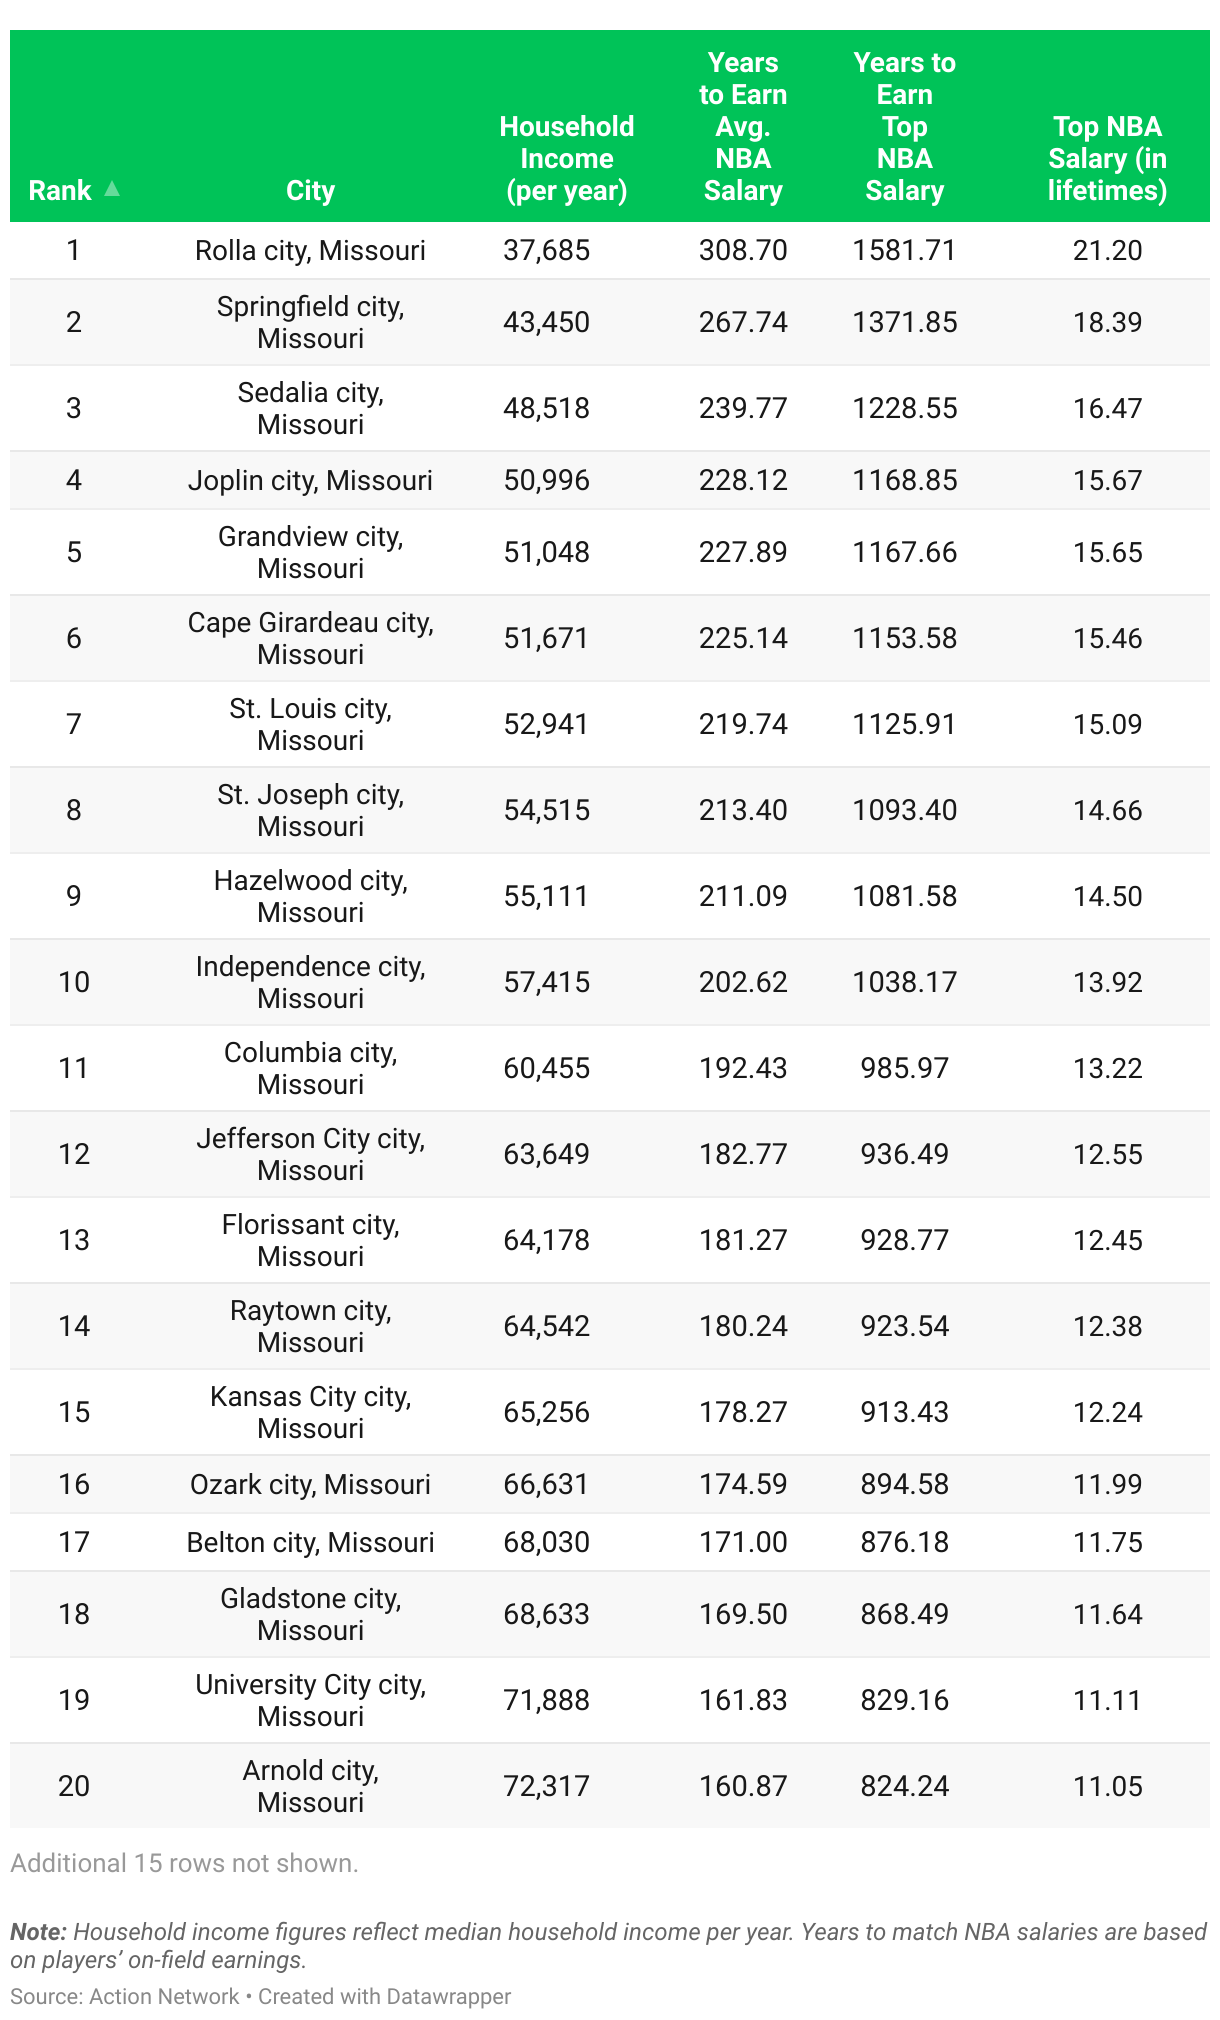
Here are the Missouri cities with the largest gap:
1. Rolla, Missouri – More than 21 lifetimes behind
- Median household income: $37,685
- Years to match average NBA salary (on-field earnings): 308.70
- Years to match top NBA salary: 1,581.71
- Equivalent of: ~21 lifetimes
Rolla ranks as one of the hardest places in Missouri to catch up with NBA wealth. With some of the lowest incomes in the state, residents would need more than three centuries to reach even the league’s average salary.
2. Springfield, Missouri – Featured nationally among the hardest cities
- Median household income: $43,450
- Years to match average NBA salary (on-field earnings): 267.74
- Years to match top NBA salary: 1,371.85
- Equivalent of: ~18 lifetimes
Springfield isn’t just a Missouri story. It also ranks among the toughest cities nationwide to close the gap with NBA salaries, underlining the economic challenges faced in the Ozarks.
3. Sedalia, Missouri – Still nearly 240 years away
- Median household income: $48,518
- Years to match average NBA salary (on-field earnings): 239.77
- Years to match top NBA salary: 1,228.55
- Equivalent of: ~16 lifetimes
Sedalia’s residents would need almost 240 years to catch up to NBA averages, showing how even mid-sized cities with modest incomes remain far behind the wealth of professional athletes.
4. Joplin, Missouri – More than 15 lifetimes behind
- Median household income: $50,996
- Years to match average NBA salary (on-field earnings): 228.12
- Years to match top NBA salary: 1,168.85
- Equivalent of: ~16 lifetimes
Joplin highlights the wage gap in Missouri’s southwest. Despite stronger wages than Rolla or Springfield, residents still face over a thousand years to reach the top NBA contracts.
5. Grandview, Missouri – A suburban city still far behind
- Median household income: $51,048
- Years to match average NBA salary (on-field earnings): 227.89
- Years to match top NBA salary: 1,167.66
- Equivalent of: ~16 lifetimes
Even as a Kansas City suburb, Grandview shows that proximity to a major metro doesn’t erase the divide. Residents still face more than 1,100 years to reach NBA-level earnings.
6. Cape Girardeau, Missouri – Nearly 15 and a half lifetimes away
- Median household income: $51,671
- Years to match average NBA salary (on-field earnings): 225.14
- Years to match top NBA salary: 1,153.58
- Equivalent of: ~15 lifetimes
Cape Girardeau, a regional hub along the Mississippi River, underscores how smaller cities across the state continue to trail NBA wealth by centuries.
7. St. Louis, Missouri – Over 15 lifetimes from the top
- Median household income: $52,941
- Years to match average NBA salary (on-field earnings): 219.74
- Years to match top NBA salary: 1,125.91
- Equivalent of: ~15 lifetimes
The Gateway City may anchor Missouri’s economy, but residents still face more than 219 years to earn the NBA average salary, showing that even major metros aren’t immune to the gap.
8. St. Joseph, Missouri – More than 14 lifetimes away
- Median household income: $54,515
- Years to match average NBA salary (on-field earnings): 213.40
- Years to match top NBA salary: 1,093.40
- Equivalent of: ~15 lifetimes
Once a frontier town, St. Joseph today ranks among the Missouri cities where NBA wealth remains furthest out of reach.
9. Hazelwood, Missouri – Over 14 lifetimes from NBA paychecks
- Median household income: $55,111
- Years to match average NBA salary (on-field earnings): 211.09
- Years to match top NBA salary: 1,081.58
- Equivalent of: ~14 lifetimes
Hazelwood, part of St. Louis County, reflects the suburban struggle as incomes lag far behind the astronomical earnings of professional basketball.
10. Independence, Missouri – Nearly 14 lifetimes behind
- Median household income: $57,415
- Years to match average NBA salary (on-field earnings): 202.62
- Years to match top NBA salary: 1,038.17
- Equivalent of: ~14 lifetimes
Independence, Harry Truman’s hometown, shows how even historically significant cities fall centuries behind NBA salaries.
On the Other End of the Spectrum in Missouri
Missouri’s wealthiest suburbs highlight how the gap narrows but never disappears. In Chesterfield, with household incomes averaging $137,052, residents would still need nearly 85 years, or close to six lifetimes, to earn an NBA salary. Wildwood, the state’s top-earning city at $147,508, fares only slightly better, yet households would still require almost 80 years and more than 400 years for the league’s top contracts. Even in Missouri’s most affluent areas, professional basketball earnings remain far out of reach.
For readers who want to go beyond simply watching the NBA, our sportsbook reviews showcase top betting offers — including the DraftKings Promo Code and theCaesars Sportsbook Promo Code.
Methodology
This study looks at how long it would take the average American to earn the salary of an NBA player, both at the league average and at the top end of the pay scale. We compared median household income (per year) and life expectancy (years) against NBA salaries to show how many years, or even lifetimes, it would take to match a player’s earnings.
- NBA Salaries: We used the latest 2025–26 NBA on-field earnings data from HoopsHype. The average on-field salary used in this study was $11,633,289.77, while the highest on-field earnings were $59,606,817, earned by Stephen Curry.
- Household Income: Median household income data came from the U.S. Census Bureau’s American Community Survey (ACS). We used state-level data for the state rankings and city-level data for cities with populations over 100,000, including incorporated cities, towns, and consolidated governments as defined by the Census Bureau. We used the median rather than the average because it better reflects a typical household without being skewed by extreme outliers.
- Life Expectancy: State life expectancy figures came from the CDC, with national benchmarks supplemented by the World Health Organization (WHO).
Calculations:
- Years to Earn Average NBA Salary = NBA average salary ÷ annual median household income
- Years to Earn Top NBA Salary = Top NBA salary ÷ annual median household income
- Top NBA Salary in Lifetimes = Years to Earn Top NBA Salary ÷ life expectancy (in years)


