


One of the great things about handicapping is that you are constantly learning and updating your techniques and process.
A lot of folks believe that analytics tell the whole story. Others believe that the "eye test" is the way to go. As with most things in life, the answer is likely somewhere in between and to strive for the right balance.
While I do tend to lean heavily on predictive metrics, I also believe that there is an edge to be gained by watching games closely. You can get a better idea of team's true form by watching the games attentively and building an opinion on the sorts of defensive breakdowns or offensive chances they are creating, as opposed to relying entirely upon analytics for guidance.
Play-driving statistics are an effective indicator in predicting a given team's long-term results in hockey. Since the margins in the NHL are so tight, close plays and lucky bounces go a long way in deciding short-term results and any team is capable of spells of success that are not sustainable. So using predictive metrics (like expected goals) to separate the repeatable from the unsustainable can be helpful to a bettor trying to find value.
That said, there are certain types of scoring chances or defensive breakdowns that will not be accurately depicted in this data and teams consistently creating or allowing these kind of chances may be over-or-underrated due to a blind spot in some xG models.
Expected goals (also known as xG) is a predictive statistic that gives an indication of whether results are based on sustainable factors like a steady creation of scoring chances, or whether it is down to aspects such as shooting luck or outstanding goaltending.
Simply put, an expected goals rate (xGF%) above 50% is considered good because it means a team is creating the majority of the scoring chances. Anything below 50% is usually a sign that a team is struggling to control play. xG numbers and advanced stats on Action Network are often cited from Evolving Hockey, MoneyPuck and Natural Stat Trick.
For the most part, public expected goals models chart shot location and offer a rating based on the likelihood of each shot on net becoming a goal based on its location and shot-type. Using a sample size of every goal scored over the past several seasons, modelers aim to assign a value to each shot.
For example, a shot taken from the slot has a better chance of going in the net compared to a shot from the blueline. Expected goals data also evaluates a number of factors occurring prior to a chance including what the most recent event was (takeaway, hit, block), where and when the event occurred prior to a shot, whether a shot comes as a rebound chance or not, and whether at even strength or on the man advantage. All these factors help to piece together the exact danger of a shot based on all of the goals in a model's database.
As robust and impressive as many of the public xG models are, they still are unable to take in all the data when a shot is taken. For example, a goaltender's pre-shot movement greatly impacts their chances of making a save. Most xG models also don't account for the exact passing sequence that occurred before a shot was taken. That means that two scoring chances, which are clearly not equal in danger can be charted similarly in the model.
Passes which force a goalie to move side-to-side quickly create exponentially more dangerous scoring opportunities, specifically plays in which the puck is moved through the "royal road," or middle of the ice below the face-off circles. A pass that travels through that area creates a ton of East-West movement for a goaltender. 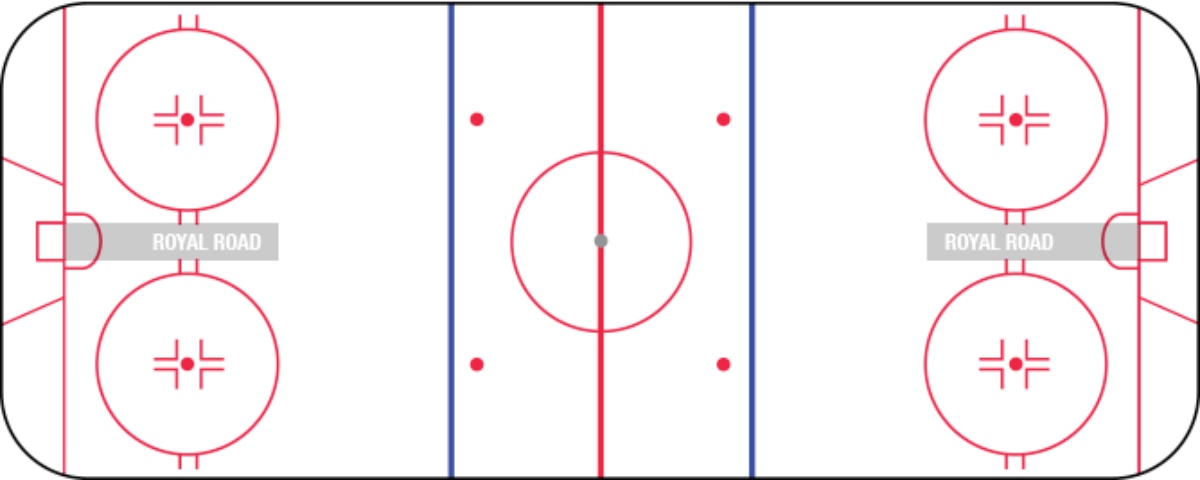
It is worth nothing that this "blind spot" is equally blind in the data for every team, so it does average out to some extent. That said, some teams certainly have more of a team-wide mindset of being willing to pass up moderately dangerous shots in order to make an extra pass in the offensive zone with the hopes of creating an almost sure goal when the pass is successful.
Additionally, some teams also boast more playmaking talent than others and that allows them to find and create these sorts of plays. That is another factor that is hard to quantify.
An important part to this point is that when these extra passes get broken up and are not successful they will not count for anything with regards to expected goals. However when these passing sequences are successful they will create a lot of near-certain goals which will then go under credited in the shot charting data, which can cause an appearance of a team being due for offensive regression which may never occur.
I see this every season with my beloved Capitals, a team that has the mindset to be more selective with their shots, electing to attempt more "extra" passes in a lot of instances, rather than taking shots that don't have much of a chance of going in. The Caps have run up a +130.74 total in Goals For Above Expected rating over the last five seasons, finishing 1st, 6th, 1st, 4th, and 1st in each of the last five seasons, respectively.
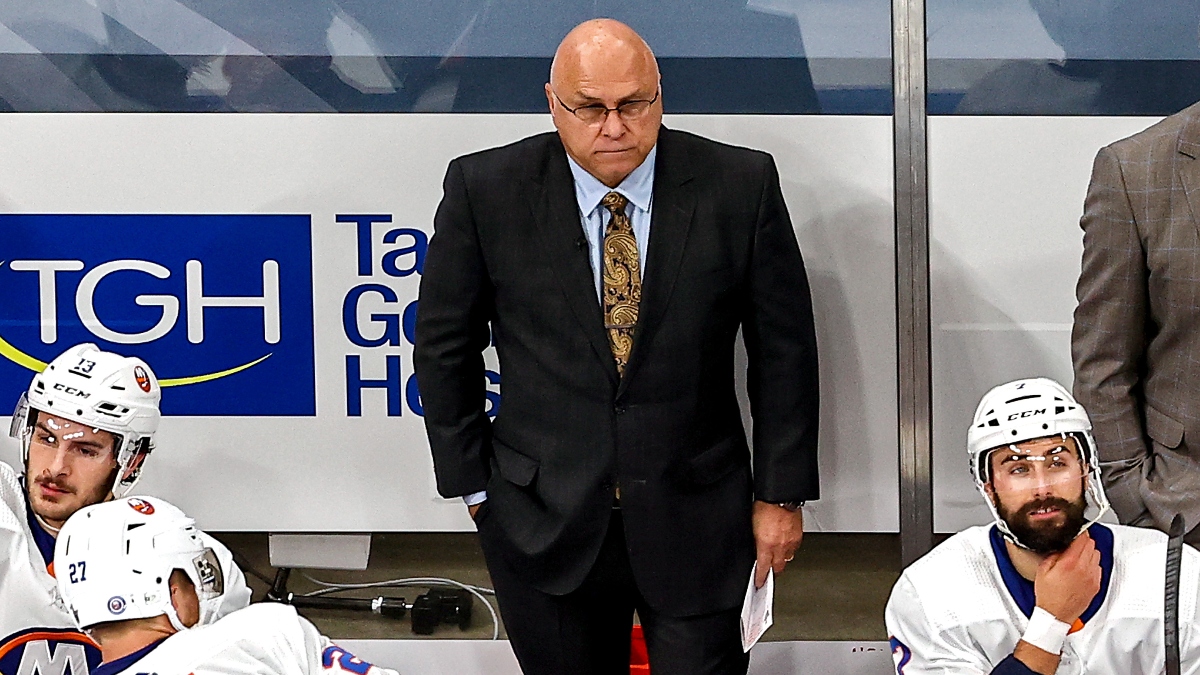
This logic also applies on the other end of the ice. For example, Barry Trotz has clearly demonstrated a terrific knowledge of how to suppress high-quality scoring chances. Over a four-year span from 2015-2019, Trotz's Capitals and Islanders teams posted a -105.32 Goals Against Above Expected.
Trotz's teams are structured defensively to bend but not break, offering up longer periods of possession for opponents in order to maintain defensive structure by never overcommitting or being caught in a complete defensive breakdown, always striving to stay below the puck and their man. Trotz's teams will allow opponents to take a lot of outside shot attempts, but do everything they can to prevent seam passes to be completed in the defensive zone. And when they do give up shots from the interior, those attempts mainly come with defensive pressure, with opponents often fighting through some sort of oncoming stick-check or a defender in close quarters to create a hurried chance.
This kind of defense also sets up goaltenders for success. During Trotz's time on Long Island, none of his goalies have allowed more goals against than expected, per public xG models. It's hard to believe that these goalies are not benefiting from the Islanders' defensive foundations, which do not allow as many of these number-bending chances against.
Another blind spot in some xG models is that there is a notable difference between an unguarded shot — one where a player can release the puck however he pleases and try to pick out an empty part of the net — versus a hurried shot where the player is just trying to get the puck on net.
The San Jose Sharks are an example of a team who I believe showed poor defensive structure and sloppy neutral zone play, allowing teams more of these numbers-curving chances against consistently over the last three seasons. The Sharks have allowed 80.81 Goals Above Expected in that timespan and while people love to point to Martin Jones as the problem (a valid concern, to some extent), the eye test shows that the Sharks' poor defensive play could be a very relevant cause of Jones' poor numbers.
Examples
I've pulled a few examples to help illustrate the point I am trying to make. The first two clips show chances from Boston's "Perfection Line" that were significantly more dangerous than the data suggests:
When you watch those clips, you can see that those chances have an extraordinarily high chance of going in the back of the net. But because public xG models can't account for the movement of the goaltender, they went down with a combined expected goals rating of 0.25.
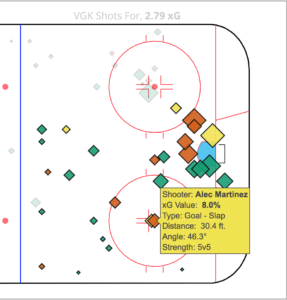
Here is another example of a play which goes inaccurately depicted in xG data, as Shea Theodore makes a spectacular shot fake before sliding it to Alec Martinez, with Carey Price having zero chance to get over after having to respect Theodore's shot.
The xG value of the goal goes as just 8% (0.08), because on an average of all attempts goals are converted at that rate from that location.
Admittedly, these are extreme examples illustrating more of a vast difference compared to what we would generally expect in these situations. But the point is that if teams are creating more high-end passing sequences or allowing complete breakdowns defensively on a consistent basis, it will not always be reflected in expected goal differential scores.
The margins in the NHL are so thin that we often talk about a team being significantly stronger than most of the league if they own even a 53% expected goals rate, or quite poor if they hold a 47% xGF mark. Thus, a team that creates or allows a larger number of these types of data-curving plays could actually be misrepresented by the available data that bettors tend to use.
Most folks would consider a gap of one expected goal over an entire game to be a considerable edge, but clearly that difference can be more than made up with 2-3 plays which do not accurately pop in these models. These concepts regarding controlling shot quality have really shown through in a number of series so far in this playoffs, and I believe have been a big part of why the Islanders and Canadiens were able to put together impressive runs, and more importantly, have treated bettors so well.
My point here is certainly not to entirely critique these expected goals models, of which I am a consistent user, but to offer insight into some additional details to keep an eye out for when watching the games and evaluating team performance from a handicapping standpoint. With regards to expected goals data and it's effectiveness, MoneyPuck's model predicted the average team's Goal Differential Above Expected falls within an average of 12.68 league-wide this season. So while there are some flaws in the data, it is certainly still true that these public models are incredibly useful for bettors.


