After loads of qualifying matches there has been a lot of changes to The Action Network International Soccer Power Rankings.
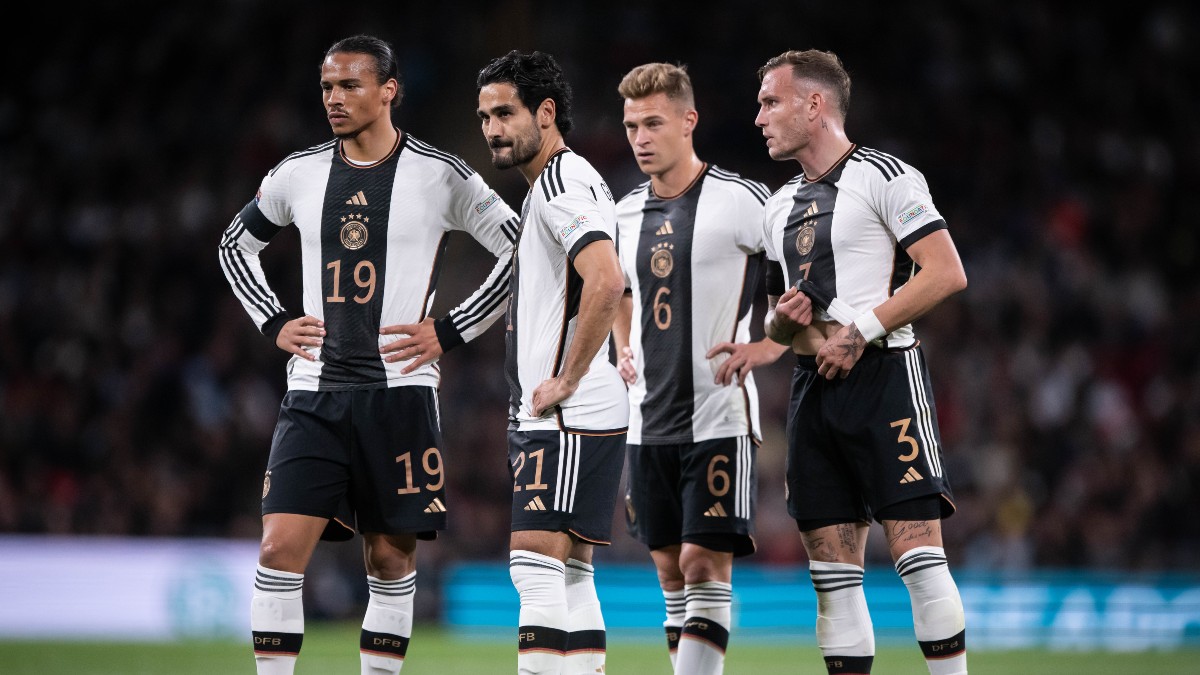
I've updated the rankings heading into this international break with England taking over the No. 1 spot. Germany is second, followed by Spain, France, and Brazil to round out the top five on the global scene.
Because CONCACF has such a low coefficient post-World Cup, the United States of America is 27th.
That said, let's take a look at the latest rankings.
| Rank | Country |
|---|---|
| 1 | England |
| 2 | Germany |
| 3 | Spain |
| 4 | France |
| 5 | Brazil |
| 6 | Argentina |
| 7 | Portugal |
| 8 | Italy |
| 9 | Netherlands |
| 10 | Belgium |
| 11 | Nigeria |
| 12 | Croatia |
| 13 | Norway |
| 14 | Uruguay |
| 15 | Switzerland |
| 16 | Austria |
| 17 | Colombia |
| 18 | Morocco |
| 19 | Denmark |
| 20 | Ecuador |
| 21 | Czech Republic |
| 22 | Sweden |
| 23 | Serbia |
| 24 | Scotland |
| 25 | Poland |
| 26 | Ukraine |
| 27 | USA |
| 28 | Mexico |
| 29 | Turkey |
| 30 | Chile |
| 31 | Slovakia |
| 32 | Greece |
| 33 | Wales |
| 34 | Ireland |
| 35 | Venezuela |
| 36 | Senegal |
| 37 | Hungary |
| 38 | Albania |
| 39 | Canada |
| 40 | Romania |
| 41 | Paraguay |
| 42 | South Korea |
| 43 | Bosnia-Herzegovina |
| 44 | North Macedonia |
| 45 | Japan |
| 46 | Ivory Coast |
| 47 | Peru |
| 48 | Slovenia |
| 49 | Georgia |
| 50 | Russia |
| Rank | Country |
|---|---|
| 51 | Montenegro |
| 52 | Bolivia |
| 53 | Kosovo |
| 54 | Israel |
| 55 | Mali |
| 56 | Finland |
| 57 | Iceland |
| 58 | Algeria |
| 59 | Moldova |
| 60 | Northern Ireland |
| 61 | Ghana |
| 62 | Luxembourg |
| 63 | Armenia |
| 64 | Estonia |
| 65 | Cyprus |
| 66 | Cameroon |
| 67 | Iran |
| 68 | Kazakhstan |
| 69 | Bulgaria |
| 70 | New Zealand |
| 71 | Faroe Islands |
| 72 | Azerbaijan |
| 73 | Malta |
| 74 | Belarus |
| 75 | Egypt |
| 76 | Congo DR |
| 77 | Latvia |
| 78 | Lithuania |
| 79 | Tunisia |
| 80 | Burkina Faso |
| 81 | Haiti |
| 82 | Panama |
| 83 | Andorra |
| 84 | Honduras |
| 85 | Australia |
| 86 | Jordan |
| 87 | Togo |
| 88 | Suriname |
| 89 | Jamaica |
| 90 | Curacao |
| 91 | Palestine |
| 92 | Guinea |
| 93 | Saudi Arabia |
| 94 | Iraq |
| 95 | Kenya |
| 96 | Kuwait |
| 97 | Oman |
| 98 | Dominican Republic |
| 99 | Qatar |
| 100 | Guatemala |
| 101 | Angola |
| 102 | Thailand |
| 103 | Cape Verde Islands |
| 104 | Turkmenistan |
| 105 | Costa Rica |
| 106 | Uzbekistan |
| 107 | Burundi |
| 108 | Benin |
| 109 | Gabon |
| 110 | South Africa |
| 111 | Philippines |
| 112 | Guinea-Bissau |
| 113 | UAE |
| 114 | Equatorial Guinea |
| 115 | Lebanon |
| 116 | Congo |
| 117 | Nicaragua |
| 118 | El Salvador |
| 119 | South Sudan |
| 120 | Swaziland |
| 121 | Uganda |
| 122 | Namibia |
| 123 | Gambia |
| 124 | China |
| 125 | Tanzania |
| 126 | Sierra Leone |
| 127 | Fiji |
| 128 | Cuba |
| 129 | Syria |
| 130 | Mauritania |
| 131 | San Marino |
| 132 | Rwanda |
| 133 | Zambia |
| 134 | Papua New Guinea |
| 135 | Mozambique |
| 136 | Libya |
| 137 | Tahiti |
| 138 | Liberia |
| 139 | Vietnam |
| 140 | Niger |
| 141 | Cook Islands |
| 142 | Solomon Islands |
| 143 | Ethiopia |
| 144 | Gibraltar |
| 145 | Central Africa Republic |
| 146 | Vanuatu |
| 147 | New Caledonia |
| 148 | Samoa |
| 149 | Trinidad and Tobago |
| 150 | American Samoa |
| 151 | Tonga |
| 152 | Bahrain |
| 153 | Tajikistan |
| 154 | Malawi |
| 155 | Malaysia |
| 156 | Macau |
| 157 | Zimbabwe |
| 158 | Indonesia |
| 159 | Sudan |
| 160 | Botswana |
| 161 | Kyrgyzstan |
| 162 | Madagascar |
| 163 | Comoros |
| 164 | Lesotho |
| 165 | Barbados |
| 166 | Singapore |
| 167 | Hong Kong |
| 168 | India |
| 169 | Yemen |
| 170 | Montserrat |
| 171 | Grenada |
| 172 | Djibouti |
| 173 | Cambodia |
| 174 | Sri Lanka |
| 175 | Afghanistan |
| 176 | North Korea |
| 177 | São Tomé and P. |
| 178 | Liechtenstein |
| 179 | Somalia |
| 180 | Chad |
| 181 | Eritrea |
| 182 | Seychelles |
| 183 | Pakistan |
| 184 | Myanmar |
| 185 | Puerto Rico |
| 186 | Mongolia |
| 187 | St. Kitts and Nevis |
| 188 | Nepal |
| 189 | Dominica |
| 190 | Brunei |
| 191 | Laos |
| 192 | Bhutan |
| 193 | Timor-Leste |
| 194 | Guam |
| 195 | Bangladesh |
| 196 | Saint Lucia |
| 197 | Maldives |
| 198 | Taiwan |
| 199 | Anguilla |
| 200 | Belize |
| 201 | Guyana |
| 202 | Bahamas |
| 203 | St. Vincent |
| 204 | Antigua and Barbuda |
| 205 | British Virgin Islands |
| 206 | Aruba |
| 207 | Turks and Caicos |
| 208 | Bermuda |
| 209 | US Virgin Islands |
| 210 | Cayman Islands |
Goal of These Rankings
The reason I decided to take on this project was because I saw a lot of weaknesses in the FIFA rankings and the organization's path to properly determining who's the best team in the world. FIFA's rankings are "results based", which I think is a major flaw given what we know about the long run statistical regression of expected goals.
For example, an uber talented team that puts up incredible underlying numbers, like Germany, crashes out in the group stage of the World Cup after getting caught on the wrong side of variance in two matches and because of that will drop significantly in the FIFA Rankings. That's not indicative indicative of trying to project who the best teams in the world are, in my opinion.
So, I decided to try and combat that by creating my own power rankings, to determine who's the world's best team based on a couple different factors that have nothing to do with what FIFA uses to create its rankings.
Four Factors Determining Rankings
1)Expected Goals Results
I am a big believer that expected goals is a better indicator of a nation's performance rather than just what the final score winds up being.
Expected Goals or (xG) measure the quality of a chance by calculating the likelihood that it will be scored from a particular position on the pitch during a particular phase of play. This value is based on several factors from before the shot was taken. xG is measured on a scale between zero and one, where zero represents a chance that is impossible to score and one represents a chance that a player would be expected to score every single time.
I have gone through and logged every country's xG results, but only from competitive competitions, meaning no results from friendlies or Nations League competitions were included.
Note: All xG results are from matches in the competitions listed below that have occurred from January 1st 2021 until today.
Here are the following competitions that are included for each confederation:
UEFA (Europe)
- European Championship Qualifiers
- European Championships
- World Cup Qualifiers
CONMEBOL (South America)
- Copa America
- World Cup Qualifiers
CONCACAF (North America)
- Gold Cup
- World Cup Qualifiers
- Copa America
CAF (Africa)
- Africa Cup of Nations Qualifiers
- World Cup Qualifiers
- Africa Cup of Nations
AFC (Asia)
- World Cup Qualifiers
- Asian Cup
OFC (Ocenia)
- World Cup Qualifiers
World Cup
2)Transfer Value Adjustment
I use Michael Caley’s method of using a team's overall transfer value to account for the talent level of each country.
Using Transfermarkt data and running a few different calculations, these are the top 25 countries based on total transfer-market value, along with the amount added or subtracted (if the countries total transfer value is below the world average) to their xG differential to help determine the overall rating.
*(data via transfermarkt.com)
3) FIFA Coefficients
Similar to the idea of UEFA Coefficients, which help determine how many teams each country can get into the Champions League, Europa League and Europa Conference League, I wanted to put a coefficient on each continent.
UEFA Coefficients are determined by how well the club teams from each country do in European competitions.
So, I applied that same method to FIFA Coefficients by going back through the last five World Cup competitions and gave out point values (based on the criteria below), along with a weight for the average transfer value by continent to get to a value that can be added to each country's rating based on what continent it resides in.
FIFA Coefficient Points:
- Two points: For all wins in the group stage & knockout stage
- One point: For all draws in the group stage
- Two points: Bonus for finishing second in the group
- Four points: Bonus for winning the group
- One point: Bonus for each round reach from the Round 16 onward
After some calculations, here are the following "FIFA Coefficients" that are added to each country's xG differential plus transfer value adjustment:
As you can see, Europe and South America are weighted far greater than the rest of the world, which makes sense considering no team outside of Europe or South America has made the semifinal round in the last four tournaments.
4) Strength of Schedule
Strength of Schedule needs to be taken into account when determining rankings like this:
Worldwide
Even though FIFA coefficients can give us a good weight for each continent's true level of play, another strength of schedule at the world level is necessary to properly rate each country.
So, there's a "final ranking before strength of schedule adjustment," which is the Final rating after taking into account xGDiff plus transfer value adjustment plus a strength of schedule adjustment.
The strength of schedule adjustment is done by taking the average worldwide strength of schedule divided by the average rank of opponents faced minus 100 percent.
After all of that, we reach the final rating for each country, which is:
Final Rating = xGDiff per match + transfer value adjustment + FIFA coefficient + strength of schedule adjustment.


