


Betting on baseball can be a complicated and humbling endeavor, given the high level of variance that plays out on a game-to-game basis – but math can help to eliminate much of the guesswork, and also neutralize bias when it comes time to make selections; particularly to avoid going full tilt during a losing streak.
It's important to note – and I will repeat this – that you should treat my game projections as a guide, rather than as gospel.
You won't see me blindly tailing every play that the model shows with expected value – but I do bet the majority of the recommendations while pressing on some plays that I like, i.e. bets I would have made without a projection system telling me to do so too.
Individual teams, like the Orioles, for instance, will show line value nearly every game against top teams. At some point, you need to be willing to write off the worst few teams in the league almost entirely and look to choose your spots with them on rare occasions.
Additionally, you will rarely see me go against one of my projections, and place a wager that I would deem to have a negative expected value. There would have to be an extremely extenuating circumstance related to something that I could not accurately project – like betting the over in the 2019 MLB London Series games, for example.
Below, you will find an explanation of my baseball betting model, what my process does and does not include, how I make adjustments to my model, and what you can do to optimize the daily projections that I provide.
Beneath those sections, you will find a recap of my 2019 betting performance using version 1.0 of this model.
As a final note, please keep in mind than anything can happen in one nine-inning baseball game. In 2019, the Houston Astros lost twice in August in 10 days to Baltimore (+406) and Detroit (+451) at odds of -462 and -518, respectively.
Even if you are a lifelong baseball fan, betting on this sport will often leave you mystified. As a result, I keep my wager sizes relatively small and consistent and attempt to continually grind out a profit and avoid significant losses each day.
![]()
![]()
![]()
What the Model Includes
Player Projection & Player Performance Inputs
The basis for any baseball betting model is the player data. Mine has two input subcategories for both pitchers and hitters: player projection metrics, and player performance metrics.
Projection metrics are preseason projections – whether taken from a specific source, compiled from multiple data sources, or created through your own volition.
FIP or Fielding Independent Pitching measures what a pitcher’s ERA would look like if the pitcher experienced league-average defense and luck. xFIP is a regressed version of FIP that adjusts or “normalizes' the home run component based on park factors.
wRC+ or Weighted Runs Created Plus takes the statistic Runs Created and adjusts that number to account for critical external factors — like ballpark or era. It’s adjusted, so a wRC+ of 100 is league average, and 150 would be 50 percent above league average.
wOBA or Weighted On-Base Average is a catch-all hitting metric with more predictive value than on-base percentage. An average MLB hitter can be expected to post a .320 wOBA.
I like to create composite projections for all sports, but I don't think I can do better for baseball player projections than the ATC Projections by Ariel Cohen. Instead of applying equal weights to various data sources, "weights within ATC are based on the careful study of the historical performance of its underlying projection systems."
Ariel was the 2019 FSWA Baseball Writer of the Year and finished as the No. 1 ranker on FantasyPros in 2019. I'm incredibly confident in my abilities relative to all things baseball. Still, I am not creating a better player projection set than ATC without years of testing and refinement, so why waste time when I can spend it tweaking so many other things?
The player projection inputs for my model are only updated a few times per year – because it is the backbone as a median expectation for each player. These include raw stats like playing time expectations for both hitters and pitchers and advanced stats like wOBA and FIP – which you can use to compare every hitter or pitcher to league average.
The player performance inputs for the model, which include the troves of batted data from Baseball Savant, are updated daily and are meant to capture how good a player is right now. Similar to the projection inputs, you can use the performance metrics to compare every player relative to the league average.
Not to jump the gun completely, because we will get into some of the other adjustments, but here is one example of competing input expectations for opening day using both subsets of data:
- Yankees Offense Projection: 5.84 Runs Per Game
- Yankees Offense Performance: 6.31 Runs Per Game
The Yankees averaged 5.82 runs scored per game in 2019, and the base projection expects roughly the same output from a healthier cast in 2020. Still, the batted ball data is significantly higher on DJ Lemahieu, Giancarlo Stanton, Gary Sanchez, and Gio Urshela (and slightly lower on Gleyber Torres), and accounts for their upside.
Now take a look at how Max Scherzer and Gerrit Cole stack up for opening day:
- Gerrit Cole Projection: 3.17 FIP
- Gerrit Cole Performance: 2.76 FIP
- Max Scherzer Projection: 3.20 FIP
- Max Scherzer Performance: 3.10 FIP
Like some of the Yankees' offensive players, Cole has seen a noticeable uptick in his recent skill level, and the base projection isn't adequately accounting for that upside – while the batted ball performance metrics serve to balance out such multi-year data regressions. Cole (2.48 xFIP in 2019) is not even close to the same pitcher who posted a 3.81 xFIP in 2017.
The secret in using these two input methods is to figure out how to weight them together.
Run Environment Adjustments
After comparing every player relative to league average, using both projection and performance inputs, you need to multiply those anticipated averages by the expected major league run environment.
I had a few critical things to consider for 2020:
- Juiced baseballs.
- The season starting in August when run-scoring is at its peak.
- The implementation of the universal DH.
- Automatic runners on base in extra innings.
MLB teams scored an average of 4.84 runs per game in 2019 while hitting a league-record of 6,776 home runs. From what I have seen in intra-squad and summer league games, the ball is still flying even when you don't hit it squarely:
19-year-old @Greene21Riley out here robbing homers. 😱 pic.twitter.com/r5gjbhBYlu
— MLB (@MLB) July 13, 2020
Over the past five years, scoring in August has been 2.3% higher, relative to the rest of the season:
- March/April: -2.68%
- May: -1.74%
- June: +1.21%
- July: +0.04%
- August: +2.25%
- Sept/Oct: -0.04%
Furthemore, over the past five years, scoring in the American League has been 2.4% higher than in the National League.
People are torn as to whether the new extra-innings rule will lead to more runs overall – for now, we'll have to see how that one plays out.
Given these factors, to begin the season, I increased my projected run environment by 1.8% over 2019. And I still have a healthy mix of over and under bets showing value on opening day.
I'll still try to adapt to the overall outlook rather aggressively, however. In a shortened season, managers will be willing to run their best starters longer and deploy their best relievers more frequently – and the top pitchers in the game will all be tossing a higher percentage of their team's innings.
Many of these pitchers could be out of sync after a shortened preparation period, however.
Park Adjustments
The Rangers' new ballpark is the biggest puzzle in the 2020 projection equation. Globe Life Park was playing about 24% higher than the league average before the Rangers moved into a convertible dome.
The new roof figures to stay closed during the hot summer months, which only helps the pitchers, and I have Globe Life Field rated as a neutral park for the time being.
Here are my top three and bottom three park factors:
- Colorado: +34%
- Washington: +8%
- Boston: +7%
- Los Angeles (NL): -10%
- Miami: -14%
- New York NL: -16%
Split Adjustments
Certain handed pitchers perform significantly better against certainly handed batters, and vice-versa, and you need to account for such adjustments – particularly with regards to starting pitchers.
However, with the implementation of the three-batter minimum, bullpens also won't be able to match up as well against opposing offenses, and pitchers like Oliver Perez take a hit from a projection standpoint; getting fewer optimal opportunities.
Four teams in particular – the Astros (131), Twins (126), Yankees (123), and Athletics (115), each have a ton of right-handed power and ranked as the top four teams against left-handed pitching in 2019, per wRC+.
The Astros and Athletics both draw a southpaw opponent on opening day and are teams I regularly find value on and look to bet against left-handed pitching.
Bullpen Availability & Rest
Since the model is player-based, rather than team-based, I can pull relievers in and out of prospective bullpens based upon availability.
Additionally, I can penalize relievers who pitched the previous day. Generally speaking, the average fastball for a relief pitcher drops off by 0.6 mph when throwing on a back-to-back, a penalty of roughly one-quarter of one run.
If he pitches three days in a row, the expected penalty is roughly 1.5 mph and three-quarters of a run.
Player Usage
Every pitcher in my projections has a stamina rating.
For the top arms in the game, I'm expecting most of them to get around 100 pitches in their first start of the 2020 season – but the middle and back of the rotation arms will likely be eased into things, and I can downgrade their expected contributions early, before normalizing them at a later point in time.
The stamina rating typically covers the first five innings. When it doesn't, I need to figure out the likely piggyback option and compile a projection for a composite starter between the opener and piggyback. For regular starters, the stamina rating determines how much of each game I expect either bullpen to finish.
Batting order placement is vital for lineup projections. A leadoff man should get about 42% more plate appearances than a No. 5 hitter, while the No. 9 hitter will receive 46% fewer opportunities.
Defense
This is the one area where I feel that my model truly differentiates itself from any other. Before joining the Action Network, I became intimately involved in defensive scouting while working for a baseball data provider.
Defense is the single most underrated aspect of baseball analysis and a significant driver for both over and underperforming clubs.
It is a big reason why I am consistently high on a team like the Diamondbacks, who lead MLB with 260 defensive runs saved over the past two seasons – an average of 0.8 DRS per game.
The Dodgers (+167 DRS), Brewers (+147), Astros (+136), Rays (+112), and Athletics (+90) are the other top defensive teams since the start of the 2018 season.
Home-Field Adjustment
As my colleague, Stuckey, has pointed out, home teams in baseball typically have an 8% edge over road teams, with a 54% win rate over time.
There won't be crowds in attendance this year to sway umpires on the ball and strike calls, however, and the visiting teams – most of whom are playing divisional mates in the same time zone – should be relatively familiar with the opposing ballparks.
Travel could be more strenuous, however, given the circumstances surrounding the pandemic, and I don't want to eliminate my home field adjustment, at least for now.
Regardless of whether or not that decision is proper, you always need to factor in an adjustment for the total, given the probability of the home team winning with a lead in the top of the ninth inning.
The rough calculation? One-ninth of their projected team nine-inning team total, multiplied by their win probability and subtracted from that projected team total.
What the Model Does Not Include
Preseason Team Projections & Hot and Cold Streaks
The model is entirely player-driven. It doesn't know that the Dodgers were expected to win 101 games in a 162-game season or 38 games in a 60-game season – it merely projects their likelihood of winning one single baseball game – with no context. And I plan to keep it that way.
A team could be on a record-setting winning streak or a record-setting losing streak, and it will still give me the same projection.
This betting model is built using an entirely different process than my preseason team win total, divisional, and World Series projections.
Exact Wind and Weather Adjustments
If the model has one major weakness, it is a failure to appropriately measure wind and weather adjustments during significant conditions, which is why you should never bet these totals blindly.
I'm still keen on finding a fix, but I don't want to adjust until I can measure the weather correctly.
For now, I'll continue to rely on the Fantasylabs weather reports, and some of the wind-based data provided by BetLabs – to make some manual adjustments to these run projections.
Here is an example for Wrigley field, which has covered by an average margin of 0.52 runs per game – and would likely cause me to bump my projected total down in a Cubs home game by a half run – if it was flagged:
Lineup Adjustments
Since I release these projections well in advance of starting lineup announcements, and often in advance of official starting pitcher announcements for specific games, I cannot predict every lineup with 100% certainty.
However, if there are any significant changes to any game projections as a result of a late lineup or pitching change, I will post an update on Twitter.
Travel and Rest
I often wonder whether travel is part of the home-field advantage factor, or whether it is a separate input.
Additionally, does rest even matter when you have to travel on that off day, or if you are off in a foreign city – particularly during a pandemic?
These are almost impossible questions to answer and not factors that I am readily able to implement into a projection model.
Umpire Adjustments
Similar to the weather adjustment, umpire adjustments are not a factor that I am entirely comfortable implementing as of yet, but it is one that is high on my list of priorities.
Similar to the lineup announcements, this is a change that would require late notice (before the first game of a series), but it could have a much more significant impact on the game projections.
While most umpires are neutral and a few are wildly inconsistent, there are some significant outliers too. And while individual umpires do evolve throughout their careers, some also get stuck in their ways – and become somewhat predictable.
Instead of making small adjustments for every single umpire, I need to identify the outliers and target them aggressively. I do have a shortlist, but with multiple umpires opting out of the season, I'm also going to be keeping tabs on some of the replacements.
2019 Betting Record
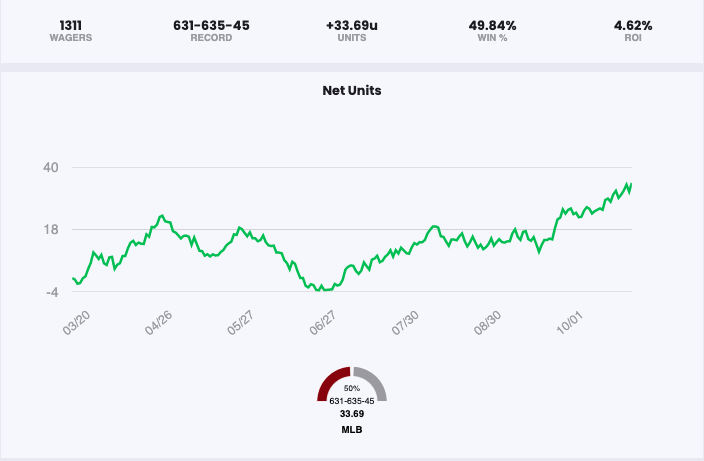
Overall, I was delighted with the model's 2019 performance. I profited more than 30 units on the season with a 4.6% return on investment – and while you might scoff at a sub-50% win rate on all wagers, note that the vast majority of those bets were on moneyline underdogs.
Allow me to break them down by subcategory:
- Moneyline: 47.3% Win%, +26.7 units, 5.9% ROI
- First Five: 50.9% Win%, +3.73 units, 3.1% ROI
- Full Game: 46.2% Win%, +22.8 units, 6.8% ROI
- Home: 46.9% Win%, +5.08 units, 2.3% ROI
- Away: 47.8% Win%, +21.66 units, 9.3% ROI
- Spread: 59% Win %, +7.65 units, 13.4% ROI
- First Five: 57.4 Win%, +2.04 units, 5.6% ROI
- Full Game: 61.1% Win%, +5.28 units, 27.8% ROI
- Home: 60.4% Win%, +4.3 units, 15.6% ROI
- Away: 57.7% Win%, +3.35 units, 11.3% ROI
- Totals: 53.2% Win%, -4.7 units, -2.4% ROI
- First Five: 50 Win%, -0.69 units, -5.56% ROI
- Full Game: 53.5% Win%, -3.99 units, -2.2% ROI
- Over: 59% Win%, +4.57 units, +9.67% ROI
- Under: 51.5% Win%, -9.27 units, -6.2% ROI
The positive win rate and a negative return on totals should probably stand out. I debuted the model before last season, and I was playing the totals smaller earlier in the season until I gained more confidence in the totals it was projecting.
After winning on 55.1% of those totals through May, I upped the base unit size in the second half and mostly succumbed to variance and vig during the final few months; 50% win rate, -4.7 units, -6.07% ROI from August 8 through the World Series.
Testing won't be a concern this season, and I have made further adjustments to tighten the totals.
Otherwise, there are positive signs virtually across the board and more robust indicators that, perhaps, I should consider playing spreads more frequently.
Lastly, however, I want to point out my 2019 month-by-month breakdown because it's important to remember that MLB betting is a grind and a continual process. While you will suffer some seemingly neverending losing streaks you can always come out on the other side if you stick to your process:
- March/April: +20.11 units (18.1% ROI)
- May: -5.42 units (-5.8% ROI)
- June: -18.38 units (-16.8% ROI)
- July: +13.87 units (13.7% ROI)
- August: +0.85 units (0.7% ROI)
- September: +13.23 units (10.2% ROI)
- October: +7.78 units (15.6% ROI)
I won just 37% of my moneyline wagers (79-133, -24.2 units) in May and June compared to a rate of 51.1% (290-279, +50.9 units) the rest of the season.
The dogs stopped barking for a couple of months, but they eventually started back up again.


