


- Sean Zerillo's MLB model helps you find edges when betting moneylines and over/unders for the full game and first five (F5) innings.
- He analyzes the full slate of games on June 15 with his model below and highlights Rays-Angels (1:10 p.m. ET) and Mets-Cardinals (7:10 p.m. ET) as potential edges.
- Plug in your odds to the spreadsheet at the bottom of this article to see where you might have an edge.
Astros super-rookie Yordan Alvarez hit another mammoth home run last night:
That is a long way for a lefty to hit it to left-center. 😱 #BeGreaterpic.twitter.com/9z6AqWVNlb
— MLB (@MLB) June 15, 2019
Tragedy also struck for Rockies moneyline backers:
Rockies moneyline backers … OH NO.
Colorado led 11-5 entering the 9th and had a 99.98% win probability.
And then the Padres scored six runs to force extras and lost in the 12th.
🤮🤮🤮 pic.twitter.com/mentIQxYkK
— The Action Network (@ActionNetworkHQ) June 15, 2019
San Diego won a game that they had a 0.2% chance of winning, a stunning fact which our app and FanGraphs agreed upon.
We have a new candidate for the worst beat of the season.
Recapping Yesterday's MLB Model
At writing yesterday, the model would have gone 0-2 against full-game moneylines and 1-3-1 against first-five innings moneylines (F5).
My plays went 2-8, and I finished down 3.54 units for the day.
It's no consolation during this extended rough stretch, but another positive day in terms of Closing Line Value (CLV) keeps my faith strong.
I gained 32 cents overall against moneylines and spreads, the Under in Oakland moved from 9.5 to 9.0, and the under in Cincinnati dropped from 10.0 to 9.0.
I only truly missed on the Nationals over, which dropped from 7.5 to 7.0; and of course, that was one of my two winners on Friday.

MLB Betting Model for Saturday, June 15
All odds as of Saturday morning (view live MLB odds). Stay tuned on Twitter or follow me in The Action Network App for my entire betting card for Saturday.
Today, the model recommends two full-game moneylines and four moneylines for the first-five innings (F5).
As of writing, the 3.5% trigger threshold officially marked the Baltimore Orioles and San Diego Padres as full-game plays. The model also likes the Orioles and Padres, in addition to the New York Mets and Washington Nationals as F5 plays.
I'm not particularly in love with any of these plays today; the Orioles face Chris Sale and each of the Mets, Nationals and Padres have some sharp signals going against them.
Instead, I took under 8.5 in the Mets-Cardinals game, which has actually moved up to 9.0 in some places due to over 70% of the cash and tickets on the total coming in on the over.
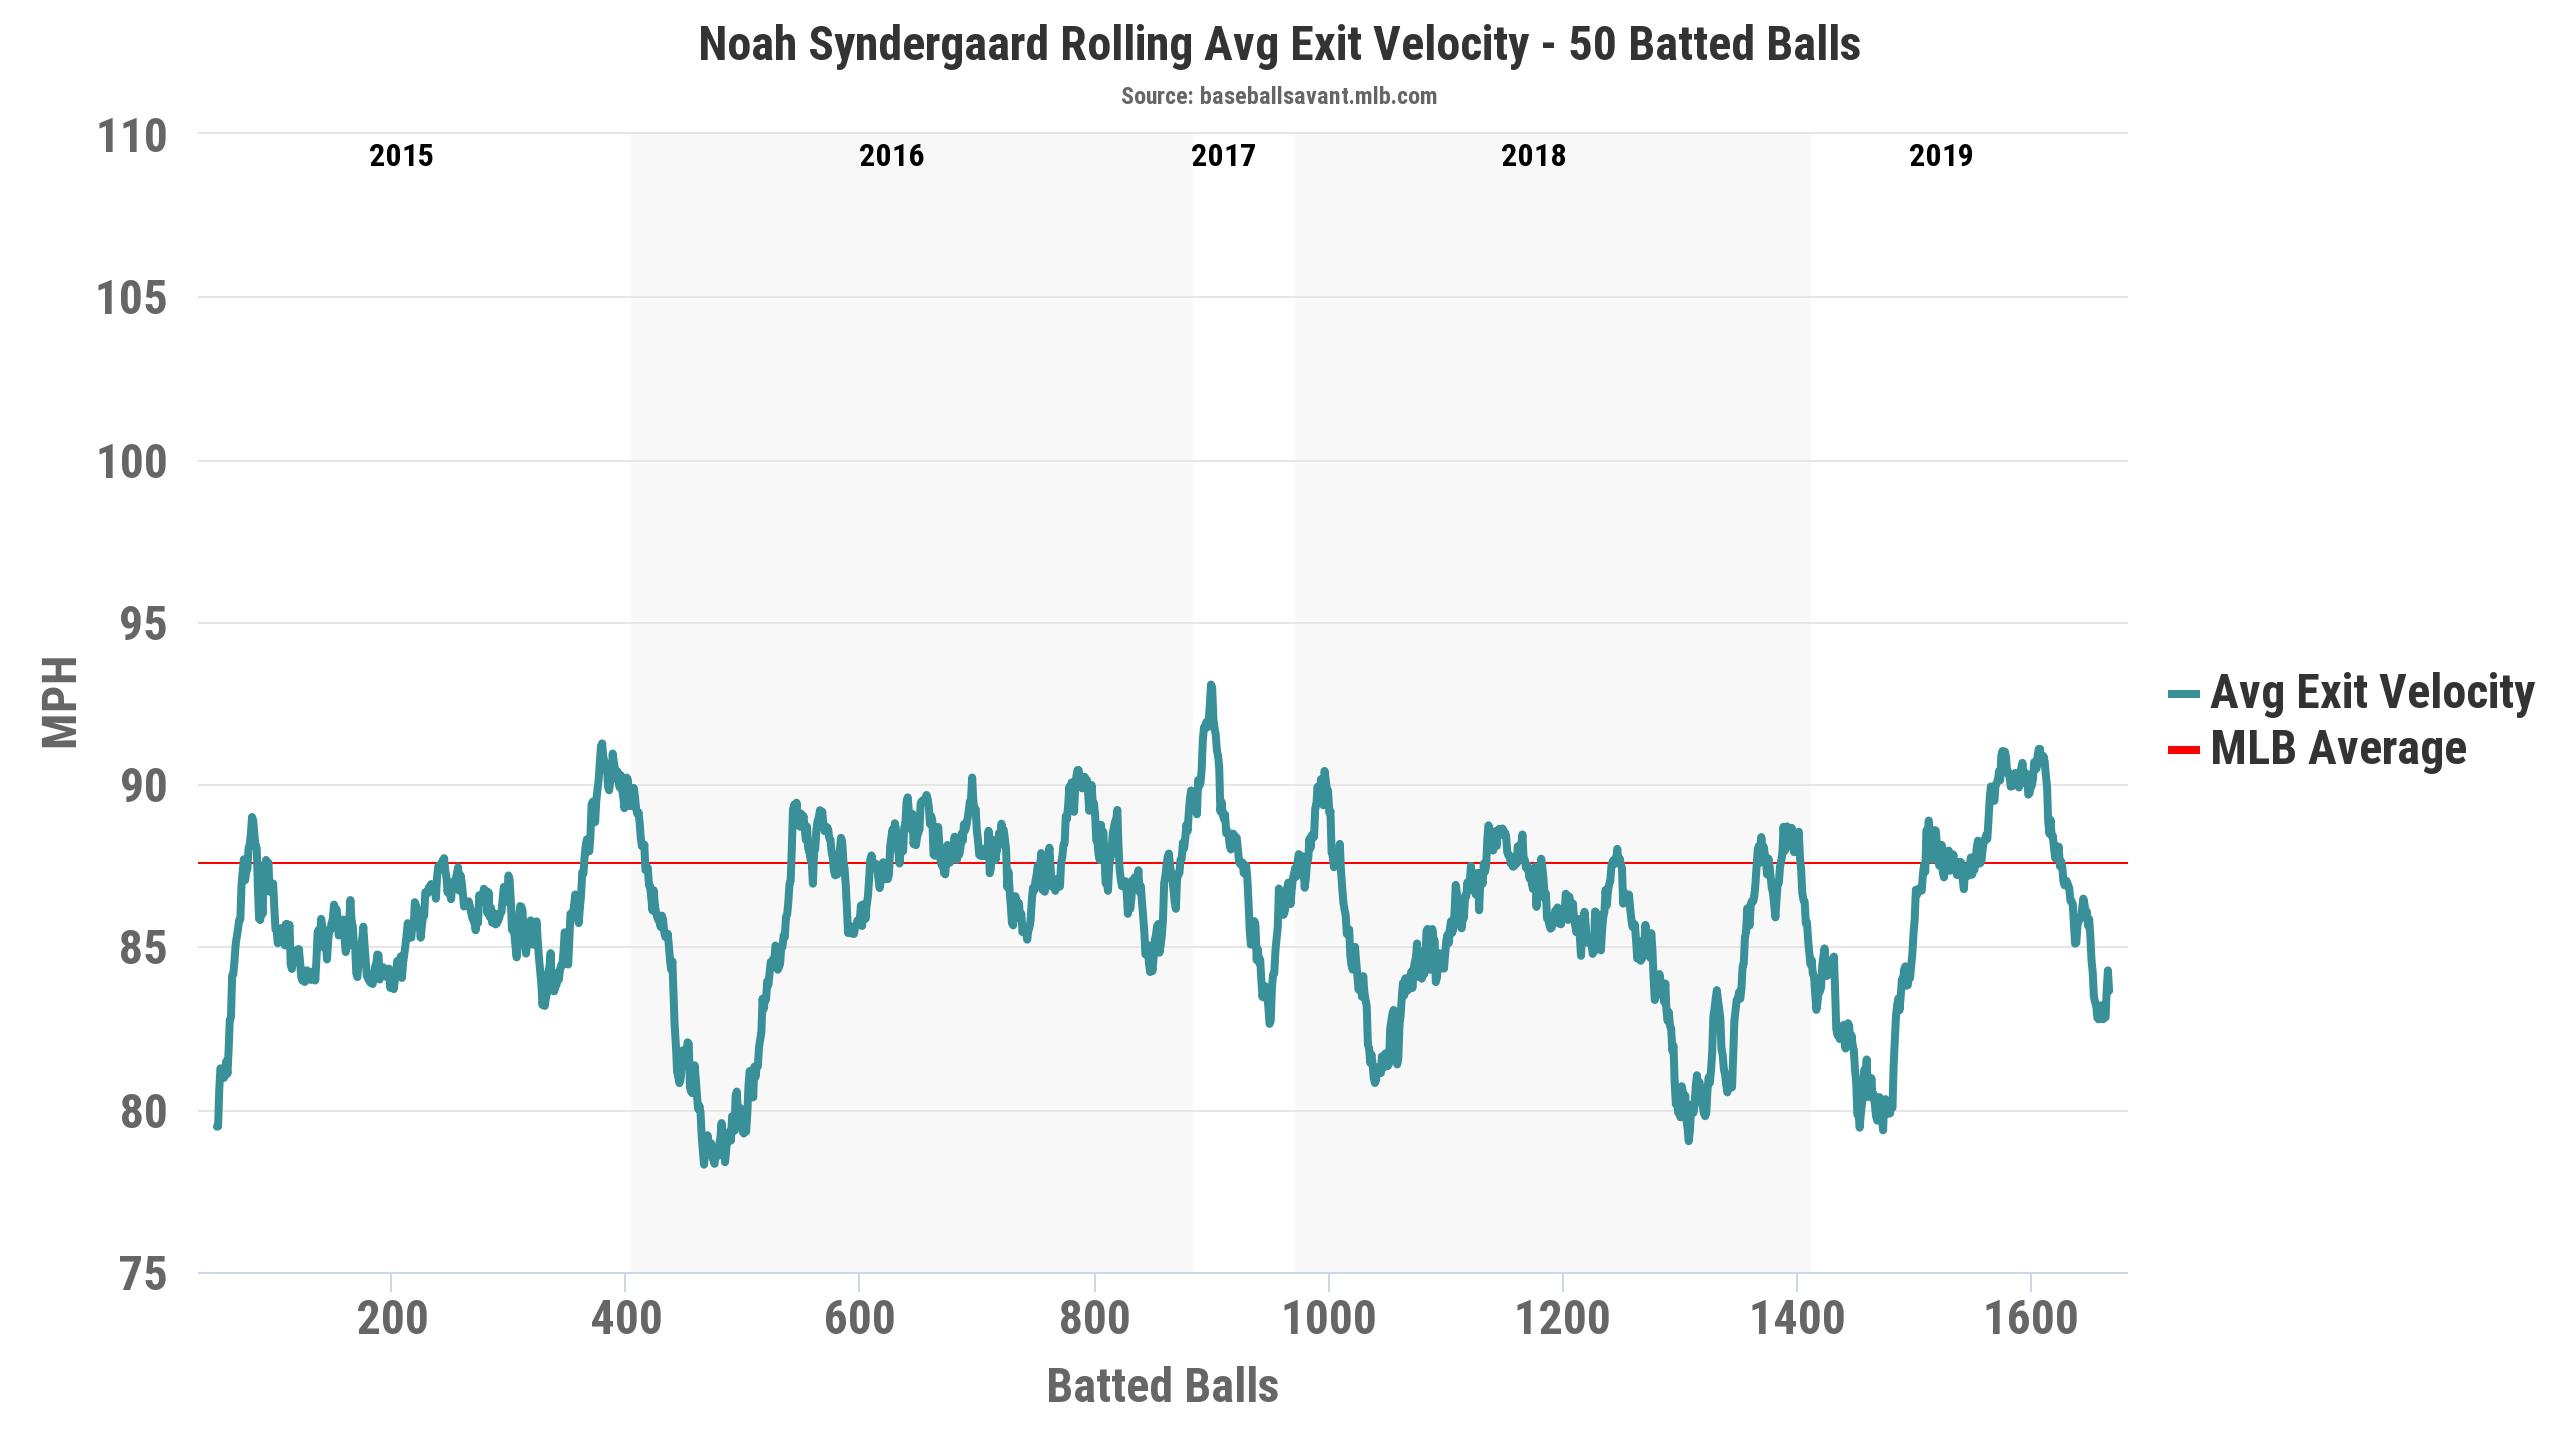
Noah Syndergaard was on point in his last start against the Rockies (7 IP, 1 H, 0 R, 2 BB, 7 K) and finally got through an outing unscathed. He and his ERA (4.45) have been victimized by the Mets often inept defense, and some weakly hit balls in play which have fallen for hits.
His FIP suggests an ERA about a run lower (3.48) and his xwOBA (.271) has been very consistent going back to 2015 (.268, .279, .266, .265).
His average exit velocity allowed on batted balls (86.2 mph) has also tracked consistently going back to 2015 (84.9 mph, 86.2 mph, 86.6 mph, 85.4 mph).
At two different points in May, Syndergaard's exit velocity allowed over rolling 50 plate-appearance periods reached 91 mph. That's plummeted to 83 mph most recently, trending closer to his career peak:
Thor's slider has been his best weapon over the course of his career, with a pitch value of +25.4. However, he's throwing it 10% less often in 2019 than in 2018, and it's showing negative value for the first time in his career.
Perhaps it's a confidence issue with the pitch. Take a look at where Syndergaard's sliders were located between 2017 and 2018 (per FanGraphs):
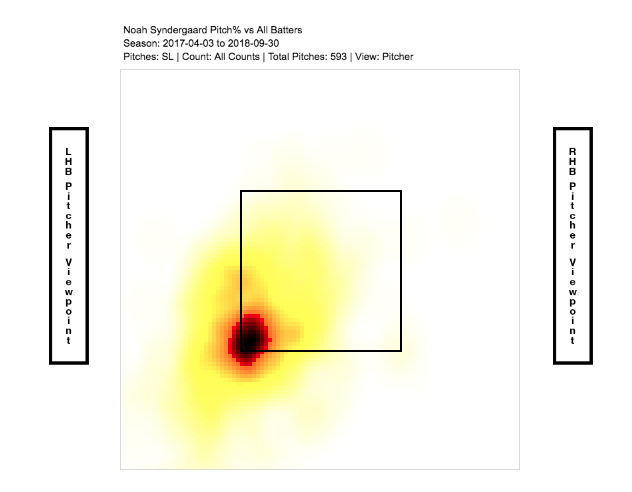
Now look at his slider locations through May of 2019:
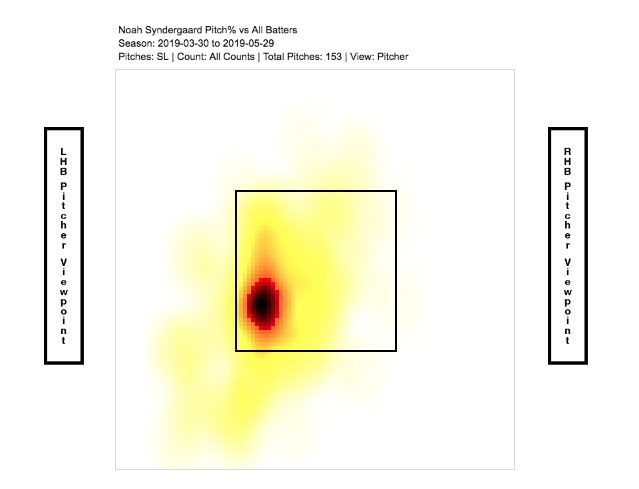
In his two recent starts in June he's thrown less than 10 sliders in total, but they've all been located on the outer black of the strike zone rather than being left closer to the middle of the zone as in the heat map above.
This is what the slider should look like when it's working:
Thor, Nasty 91mph Slider leaves Dansby a bit wowed…literally. 🤣 pic.twitter.com/5xQ31PXHOk
— Rob Friedman (@PitchingNinja) April 21, 2018
I'll be watching to see whether Syndergaard starts going to the slider more frequently, or whether he still doesn't trust the pitch.
Lastly, the Oakland Athletics and Tampa Bay Rays will each face a southpaw again today. On Friday I gave out some trends regarding those teams against the full-game moneyline and F5 spread vs. lefties.
Here are some trends about these teams against the full-game spread:
- Since the beginning of 2018, the Rays are 22-15 (+$1,071, 28.9% ROI) and the most profitable team in baseball as spread favorites vs. lefty starters. They're 10-4 (+$661) on the road and 12-11 (+$410) at home.
- Oakland is just 18-20 (+$117, 3% ROI) over the same period and 7-6 in 2019. They're also 10-14 (-$112) at home, and 8-5 ($329) on the road.
But the A's are built to hit left-handed pitching and their strong offensive split and moneyline trend vs. lefties (46-32 since 2018) leads me to believe that there will be regression towards larger spread victories in these matchups.
They also own a +78 run differential compared to the Mariners and throw their ace today in Frankie Montas (3.05 FIP).
Amongst pitchers who have faced 250 or more hitters in 2019, Montas ranks 19th with a .280 xwOBA.
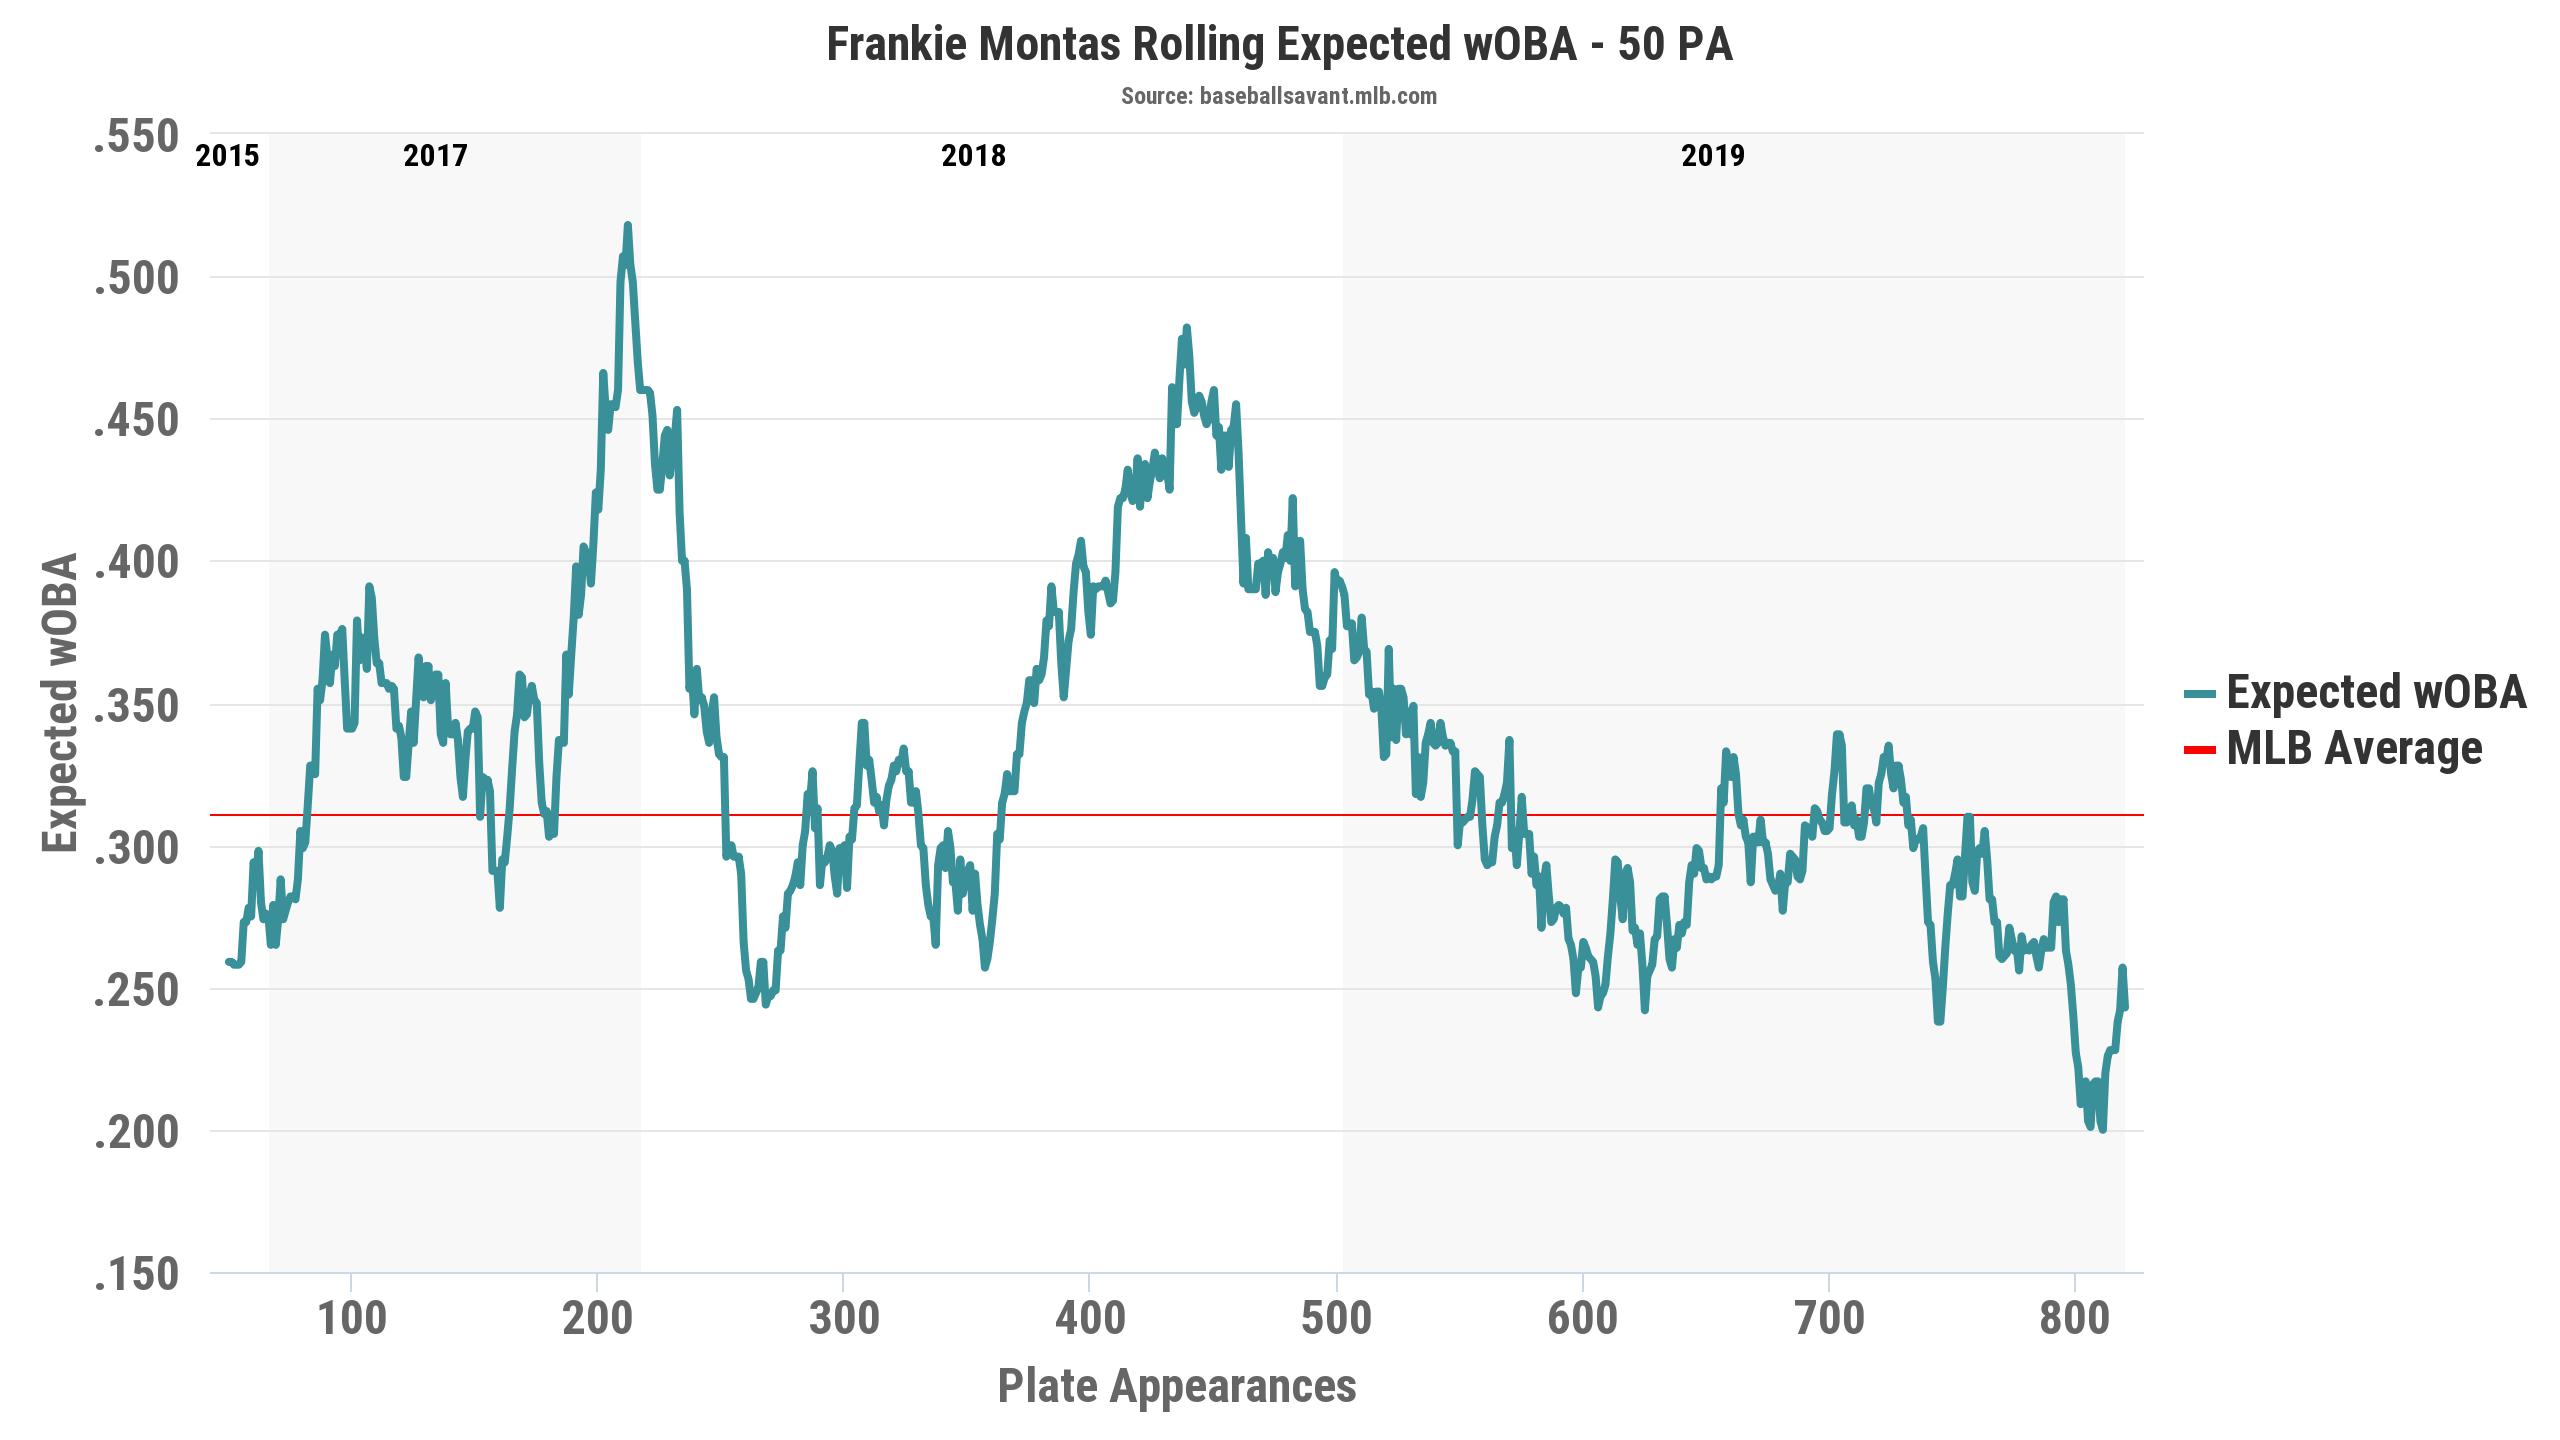
Six of his past seven outings have been quality starts.
Montas added a splitter this season (18% usage) and it's helping him to an all-star breakout at the age of 26:
11 dirty Frankie Montas Swing & Miss Splitters in 16 Seconds. 😦 pic.twitter.com/TDY5EEpWJj
— Rob Friedman (@PitchingNinja) May 22, 2019
Bets (So Far) for June 15
- Oakland Athletics (-1.5, -125) Game Spread
- Tampa Bay Rays (-1.5, +100) Game Spread
- Under 8.5 (+100), St. Louis at NY Mets
Stay tuned on Twitter or follow me in The Action Network App for my entire betting card for Saturday, June 15.
Zerillo's Full MLB Model, 6/15
Download the Excel doc with my projections to input odds from your sportsbook. These projections cover the full game and First 5 moneylines and over/unders. A sample of one of the sheets is below.


