


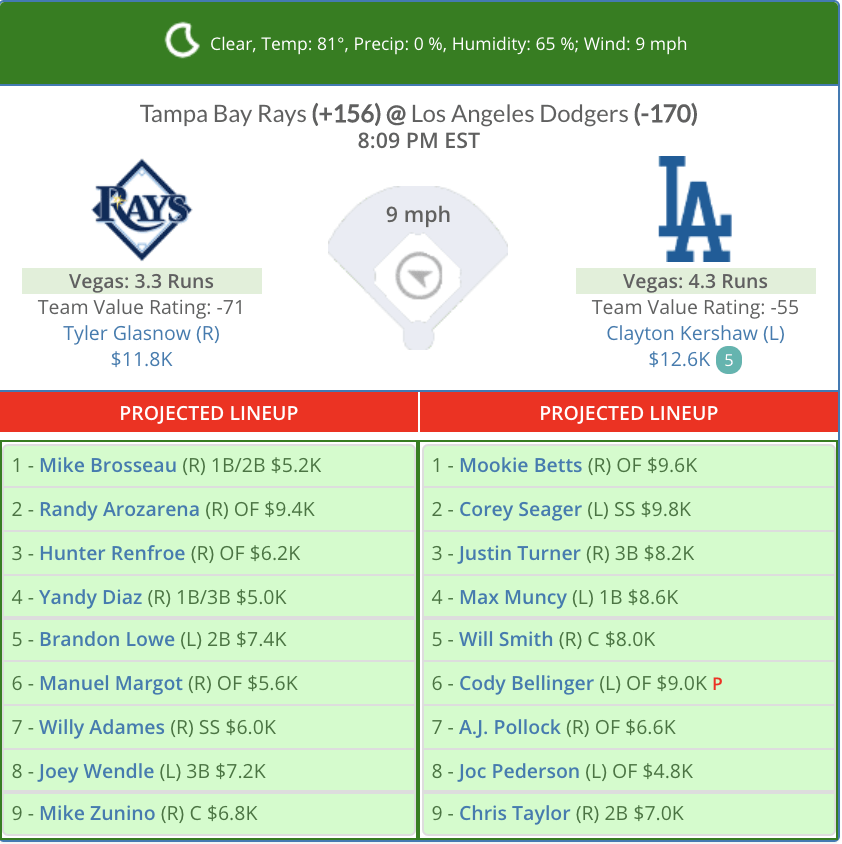
- Betting odds for World Series Game 1 between the Rays and Dodgers have the Dodgers listed as -160 favorites with the Rays at +135.
- With Tyler Glasnow pitching against Clayton Kershaw, the total is set at 7.5.
- Sean Zerillo breaks down the complete matchup, and offers his projections and pick on the Game 1 moneyline.
Rays vs. Dodgers Game 1 Odds
| Rays Odds | +135 [Bet Now] |
| Dodgers Odds | -160 [Bet Now] |
| Over/Under | 7.5 [Bet Now] |
| First Pitch | 8:11 p.m. ET |
| TV | FOX |
Odds above as of 6 p.m. ET via PointsBet, where you can get $250 FREE instantly after signing up AND your bets automatically sync to the Action app.Learn more about BetSync here.
Model Projection (full projections here)
- Rays probability: 46.5% (Fair odds of +115)
- Dodgers probability: 53.5% (-115)
- Projected total: 7.54
The two teams directly built in the image of Andrew Friedman — the Tampa Bay Rays and the Los Angeles Dodgers — will meet in the 2020 World Series.
Friedman helped to guide the Rays to their first-ever postseason appearance back in 2008, before becoming the Dodgers' President of Baseball Operations in 2014, where he instilled similar principles and organizational building tactics, with a significantly larger budget.
The Rays, who finished 28th in team payroll ($28.3m) this season, have a chance to take down three of the four richest clubs in the Yankees ($109M, first), Dodgers ($108M, second), and Astros ($82M, fourth), all in the same postseason and en route to their first World Series title.
The Dodgers and Rays were the two best teams in their respective leagues in 2020, finishing both with the best records and best-run differential figures relative to their competition.
And they were each tested in these playoffs — the Rays captured two winner-take-all elimination games, and the Dodgers had to navigate past the Padres (No. 2 in MLB with a +84 run differential) and the Braves (tied with the Rays with a +60 run differential).
Getting the correct World Series result doesn't necessarily mean that the playoff process was sound, however. The expanded Wild Card round was largely a dud, and the fact that these two great clubs, who had done so much to separate themselves from the rest of their leagues and divisions (pro-rated to 16 game leads over a 162 game season), were placed two games away from elimination after dominating their schedules was ludicrous. Hopefully, MLB reconsiders their stance on this expanded playoff format, and at least gives the No. 1 seed in each league a bye moving forward.
Increasing from a 10-team playoff to a 16-team format, and adding another round, decreased each favorite's World Series chances by nearly 10% — leaving us with a 4-6% probability of actually seeing the two best teams make it together.
That being said, I'm excited to analyze these two teams and two dominant and diverse pitching staffs as we get ready for an extremely competitive Fall Classic.
Advanced Stats Glossary
FIP or Fielding Independent Pitching measures what a pitcher’s ERA would look like if the pitcher experienced league-average defense and luck. xFIP is a regressed version of FIP that adjusts or “normalizes' the home run component based on park factors.
wRC+ or Weighted Runs Created Plus takes the statistic Runs Created and adjusts that number to account for critical external factors — like ballpark or era. It’s adjusted, so a wRC+ of 100 is league average, and 150 would be 50 percent above league average.
wOBA or Weighted On-Base Average is a catch-all hitting metric with more predictive value than on-base percentage. An average MLB hitter can be expected to post a .320 wOBA. xwOBA is a regressed version of wOBA that accounts for variables like park factors.
Projected Starters
Tyler Glasnow (2-1, 4.66 ERA, 25 K) vs. Clayton Kershaw (2-1, 3.32 ERA, 23 K)
I previewed both Tyler Glasnow and Clayton Kershaw before prior starts in these playoffs, so allow me to recollect my thoughts on both pitchers, below:
Tyler Glasnow (Rays)
- Break out 2019 campaign following 2018 trade to Tampa Bay (with Austin Meadows, for Chris Archer)
- Elite fastball velocity (94th percentile) and curveball spin (92nd percentile)
- Primarily a fastball (60.6%, 96.6 mph) and curveball pitcher, with a rare changeup (4.7%, 91.1 mph)
- Reverse Splits since 2019: .227 wOBA vs. LHH; .282 wOBA vs. RHH
- Increased his curveball usage from 29.2% to 34.8% this season, likely on the recommendation of Tampa Bay’s analytical scouting staff.
- Increased both his strikeout-minus-walk rate and whiff rate by two percent, while lowering his xFIP from 2.94 to 2.75, even though his xERA increased from 2.3 to 3.13 as a result of additional hard contact allowed
Tyler Glasnow, Ferocious 85mph Curveball.
Like wtf are you supposed to do with that? 😂 pic.twitter.com/bCPRzjnho1
— Rob Friedman (@PitchingNinja) October 15, 2020
Clayton Kershaw (Dodgers)
- Bounce back 2020 season (3.05 xFIP, 3.11 xERA) after a relatively tougher 2019 campaign (3.50 xFIP, 3.68 xERA)
- 24.4% strikeout minus walk rate in 2020 was his best mark since 2017 (25.3%)
- Regained some lost velocity (increasing back from 90.5 mph to 91.6 mph) after the 2017 drop-off (93 mph), and maintained elite spin rate on his fastball (91st percentile)
- Remains primarily a fastball/slider pitcher, throwing the combination more than 80% of the time while mixing in a slow, looping curveball (average 74.1 mph) every fifth pitch.
- Remains effective against both righties (career .258 wOBA) and lefties (.251).
Clayton Kershaw, Filthy Curveball/Slider Sequence. pic.twitter.com/0NtLPUtzhd
— Rob Friedman (@PitchingNinja) October 16, 2020
The Bullpens
In 2020, the Rays’ bullpen ranked seventh in FIP (3.94), 3rd in xFIP (3.94), and 5th in K-BB% (17.4%). By the same metrics, the Dodgers ranked second (3.45), second (3.88), and fourth (17.2%).
Both teams are capable of attacking you in a variety of ways, with more unique arm angles than any other staff in their respective leagues:
Wrote about how the Rays have endless looks to throw at you .. tried, semi-successfully, to quantify it .. but mostly look at this hilarious image.
(And then read the article –> https://t.co/iFBeEPQbgZ) pic.twitter.com/S8SfLsWdeU
— Mike Petriello (@mike_petriello) October 16, 2020
The Rays can present 14 unique arm angles over the course of a series, while the Dodgers can throw up to 10.
Here is what the Astros saw in Game 1 of the ALCS, for example:
In Game 1 of the ALCS, the Rays used 5 pitchers to give the Astros 5 wildly different looks. Meet Dr. Octopus, if only Otto Octavius also had nasty stuff. (Thanks to @AlexFast8 for the cool video.) pic.twitter.com/5imvCT6KQm
— Mike Petriello (@mike_petriello) October 13, 2020
Perhaps having a diversity of arm angles is the new way to gain that extra 2% win probability.
Bullpen stats can be misleading — the Rays often use Ryan Yarbrough as a reliever, technically, even though he throws starter-level winnings. And as you have likely noticed, the Dodgers won't hesitate to use Dustin May or Julio Urias in relief in order to lock down a game.
With regards to Game 1, the Dodgers will likely want to keep both Blake Treinen and Brusdar Graterol in reserve. Treinen tossed five innings (52 pitches) over the final three games of the NLCS, while Graterol appeared three times in the final four games (40 pitches).
The Rays bullpen will benefit from getting an extra day of rest following the ALCS, with additional days of rest during the series to recover their best arms.
Check out our new MLB PRO Report, where we highlight key factors that provide betting edges — like large wagers, historically profitable betting systems, model projections and expert picks — that when combined with sharp money can powerfully detail the smartest bets on a given slate.
Fielding
Over the past five years, both the Dodgers and Rays have finished in the top five for Defensive Runs Saved in each season, with either team leading the league once (2017 Rays, 2019 Dodgers).
In 2020, the Dodgers have recorded 29 DRS (second) and the Rays have 22 (sixth), and both teams have continued to flash the leather in the postseason:
Mark Simon called this, "The World Series of Defensive Excellence," and it's particularly true in the outfield.
Since the start of the 2019 season, Cody Bellinger (+28 DRS), Mookie Betts (+26), and Kevin Kiermaier (+23) are three of the four best defensive outfielders in baseball.
Kiermaier has 122 DRS in center field since 2003, the most of any player at that position. Betts has saved 104 runs since 2016, more than any player in the past five years.
But it doesn't stop there. Hunter Renfroe (+22) ranks sixth, and Joc Pederson (+11), Chris Taylor (+8), Manuel Margot (+8), and Brett Phillips (+8) all rank in the Top 40.
Willy Adames (+14) has made big strides over the past two seasons and is now one of the smoother defensive shortstops in baseball, and Kike Hernandez (+24 DRS) is one of the most versatile playmakers in the sport — with average or better defense at every position on the diamond outside of catcher and first base.
You may have also noticed the stout defense of Joey Wendle, both at second and third base, or the excellent stretching and scooping by Ji-Man Choi at first for Tampa Bay. Even as they continually move guys to different spots, the Rays maintain a stout defensive front.
Projected Lineups
Data via FantasyLabs
Based upon his Instagram post, there are some rumors that No. 1 MLB prospect Wander Franco could make his debut in the World Series.
The Rays offense, outside of demi-god Randy Arozarena, has struggled a bit in these playoffs, and perhaps they are looking to inject some youthful life into their lineup, or bench, in order to pick up four more wins and grab a title away form a richer and slightly better club.
Long-term, Franco might be a better fit at second or third base rather than shortstop, but he has an incredible hit tool (70 grade) and has recorded more walks (83) than strikeouts (54) across his first two pro seasons while compiling a .336 average with a lighting quick bat:
Wander Franco is only 18 and has some of the fastest hands you’ll see 👀���� pic.twitter.com/LVj7hhFT9D
— Baseball Bros (@BaseballBros) November 23, 2019
Stadium, Umpire, and Weather Report
Data via Sports Insights
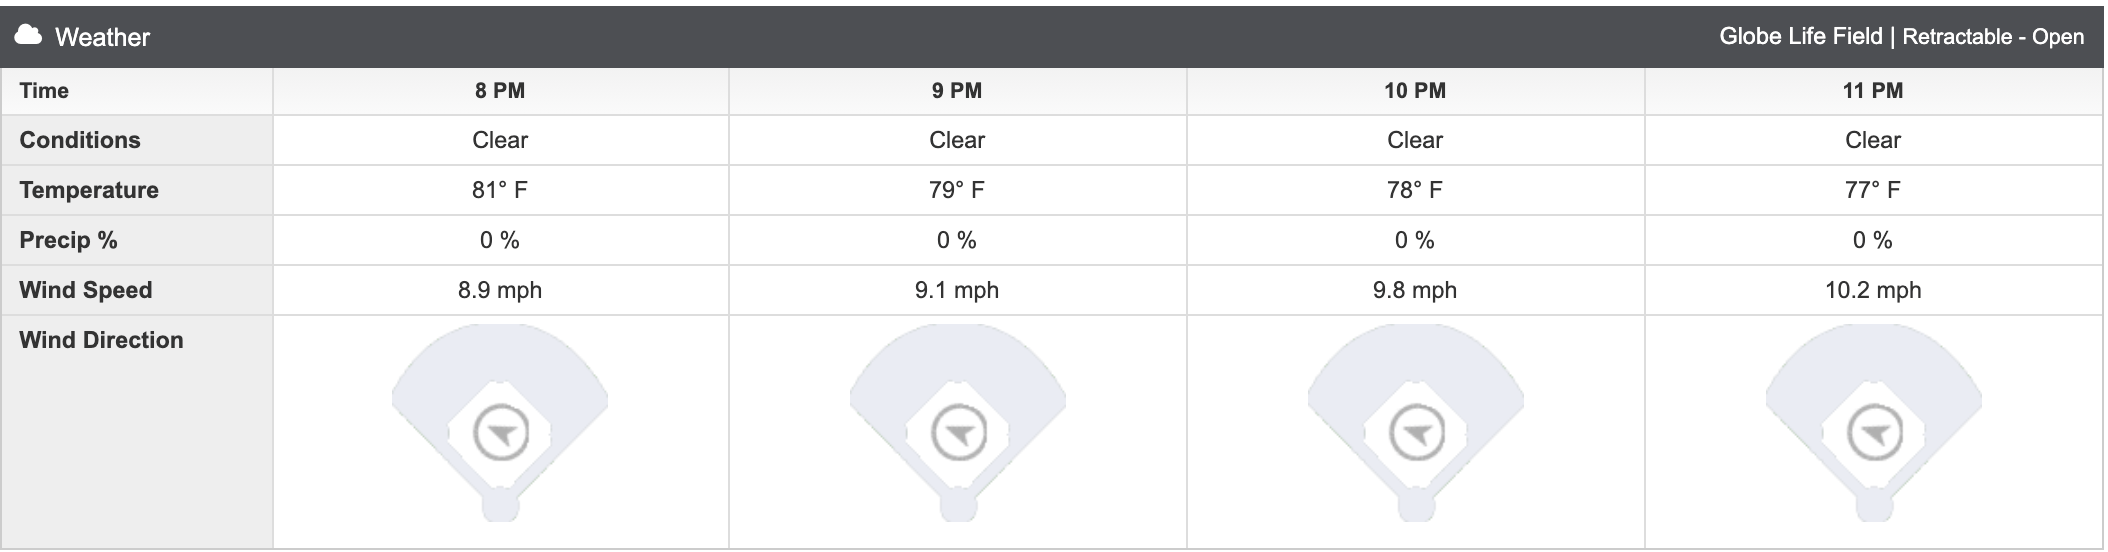
All the ballpark data we have for the newly-opened Globe Life Park is based on a very small number of games (40), but it’s nevertheless interesting.
The Rangers played 30 regular-season games at Globe Life Park, and the roof was closed in 22 (73%) of those contests.
Unders went 11-9-2 (55%) with the roof closed with an average margin of victory of 0.84 runs. But with a record of 2-5-1 with the roof open, it lost by an average margin of 3.37 runs.
The roof has remained open in Arlington throughout the playoffs, and unders have gone 4-6, putting the over at 11-6-1 (64.7%), when the roof stays open in Arlington.
There are also some notable trends regarding umpire Laz Diaz as well. Let's get the small sample, yet still hilarious stat out of the way:
W W W W W W W W W W W W
MLB favorites are 12-0 with Laz Diaz behind the plate this season…
Guess who just got announced as home plate ump for Game 1 of the World Series? pic.twitter.com/SPKZw8U58w
— The Action Network (@ActionNetworkHQ) October 19, 2020
Now, you could easily write that one-off, given the limited number of games, but Laz Diaz really likes his favorite. More so than any other MLB umpire:
Historically, favorites have won at a 62% clip with Diaz behind the dish, by an average margin of 0.88 runs.
He has a neutral split with regards to totals, however, standing 238-237-23 (50.1%) relative to the Over.
Projected Odds & World Series Bets
I project the Rays as a 41% underdog in the World Series, but their implied chances to defeat the Dodgers in the betting market are much lower.
I’m comfortable betting Tampa Bay down to +163 (implied 38%) to win the series — a 3% edge relative to my projection. There are some more fun, though slightly less valuable ways to play Tampa Bay in this series, too.
Here is how the Rays’ series win distribution breaks down:
- Win 4-0: 4% (implied odds of +2400)
- Win 4-1: 10% (implied +900)
- Win 4-2: 13% (implied +669)
- Win 4-3: 14% (implied +614)
- Lose 4-3: 17% (implied +488)
I played some small dart throws on Rays in 4 (+2500 or better) and Rays in 5 (+1000 or better).
I also like their series spread of +1.5 games (up to -120). As you can see above, I give the Rays a 58% chance (implied odds of -138) of either winning the series, or losing in seven games, so +1.5 games bet at -120 (implied 54.5%) reflects a 3.5% edge relative to that projection.
The Rays also show actionable value in Game 1. Here are my projected odds:
As a result, I don't see value on either the F5 or full game total, but I do see value on both the F5 and full game moneyline, and I would play the Rays F5 moneyline down to +135, and the Rays moneyline to +133 — with either bet representing a minimum 3.5% edge relative to my projection.
The Picks
- Rays F5 Moneyline (1 unit, play to +135)
- Rays Moneyline (1u, play to +133)
- Rays Series Price (1u, play to +165)
- Rays +1.5 Games (1u, play to -120)
- Rays in 5 (0.25u, play to +1000)
- Rays in 4 (0.25u, play to +2500)


