One of the many factors I weigh when creating and adjusting my NFL Power Ratings is luck.
Should Team A really have been a 10-win team last season, or did they catch a few breaks? Was Team B really as bad as their 4-12 record indicates, or did they face a particularly difficult schedule of opponents?
That's the basis for my NFL Luck Ratings — identifying all the ways in which a team experienced good or bad fortune the previous season so we can better evaluate them for the next.
There are nine metrics I weigh for these ratings, including a team's record in one-score games and time they led. I outline those nine metrics in detail below, but for now, let's run through how to draw conclusions (if any) based on the ratings.
First, it's important to note that these ratings are simply a way to measure in how many of the nine metrics a team qualified as either lucky or unlucky.
Each metric is worth one point. If a team finished within the top 10 of a given metric in 2019, they were docked one point (-1). If they finished in the bottom 10, they earned one point (+1). And if they finished in the middle 12, it did not impact their rating either way (0).
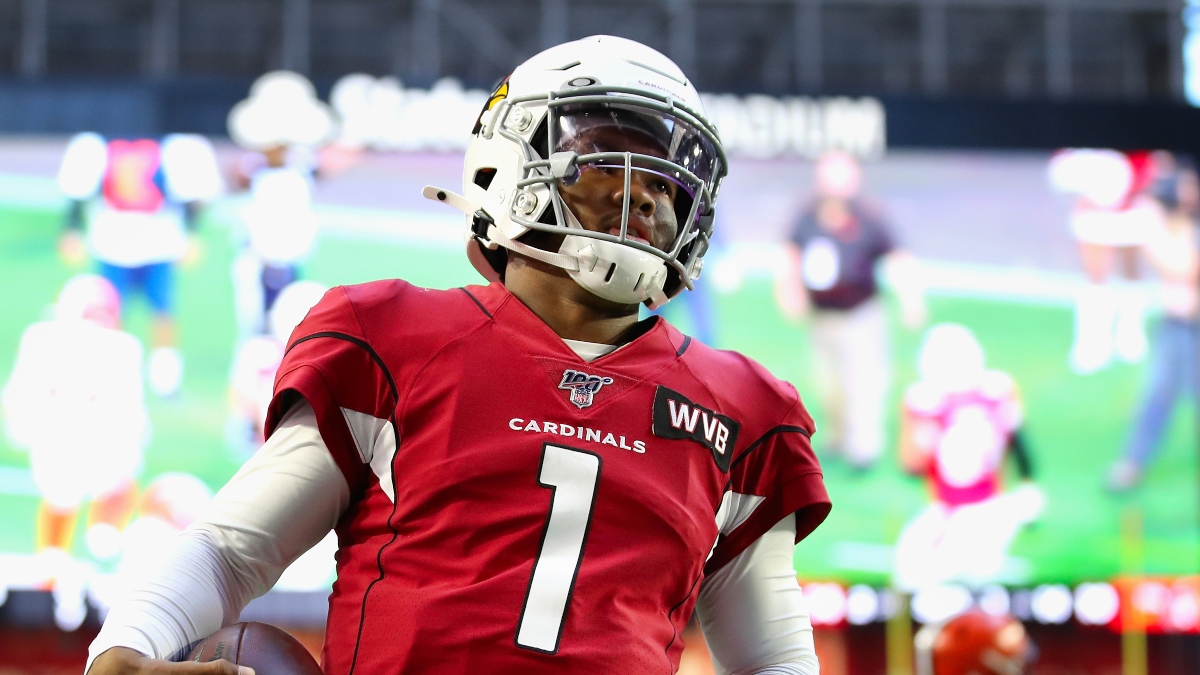
So, for example, the Cardinals finished within the top 10 of seven of the nine metrics to earn them a +7 rating. The Saints, by contrast, finished in the bottom 10 of six of the nine metrics to earn them a -6 rating.
The takeaway? Arizona was notably lucky in 2019. New Orleans was not.
There is no single metric that indicates whether a team played much better or worse than their previous-season record suggests, and therefore we cannot reply on only one as a predictor of future fortune. However, if a team experienced bad or good luck in several of these nine metrics, it’s more reasonable to assume that the public perception of that team may be skewed positively or negatively based on underlying factors that they have less control over.
Basically, I'm more likely to back or fade teams that ranked notably high or low in my NFL Luck Ratings.
Of course, these Luck Ratings are only one component of my NFL Power Ratings, which I use to project spreads for games and more. The primary basis for my Power Ratings are player ratings, which is how I evaluate how much a player is worth to the spread. But having additional layers to my Power Ratings, such as these Luck Ratings, helps me identify potential edges that sportsbooks may not be factoring into their odds.
Now without further ado, here's the inaugural edition of my NFL Luck Ratings:
NFL Luck Ratings
The scale of these ratings is +9 to -9. Positive ratings indicate good luck while negative ratings indicate bad luck.
| Team | Rating |
|---|---|
| Arizona Cardinals | +7 |
| Cincinnati Bengals | +7 |
| Detroit Lions | +7 |
| Los Angeles Chargers | +6 |
| Cleveland Browns | +3 |
| Atlanta Falcons | +2 |
| Dallas Cowboys | +2 |
| Minnesota Vikings | +2 |
| Indianapolis Colts | +2 |
| Chicago Bears | 1 |
| Washington Redskins | 1 |
| Kansas City Chiefs | 1 |
| Tampa Bay Buccaneers | 1 |
| New England Patriots | 0 |
| Miami Dolphins | 0 |
| Carolina Panthers | 0 |
| New York Giants | 0 |
| Jacksonville Jaguars | -1 |
| New York Jets | -1 |
| Las Vegas Raiders | -1 |
| Philadelphia Eagles | -2 |
| Los Angeles Rams | -2 |
| Denver Broncos | -2 |
| Seattle Seahawks | -3 |
| Houston Texans | -3 |
| Tennessee Titans | -3 |
| Green Bay Packers | -3 |
| Pittsburgh Steelers | -3 |
| Baltimore Ravens | -4 |
| Buffalo Bills | -5 |
| San Francisco 49ers | -5 |
| New Orleans Saints | -6 |
NFL Luck Ratings Metrics
Strength of Schedule Difference: The difference between their 2019 strength of schedule (SoS) based on Football Outsiders' average DVOA of opponents and my 2020 SoS rankings according to my power ratings. A big difference in SoS can play a role in how we perceive whether a team improved or declined based on the previous season. This attempts to get ahead of that.
Estimated Wins vs. Actual Wins: This is straight forward — the difference in Football Outsiders' expected wins and how many a team actually won in 2019.
Pythagorean Wins vs. Actual Wins: Including Football Outsiders' and Pythagorean wins is bit redundant, but combining the two offers a ton of insight into how well a team played independent of their record as both metrics attempt to remove some of the luck that influences a team’s record.
Record in close games: I compared a team's record in games decided by 7 or fewer points to how they would have fared had they gone .500 in those games. Whether a team had a winning or losing record in such games, we should expect teams to regress toward .500 in this metric the following year.
Football Outsiders' Adjusted Games Lost: This measures how many games a team missed due to injury (weighted by position). It’s a way to indicate which teams may have suffered bad injury luck or were fortunate.
Fumble Luck: This analyzes which teams benefited the most from recovered fumble luck — on offense and defense. The idea is that no team should be above or below average at recovering fumbles, so any that had a notably high or low amount of fumble recoveries will likely regress to a league-average recovery rate the following season. Turnovers are a huge underlying factor in a team’s final W-L record and identifying which teams will see their luck change in this stat is another way to get a better sense for how well a team truly played last season.
Sack Luck: I measured how many sacks a team would have been expected to get based on the number of pressures. Pressure rate is a very predictive metric when it comes to sack rate. Sometimes luck can be involved in converting a pressure into a sack — obviously there is going to be some skill involved in taking down a QB, too — but I look into which teams may see a shift in luck in this metric. Sacks can have a pretty big impact on an in-game win probability, which is why I've factored this in.
Turnover Margin: This metric can be a bit misleading. Yes, certain teams will have an inherent edge when it comes to turnover margin — whether they have a turnover-prone or -average QB, the offense is designed to be aggressive or conservative, or the defensive style is aggressive or conservative are all factors that play into it. In general, though, teams that finish near the top or bottom of this metric likely encountered good or bad luck to a certain degree.
Time Led % vs. Record: I compared the percentage of time a team led to their end-of-season record, which indicate which teams may have benefited from late-game heroics or disappointments.


