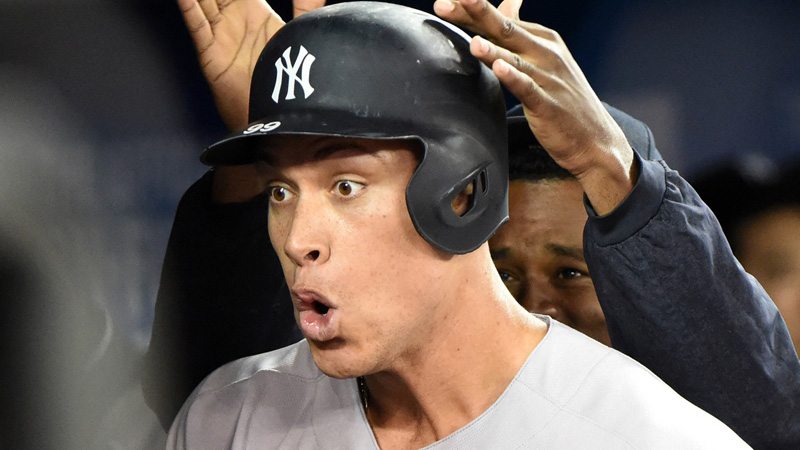
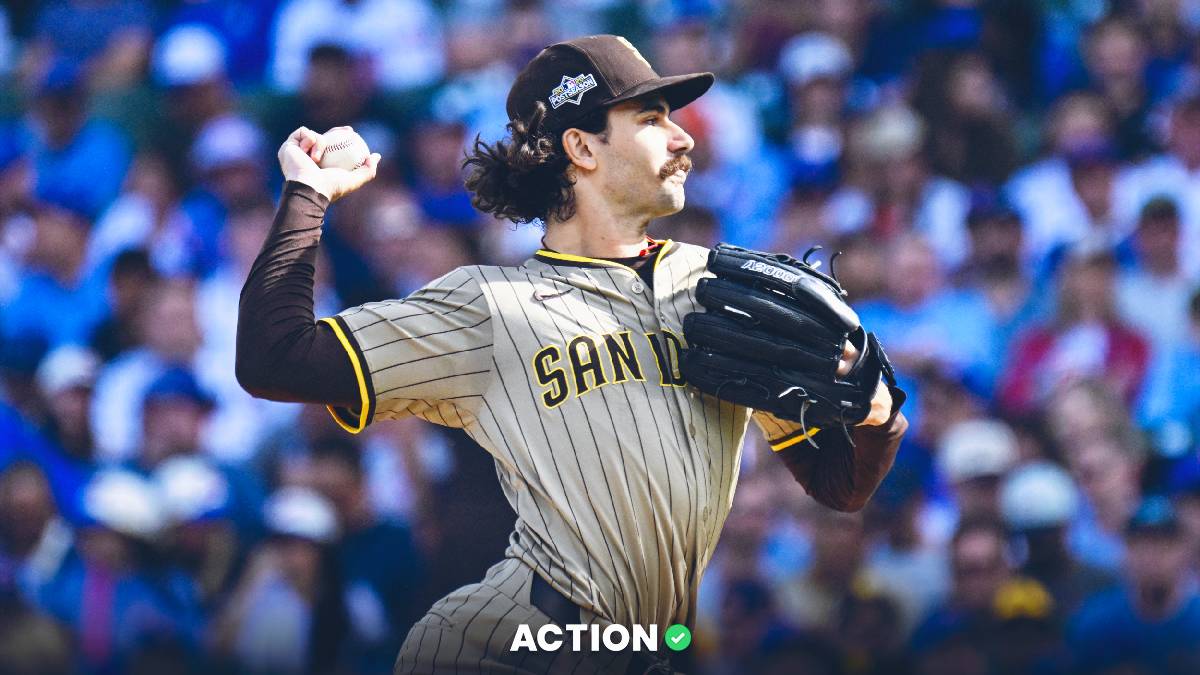
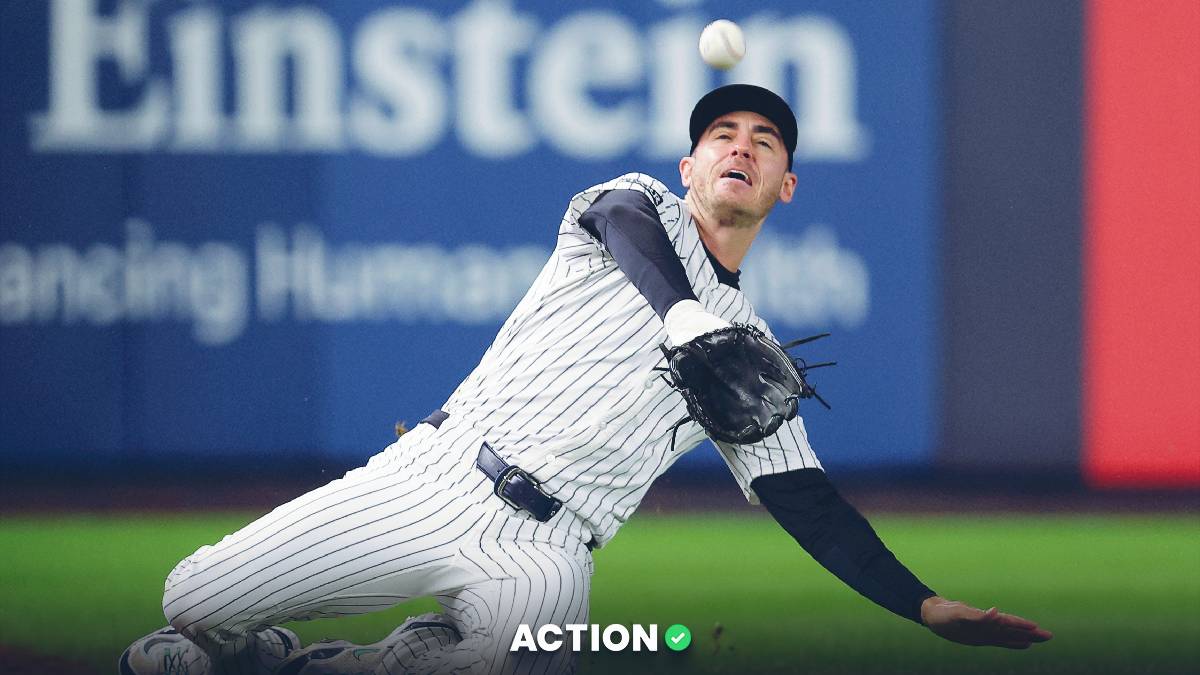
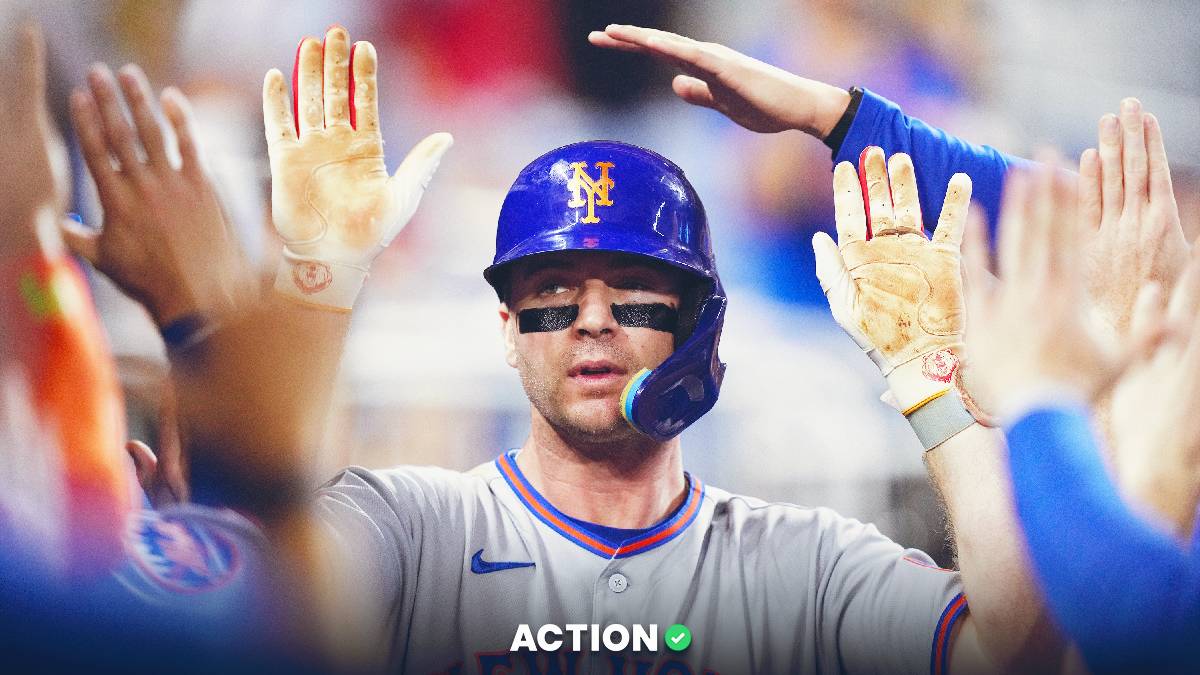
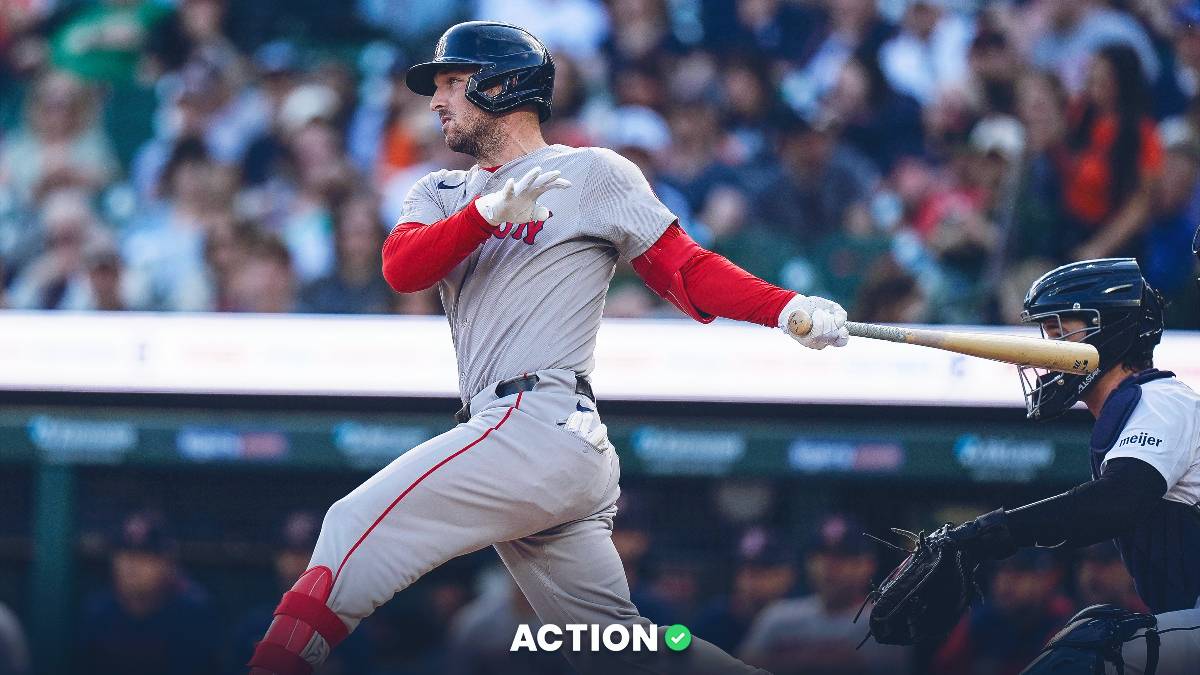
- Aaron Judge is among a handful of star players who have declined participating in this year's Home Run Derby.
- Judge posted some absolutely atrocious numbers in the weeks following last year's break and data suggests the new timed format may be more detrimental to hitters than the old format.
- Most All-Stars, Derby participants or not, have had trouble living up to their first half performances in the weeks following the break.
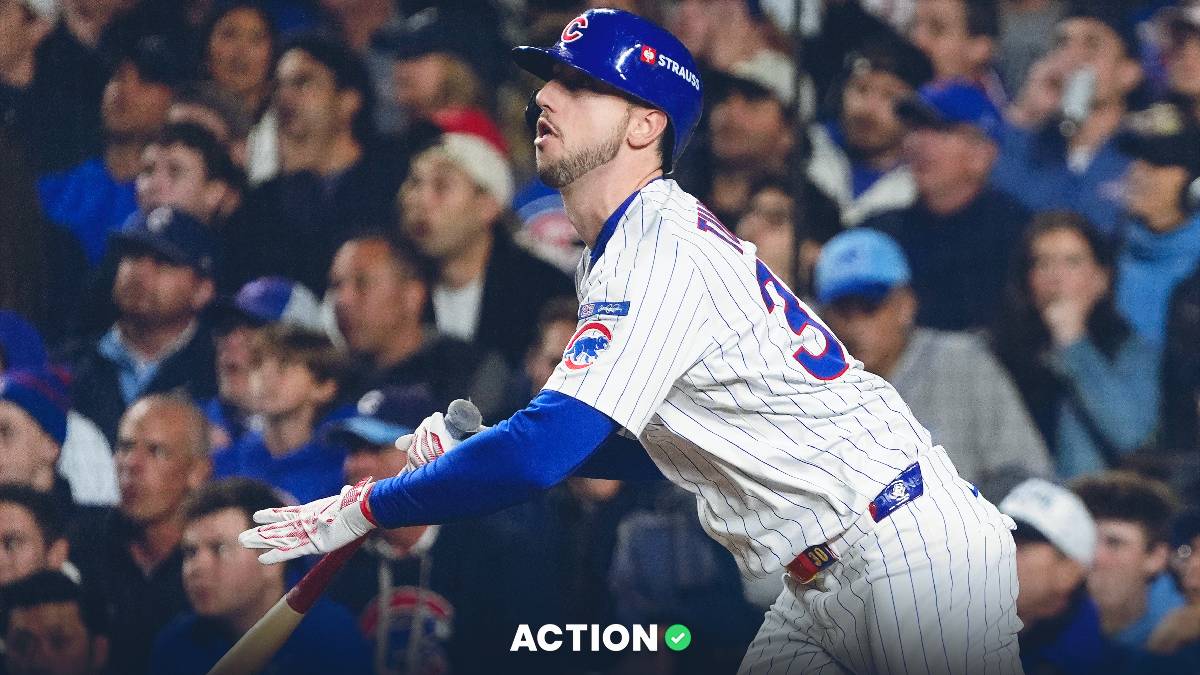
Last season, Aaron Judge put on an absolute show in the home run derby, hitting long 500-foot dongs, going oppo like taco and ultimately, hitting enough homers in each of his three matchups to win the whole thing.
Unfortunately, Judge will not be defending his title this year. His teammate Giancarlo Stanton will also sit it out, putting frowns on children's (and adults') faces all over the country.
Neither cited performance as a reason they wouldn't be attending, but I think we can all agree that was a factor in Judge's decision.
- Judge's first half last year: .329/.448/.691, 30 homers, 197 wRC+
- Judge in first week after AS Break: .138/.286/.138, 0 homers, 9 wRC+
(Note: wRC+ is Weighted Runs Created Plus, a fancy metric that quantifies a player's total offensive value. A 100 wRC+ is league average, and as Fangraphs says, "a 125 wRC+ means a player created 25% more runs than a league average hitter would have in the same number of plate appearances.")
So, back to Judge: He went from being almost twice as productive as an average hitter to being, well …

With that in mind, I wanted to find out whether players are actually worse after competing in the home run derby. Are the eight players competing this year destined for a slow start to the second half, or is there nothing to worry about?
Get ready for a serious data dump. I've spent the past week manually pulling stats from Fangraphs to see how players in the Derby have done in the first half of the season and then compared it to their performance in the first calendar week following the break, first two calendar weeks after, first month and entire second half.
I honestly doubt that the Derby affects any performance more than two weeks after the break, but I included the numbers anyway for argument's sake.
The current timed format has been going on for three years, so I recorded data for three years of the old format, too, to see if there were any notable differences. This new timed format presents a rapid pace that doesn't allow hitters to take their time or wait for good pitches. They've been taking more swings and hitting more homers, which is fun for the fans, but does it come at a cost?
Well, looky what we have here. There does appear to be a notable difference in recent seasons with the new timed format. On average, the 2015-17 group had a wRC+ that was 24 points worse than it was over the first half after one week, and 34 points worse after two weeks. Compare this to just three and 10 points for the 2012-14 group and you can see where there may be some cause for concern.
But wait … we've only just begun. About halfway through conducting this research I realized, "Oh fudge, I need to compare the Derby hitters to non-Derby hitters." Only I didn't say fudge.

I didn't pull every hitter's data who didn't compete in the Derby. Instead, I chose guys who fit the following criteria for the control group.
- Competed in one of the aforementioned home run derbies.
- Was selected to and attended an All-Star Game and did not compete in the derby between 2010 and 2017.
There were 31 such matches, giving us a relatively similar sample to compare to years in which they were in the derby. Have to see if this is spurious or non-spurious. You know what I'm talking about, sociology majors.
This also sheds some light on the entire situation. This group was actually a bit worse than the Derby group. To further prove that, I've also counted the number of players whose second-half numbers were better than the first-half numbers for each of the time frames.
wRC+ is what I felt was the best all-around hitting stat for this experiment, but it isn't perfect — especially in small samples. In this entire experiment, the one-week samples ranged from a wRC+ of 9 to 352, which can both skew the results.
These All-Stars who haven't participated in the Derby aren't very good at all, huh? Just about a third of them were able to better their first-half numbers in the first couple of weeks after the break.
Note that the best group of the entire bunch is the 2014 Home Run Derby group, which was perhaps the worst Derby of them all. That is the one year in which batters had seven outs instead of 10 and very few home runs were hit as a result. Ten hitters combined for 78 homers that year, whereas 2015 produced 159 homers from eight hitters once they switched to the new format. In the past two years, there have been nearly 400 homers combined.
The biggest takeaway from these tables, in my opinion, is that just five of 24 players in the 2015-17 group were able to improve their wRC+ in the two weeks following the break. Twelve of the 24 produced a wRC+ below 100 (below league average) over that span.
Furthermore, just one of six players to make the finals in the timed format have produced a wRC+ better than their first half in the following two weeks, with four producing below league average marks.
Based on this evidence, the early verdict is that this new format may increase the likelihood that a player has trouble after the break. It would be nice to have 10 or 20 years of this format under our belt so we could more comfortably state whether or not there is a direct link between participating (and andvancing) in the Home Run Derby and poor numbers to begin the second half of the season, but we'll just half to wait and see.
My takeaways
- Considering the relatively small sample sizes, it's tough to tell what is real and what is just noise.
- All groups have trouble repeating their elevated first-half stat lines that got them to the Derby/All-Star Game in the first place.
- The new timed format seemingly exhausts players even more and appears to affect stats directly after the break more so than the old out-based format.
- The players who make it deeper into the timed rounds have had some especially poor performances in the following week or two after the break, which makes sense if you consider the additional wear and tear.


