


This article is part of a series that aims to re-think how we look at the NHL Draft.
The previous posts have looked at NHL draft market inefficiencies. These are various statistics that predict success outside of the draft position.
In this article, we are going to look at the Relative Age Effect (RAE) in hockey. We will show players born in earlier months tend to do particularly poorly relative to their draft position, despite making up a disproportionate amount of selections.
Defining Expectations
To show that relatively old players have underperformed their draft position, we need a way to estimate the expected value of each prospect based on their draft position. This has been done in a previous article in this series which outlines the process behind this draft pick model (you can find that article here).
Note: We will be using Evolving Hockey’s Goals Above Replacement (GAR) metric for this article. It’s a catch-all metric that measures how much a player contributes to their team’s performance. Higher GAR values represent more productive players.
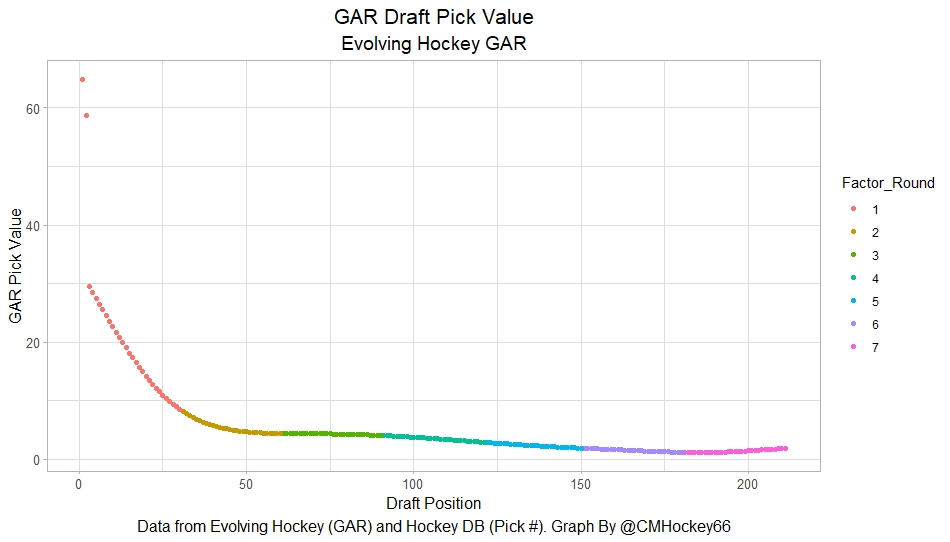
The pick-value chart above gives us an expected value for each player based on their draft slot. Now, all we do is take the player’s cumulative GAR in their first seven seasons and subtract off expectations and we have their GAR relative to expected.
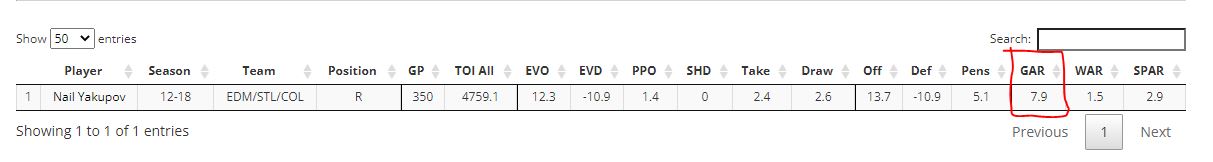
For example, let’s look at Nail Yakupov. Yakupov was picked No. 1 overall in the 2012 NHL Draft by the Edmonton Oilers. As a result, his expected GAR from the chart is about 65. Unfortunately, he only produced about 8 goals above replacement in the seven seasons after 2012.
As a result, Yakupov’s value above expected is -57 (8-65). In other words, He dramatically underperformed his draft position. Yakupov is known as a generational draft bust, so a big negative number for him checks out.
Now, all we have to do is apply this formula to every player drafted from 2007 to 2014, and start looking to see if any statistics can help us predict value above/below expectations.
The NHL draft market will have had all these statistics available to them, so if they are correlated with values above expected, it means the market was failing to account for them properly.
What is the RAE?
First, let's start with a short description of the RAE.
In the context of hockey, RAE was popularized in Malcolm Gladwell's book Outliers. In the book, Gladwell mentioned that a disproportionate number of professional athletes are born in the early months of the year. A quick visual will show how strong the RAE is in hockey.
Here is the percentage of prospects born in each birth month from 2007-2014:
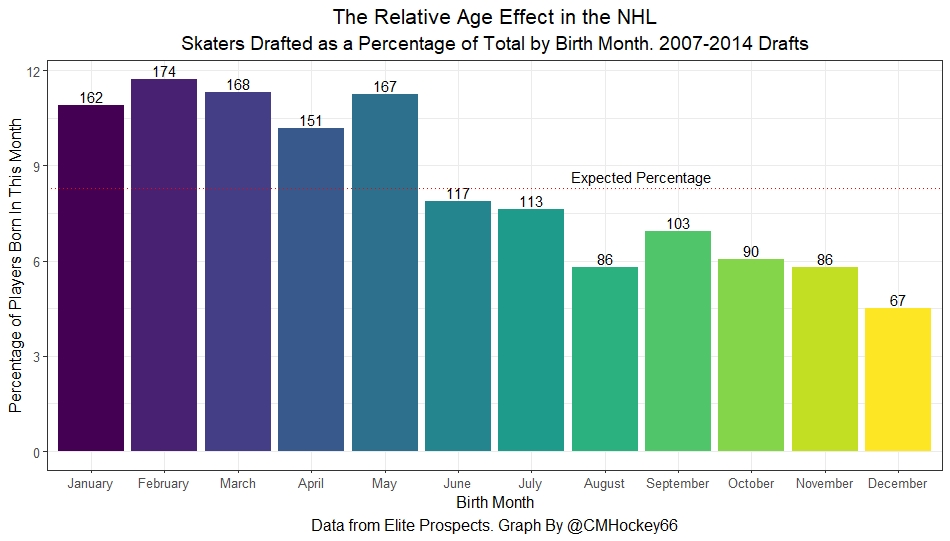
Here we can see a clear trend. About twice as many prospects that were drafted were born in the first half of the year compared to the second half of the year. The NHL is not alone in this trend, as RAE shows up in every sport due to early specialization.
At a young age, children who are born in January are a meaningful amount older compared to their peers who are technically the same age but born later in the year. As a result, kids who were born in the early part of the year tend to rise up through the ranks of youth sports. Thus, RAE is perhaps more of a youth hockey problem more than an NHL issue. Professional teams are just responding to the downstream effect of RAE.
That said, we will see that NHL teams are likely overvaluing these relatively old players.
Age as a Bias
To show that relative ages represent a bias in NHL decision-making, let's look at the average value above expected when grouped by birth month.
If NHL teams have been properly accounting for relative ages, there should be no meaningful relationship between birth month and value above expected.
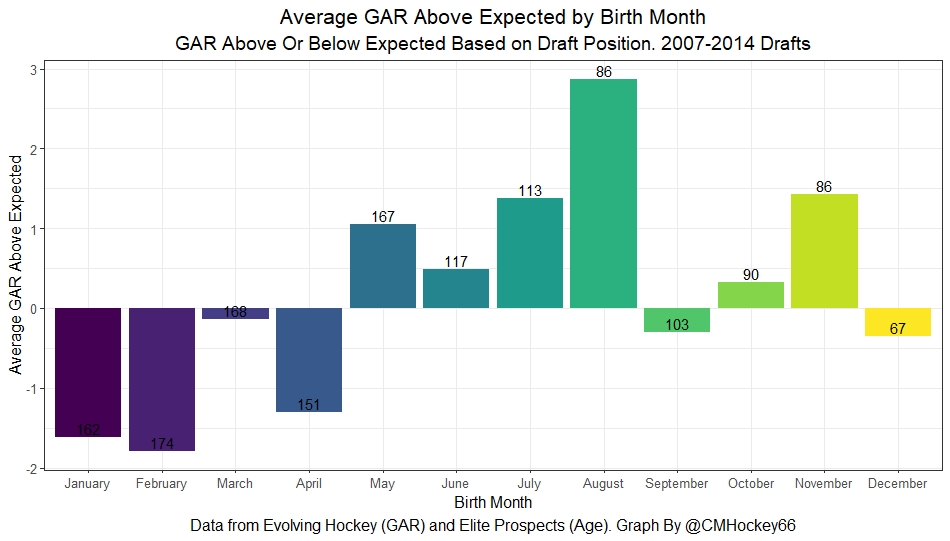
While the trend is not linear here, there is a clear relationship in the early months. From January to April, each cohort has underperformed their expectations, on average. This is a strong signal that NHL teams are likely drafting far too many relatively old players, and not enough players born later in the year. More concisely, NHL teams overvalue relatively old players.
A problem with this analysis is that the samples can be skewed by outliers. One big bust could massively skew the results above. To solve this problem, we will look at success rates too.
Here each prospect is given a 0 or a 1. They receive a 1 if they produce more GAR than expected based on their draft position (think second-round pick Nikita Kucherov), or they get a 0 if they produce less GAR than expected based on expected (think Yakupov).
When looking at success rates, we see a similar story. Again if teams properly accounted for relative ages, success rates should be constant across birth months because the draft position has been accounted for:
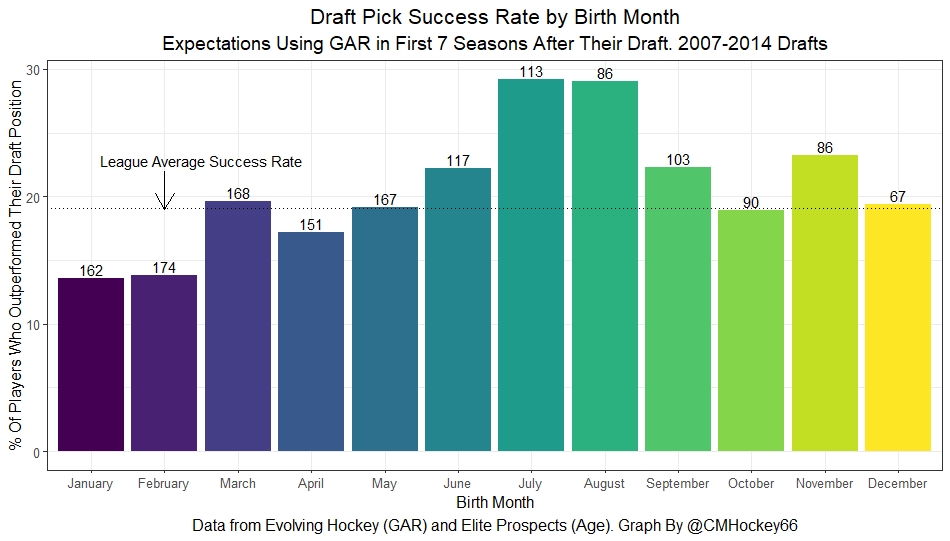
There are only two months that have significantly lower success rates than the league average, January and February. After that, the success rates begin to creep up before exploding.
This is further evidence that the NHL is probably drafting too many prospects who were born early in the year. Additionally, they are overvaluing the ones these relatively old prospects, generally selecting them too high in the draft so they are not living up to their expectations.
It's especially interesting that the most successful cohort of prospects using either measure was born right before September. The NHL Draft's age cutoff is in mid-September, so not all players born within a year get drafted in the same class, only those born from January to mid-September.
Thus, the youngest players in each draft are born from July to September, and this has been the most successful range both times. This likely explains the nonlinearity.
Within a given birth year, July-September born prospects are the youngest players who must compete directly against the January and February born prospects, while September to December born prospects won't be drafted till the next season.
Conclusion
What is especially striking about my findings is the dataset I used. To measure NHL outcomes, I focused on GAR in the first seven seasons after each player was drafted.
If anything, this should bias my findings toward more NHL-ready players because relatively older players are slightly closer to their physical peaks, they should be more NHL-ready when drafted, on average.
Nevertheless, the relative age bias is evident in the National Hockey League. The NHL draft market failed to properly account for relative ages and the league generally selected relatively old players too high, while taking the youngest players too low.


