


The gloves are off, and the numbers are in. The 2024–25 NHL season saw a surge in high-intensity fights across the league, with some players emerging as enforcers and some teams making their physical presence impossible to ignore. The Action Network analyzed every fight recorded throughout the season to determine which players and teams truly owned the ice.
Using detailed data from HockeyFights.com, the data experts at The Action Network ranked players and teams based on a weighted fight score that factors in both win rate and fight volume.
Here are the key insights.
Top NHL Fighters of the 2024–25 Season
These players didn’t just drop the gloves — they made it count. Rankings are based on an adjusted fight score that fairly reflects both how often a player fought and how often they won.
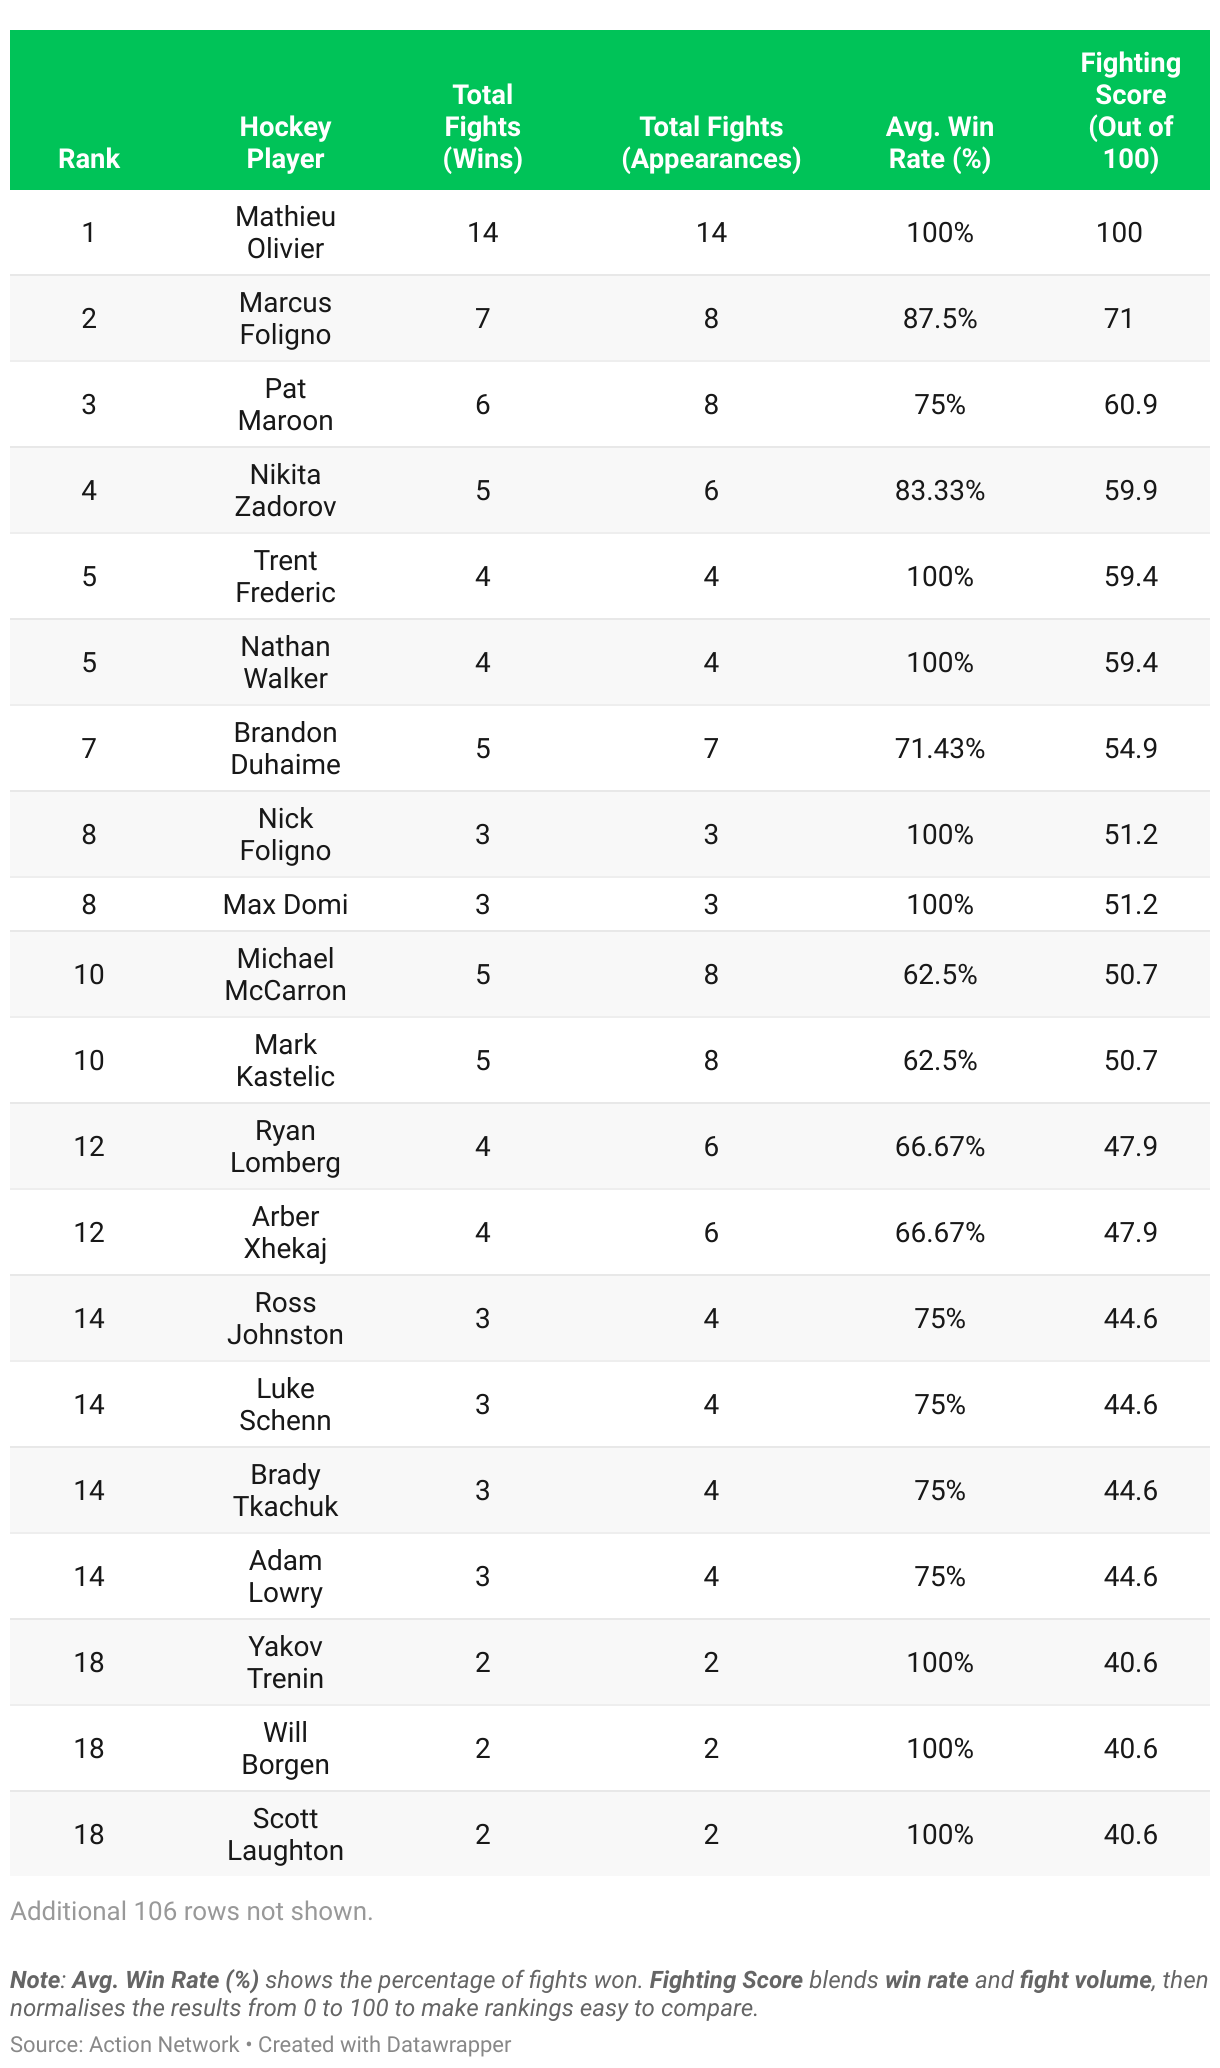
Notable Highlights from the Top 10 Fighters
- Mathieu Olivier was untouchable this season, going 14-0 in fights with a perfect 100% win rate and earning a flawless Fighting Score of 100.
- Marcus Foligno came in second with a strong 87.5% win rate across 8 fights, proving both volume and efficiency.
- Fighters like Trent Frederic, Nathan Walker, Nick Foligno, and Max Domi all maintained a 100% win rate, showing that fewer fights didn’t mean less dominance.
- Nikita Zadorov ranked fourth overall with an 83.3% win rate in 6 fights — the third-highest in the top 10 — just behind Pat Maroon, who edged him out with a slightly higher fight score of 60.85.
- Michael McCarron and Mark Kastelic round out the top 10 with solid records of 5 wins each from 8 fights, showing strong consistency.
Top NHL Teams in the Fight Game (2024–25 Season)
Which NHL teams brought the most fire to the fight game this season? Rankings are based on aggregated player data: total wins, total fight appearances, and average team win rate.
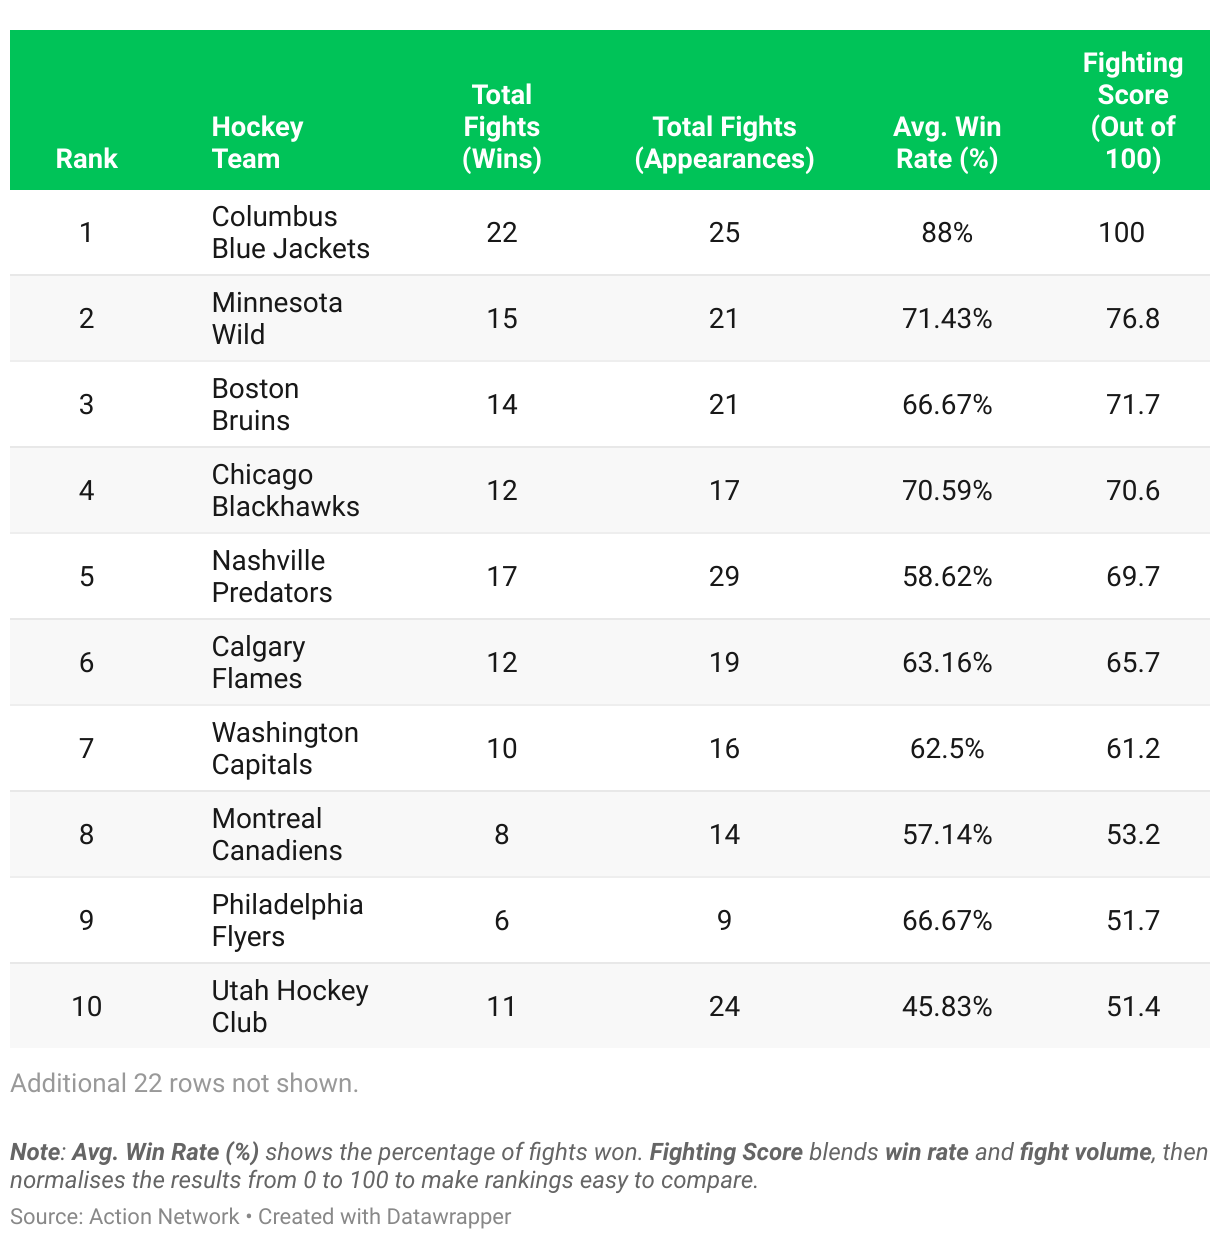
Notable Highlights from the Top 10 Teams
- Columbus Blue Jackets dominated the rankings with the highest win rate (88%), a perfect Fighting Score of 100, and 22 wins from 25 total fights — making them the toughest team on the ice this season.
- Minnesota Wild and Boston Bruins both cracked the top 3 with over 20 appearances each and win rates above 66%, showing consistency and volume.
- Chicago Blackhawks delivered a high-efficiency season, winning 70.59% of their 17 fights.
- Nashville Predators fought more than any other team in the top 5 (29 total appearances), highlighting their physical style of play.
- Philadelphia Flyers and Washington Capitals made the most of limited opportunities, both achieving strong win rates despite fewer overall appearances.
Love this kind of breakdown? Whether you're into heavyweight clashes or tracking win rates across the league, this kind of deep-dive appeals to NHL superfans and sharp bettors alike. If you enjoy the data behind the drama, check out the latest Fanatics Sportsbook Promo, DraftKings Promo Code, and bet365 Bonus Code.
Methodology
Source
All data was sourced from HockeyFights.com and includes all recorded fights from the 2024–25 NHL season.
1. Player Rankings
To rank players, we first calculated the average win rate based on each individual's total fight wins and total appearances. We then applied a log-based weighting formula behind the scenes to ensure fair comparisons across all players:
Adjusted Fighting Score = Win Rate × log(Total Fights + 1)
The +1 adjustment ensures fairness for fighters with limited appearances, allowing undefeated players with just one fight to still receive a meaningful score. This approach balances both efficiency and volume across all participants.
To make the results more comparable, each Adjusted Fight Score was then normalized on a scale from 0 to 100, where the top-performing fighter received a score of 100:
Player Fighting Score (Out of 100) = (Adjusted Score ÷ Highest Adjusted Score) × 100
This standardization allows for clear comparisons across the full list, regardless of total fight volume.
2. Team Rankings
For team rankings, we aggregated player data to calculate each team's total fight wins, total fight appearances, and average win rate. Similar to player ranking, we then applied the following log-based weighting formula in the background:
Adjusted Fighting Score = Average Win Rate × log(Total Team Fights)
This formula balances both consistency (win rate) and impact (fight volume) — rewarding teams that fought frequently and performed well, while still giving credit to teams with fewer appearances but strong win percentages.
Each team’s score was then normalized on a 0–100 scale, with the top-performing team receiving a score of 100:
Team Fighting Score (Out of 100) = (Team Score ÷ Highest Team Score) × 100
This allows for direct and fair comparisons across all teams, regardless of how many fights they were involved in.


