


This article is part of a series that aims to re-think how we look at the NHL Draft.
We will be looking at various statistics which have predicted which NHL prospects have over/underperformed their draft position.
The first blindspot we will be looking at is scoring rates. We will be using NHLe to find out if NHL teams have properly accounted for prospects scoring rates.
Defining Expectations
To find which players have over/underperformed their draft position, we need a way to estimate the expected value of each prospect based on their draft position. This has been done in a previous article in this series which outlines the process behind this draft pick model (you can find that article here).
Note: We will be using Evolving Hockey's Goals Above Replacement (GAR) metric for this article. It's a catch-all metric that measures how much a player contributes to their team's performance. Higher GAR values represent more productive players.
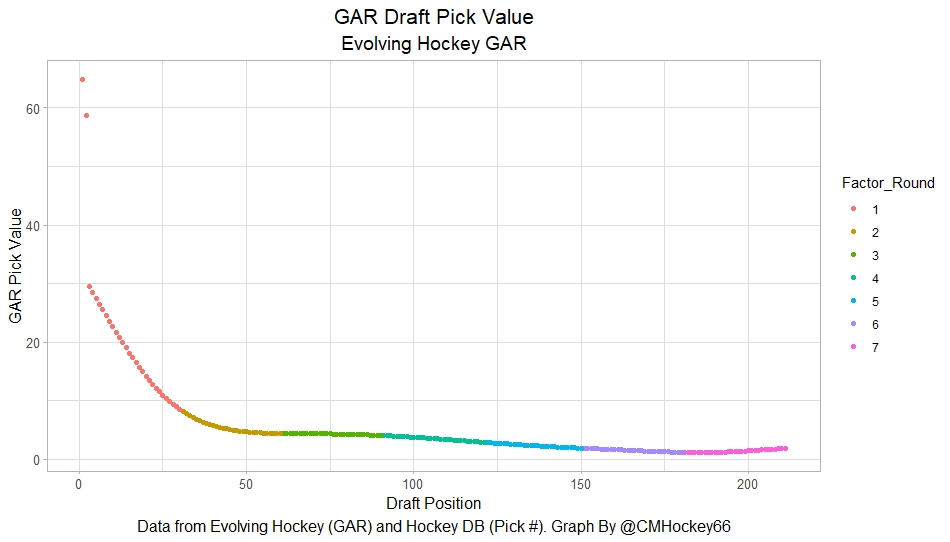
The pick-value chart above gives us an expected value for each player based on their draft slot. Now, all we do is take the player's cumulative GAR in their first seven seasons and subtract off expectations and we have their GAR relative to expected.
For example, let's look at Nail Yakupov. Yakupov was picked No. 1 overall in the 2012 NHL Draft by the Edmonton Oilers. As a result, his expected GAR from the chart is about 65. Unfortunately, he only produced about 8 goals above replacement in the seven seasons after 2012.
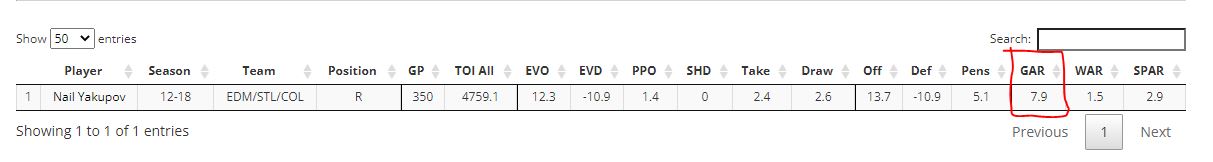
As a result, Yakupov's value above expected is -57 (8-65). In other words, He dramatically underperformed his draft position. Yakupov is known as a generational draft bust, so a big negative number for him checks out.
Now all we have to do is apply this formula to every player drafted from 2007 to 2014, and start looking to see if any statistics can help us predict value above/below expectations.
The NHL draft market will have had all these statistics available to them, so if they are correlated with values above expected, it means the market was failing to account for them properly.
As mentioned above, the first metric we will be looking at is NHLe.
What is NHLe?
For those unfamiliar with NHLe, let's explain it. NHLe stands for NHL equivalency. It is a way of evaluating point production in any league at the same scale as NHL points.
As a result, it is incredibly useful for prospects because they can be playing against high school students in America or professional hockey players in Russia. Obviously, production is easier in the former than in the latter, and NHLe lets us quantify that.
We will be using Patrick Bacon's NHLe estimates for this post. You can read the math as to how he calculates the values here, but let's just run through an example quickly.
For our example, let's look at John Tavares and then Victor Hedman in the 2009 NHL Draft. Tavares scored 104 points in 56 OHL games, while Hedman scored 21 points in 43 SHL games. It is not obvious whose scoring rates are more impressive. Tavares scored over a full point per game more, but he did it against his peers in a Canadian Junior League, while Hedman played in a professional league.
Bacon's NHLe multiplier for the OHL is 0.144 and 0.566 for the SHL. The large difference is because it is much harder to score in the SHL, so a singular point is essentially closer to that of an NHL point.
Next, we can multiply each player's points per game by their NHLe league multiplier, and get their league-adjusted points per game played. This will take those scoring rates and scale them to the same number, accounting for their league quality.
So, take Tavares's 1.85 PPG times 0.144 and Hedman's 0.488 times 0.566 and we get that Tavares scored at a 0.267 NHLe per game pace while Hedman scored at a 0.276 NHLe per game played.
This suggests Hedman's scoring, before even accounting for the position was more impressive than Tavares' production, even though Tavares had far better raw numbers because Hedman did it in such a difficult league. Note this analysis will only account for players scoring in the league in which the prospect played the majority of their games. Ties were broken with playoff data.

NHLe as a Draft Bias
Now that we have defined NHLe and explained how to use it, we have to combine both the above concepts. This required NHLe data for every prospect drafted from 2007 to 2014. The prospect scoring data came from Elite Prospects, and Bacon's NHLe multipliers were applied to everyone's production from that time.
Then we will compare NHLe rates to the draft value above expected. The NHL draft market should already be accounting for players scoring rates because it is a strong signal of success. So, in theory, there should be no relationship between NHLe (or any metric for that matter) and the value above expected.
If there is a relationship, it means the NHL draft market is not properly accounting for scoring rates and we will have found a draft bias. This would be a strategy which smart teams can exploit to out-draft their competition.
How does value above expected compare to NHLe? The relationship is staggering:
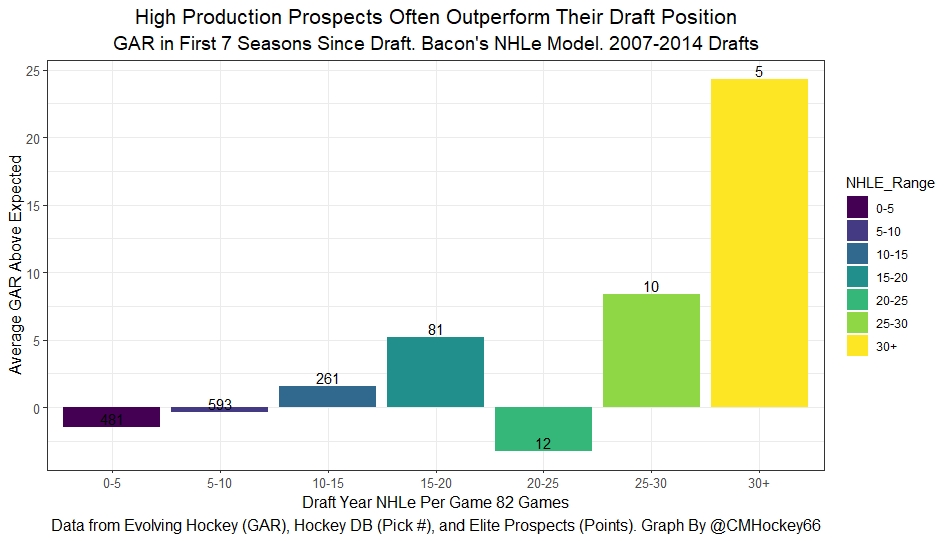
Without adjusting for age or position, NHLe strongly predicts which prospects will outperform their draft position. Low-scoring players have produced lower GAR values than expected, and high-scoring players have produced much, much more GAR than expected, especially those in the highest-scoring bin.
This suggests that teams haven't properly taken scoring rates into account when making their draft rankings. They are systemically ranking high-scoring players to low, and low-scoring players to high.
As a result, the relationship between scoring and player success pops off the page even though we have accounted for draft position.
Confounding Variables
As mentioned above, this analysis does not account for age or position. Everyone knows points are a worse evaluator of talent for defenders, so is the statement that scoring is undervalued at the draft driven by forwards or universally true? Well, let's group by positions and find out.
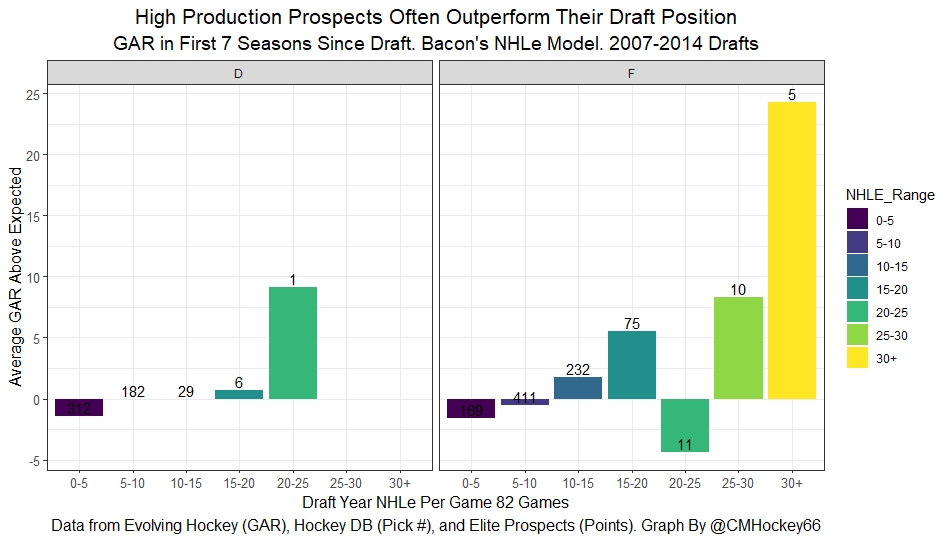
It does turn out the relationship is much stronger for forwards than defenders. As for age adjustments, this is more difficult.
A proper age-adjusted scoring metric would take a full article on its own. For the sake of this article, remember that not having an age adjustment makes it more difficult to find a relationship here.
A 20-year-old prospect who posts a 30 NHLe point pace will go into the same bin as an 18-year-old, even though the 20-year-old is far less likely to outperform their draft position. because their scoring is far less impressive due to their massive age advantage.
The next graph we will look at will filter out all over-age players to try and account for this.
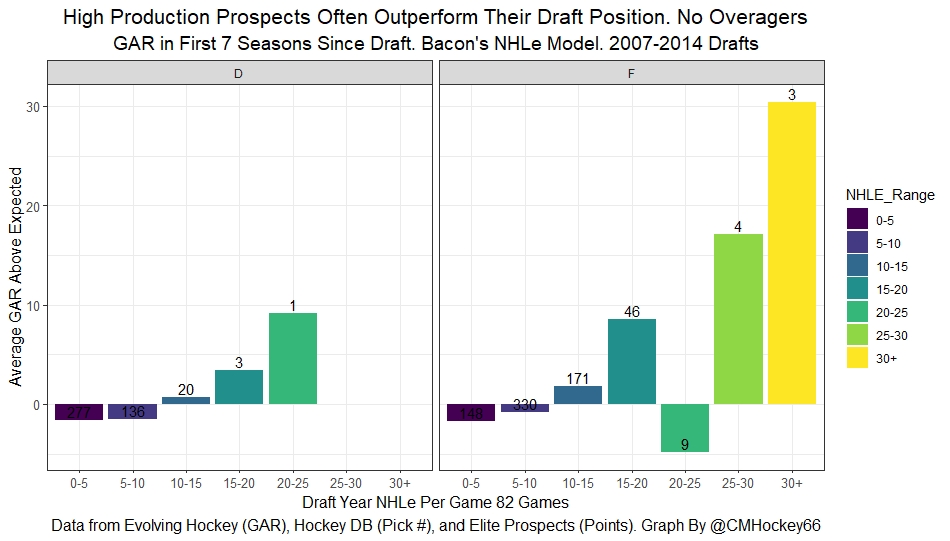
The figure above without over-agers shows the same conclusion. In fact, the relationship has become stronger.
The highest scoring bin of forwards now outperformed their draft position by a full 30 GAR! Note the relationship is much stronger for defenders than forwards, but the success rate data tells a different story.
Outliers, and Success Rates
There is one final problem to deal with, outliers.
Somebody may be skeptical of the evidence above because a handful of highly successful or unsuccessful players could drive their entire bin up or down (you will never guess which high-scoring forwards bin Nail Yakupov is in). To account for these outliers, we can also look at success rates.
Success rates will simply be a 0 or 1 for each player. If a player produced more GAR than expected based on draft position (for example, fourth-round pick Johnny Gaudreau) they get a 1. If a player was worse than expected (think Yakupov), they get a 0. From there, the average number will represent the success rate.
What is the success rate by NHLe?
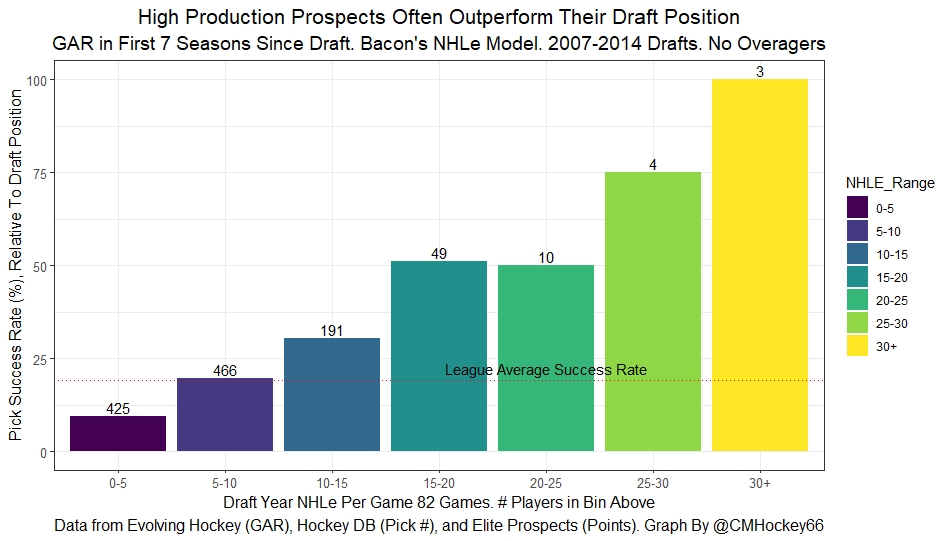
Turns out, that as scoring increases, the success rate skyrockets. The median draft pick fails. Most NHL draft picks never even play a game, never mind producing enough value relative to replacement level to justify their draft position.
But, those who are productive are far more likely to outperform their draft position. Less than 10% of the lowest scoring cohort were successful picks, while over 50% of players producing at least 15 NHLe per 82 games in their draft year were successful picks.
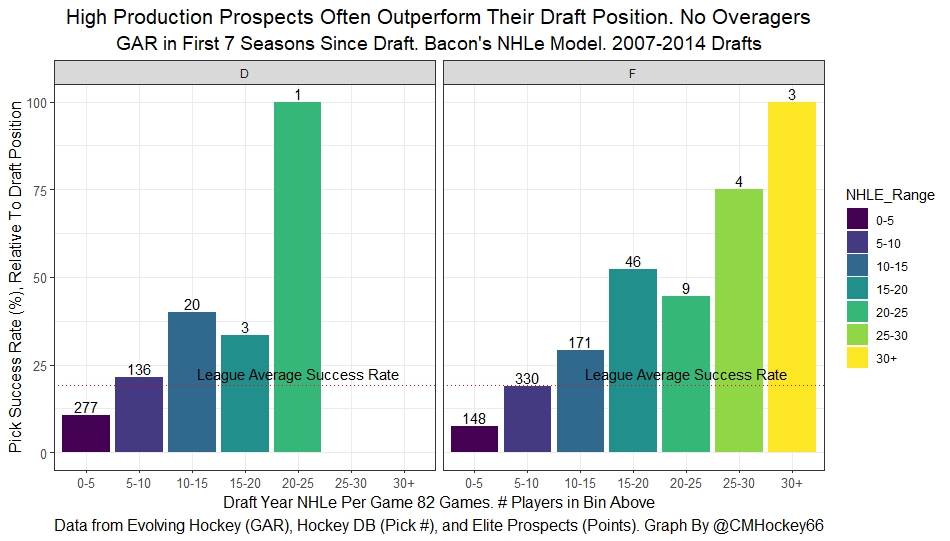
When we sort by position, we see the results are still incredibly strong.
Conclusion
Altogether, we can see NHLe models are incredibly valuable. They are incredibly powerful at predicting success, especially at the extremes. More importantly, teams have not properly accounted for scoring rates.
As a result, high-scoring players tend to outperform their draft position, while lower-scoring players tend to be underwhelming.
Pushback against NHLe by the scouting community tends to be that it lacks context, which is true. My analysis above cannot account for time on ice or the quality of teammates. And yet, NHLe has still historically been able to find value that million-dollar scouting departments have missed.
So, if your team drafts a player with incredibly high league-adjusted scoring numbers, they probably got a better player than their draft position implies, while the opposite is true for low-scoring players.


