A couple of years ago I navigated a quest to determine which college football statistics were key to cashing tickets.
In a path similar to an Indiana Jones movie, the task was to find the Holy Grail of sports betting — an analytical approach to solving the puzzle of predicting which teams would cover against the spread.
With dozens of data sources providing hundreds of variables for reporting, the search was narrowed down to the Five Factors. If these categories could find a high probability of winning football games outright, could they predict which team would cover the spread?
Every metric from previous seasons was combed over, from our beloved Havoc stat to Quality Drives. Other categories — such as field position, red zone and turnover luck — sounded good in theory but were ultimately debunked when it came to covering against the spread.
My research in the summer of 2021 came down to three statistical categories that uncovered the possible Holy Grail of College Football: Explosiveness, Success Rate and Finishing Drives.
Fast forward to the present, and a data set that goes back to 2018 may help in making a theoretical assumption into proven facts.
First, our entries include 644 teams to take the field since 2018 with data in our three specified categories. Armed with a large enough sample set, a conclusion can be made on which statistical category predicts winners and losers at the window.


Explosiveness
Top 10% ATS: Offense 52% · Defense 52%
- Historical Best Offense: 2019 Louisville
- Historical Best Defense: 2020 Iowa
- Historical Worst Offense: 2022 New Mexico
- Historical Worst Defense: 2022 James Madison
Everyone loves the big play, no matter if the measurement is Isolated Points per Play (IsoPPP) or Expected Points Added (EPA).
Offensive coordinators look for consistent chunk yardage plays, while defensive coordinators will drop as many as eight defenders. Although explosiveness is the sexiest stat in college football, it doesn't equate to cashing tickets.
A high ranking in Expected Points Added on both sides of the ball equates to a 51.8% cover rate. There are similar results in checking with the bottom 10% of the data, as the offensive cover rate comes in at 45% compared to 48% on defense.
The average EPA both offensively and defensively is 1.25, but there's no investment takeaway regarding teams that can stop or produce explosiveness.
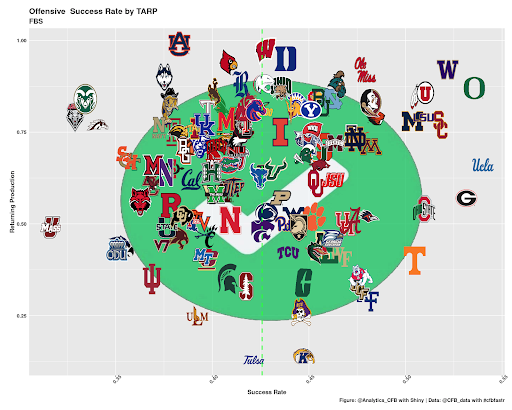
Success Rate
Top 10% ATS: Offense 55% · Defense 55%
- Historical Best Offense: 2020 Alabama
- Historical Best Defense: 2022 James Madison
- Historical Worst Offense: 2020 UMass
- Historical Worst Defense: 2021 Akron
Success Rate is a valid indicator of making a bet on a team to cover the spread both offensively and defensively.
Not only did the elite top 10% of offenses and defenses register at a 55% cover rate, but the numbers were also stable when expanding the range. The top 25% of offenses in Success Rate marks covered the spread 53.9% of the time, while defenses in the top 25% cashed at a 54.6% clip.
Where Success Rate really started to shine in the numbers was in the bottom tier.
The bottom 10% of teams by Defensive Success Rate marks since 2018 covered the spread 40.4% of the time, while the bottom 25% came in at 43%. Those same splits on the offense side produced similar numbers, as the bottom 10% registered a 44.6% cover rate and the bottom 25% covered in 44.3% of games.
The giant takeaway is that failing to generate a median Success Rate number of 42.5% offensively and 41.6% defensively will drastically lower a team's ability to cover the number.
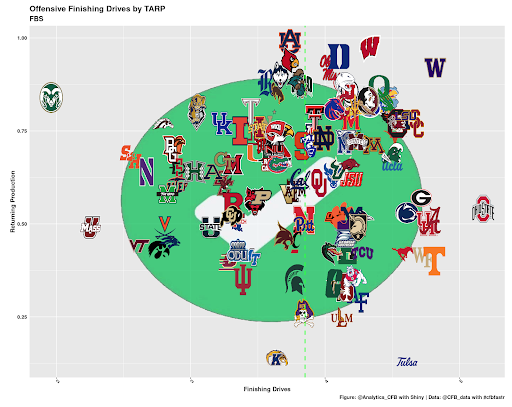
Finishing Drives
Top 10% ATS: Offense 58% · Defense 57%
- Historical Best Offense: 2022 Ohio State
- Historical Best Defense: 2021 Georgia
- Historical Worst Offense: 2019 Akron
- Historical Worst Defense: 2021 Akron
Make no mistake, the king of all statistics in covering the spread is still Finishing Drives.
Both Offensive and Defensive Finishing Drives correlated with healthy numbers against the spread with no drop-off in expanding the sample size.
The top 25% of offenses in this category since 2018 have covered at a 55.4% rate, while defenses in the same sample covered at a whopping 57.1% clip.
This could be the start of the Holy Grail research, where handicapping on Finishing Drives alone could produce winners.
The reverse sampling of the numbers produced equally strong support. The bottom 10% of teams in terms of Offensive Finishing Drives since 2018 covered just 39.4% of games, while the defenses covered 40.6%. When expanding to the bottom 25% of offensive and defensive teams in our 644-team sample set, both Finishing Drives cover rates came out to 42.9%.
These numbers lead us to the conclusion that the No. 1 stat when it comes to success against the spread is Finishing Drives on both sides of the ball. The average of all teams offensively is 3.7 Points per Opportunity, with the defensive average in Finishing Drives at 3.6.
The teams in 2023 that return a heavy amount of offensive personnel and a great scoring track record include Washington, Oregon and USC. Defensively, the teams that return the most experience after producing elite Finishing Drives numbers include Texas A&M and South Alabama.