All of Collin's projected totals and edges against the betting market are available in our college football model projections, part of Action PRO.
The 2020 college football season continues to produce overs at a high number, especially when the total is driven down by gamblers. In last week's Pace Report it was identified that totals that move more than two points lower have hit the over at nearly a 70% rate.
One prime example of this came in the late Mountain West window with San Diego State visiting Utah State. An opening total of 49.5 closed at 40.5, allowing most gamblers, including myself, to jump on the over. Under Rocky Long the Aztecs were known as a slow-paced ground attack. That all changed when new head coach Brady Hoke hired Jeff Hecklinski as offensive coordinator. The coach opening comments included, "electric, vertical, [and] fast-paced," giving a nod to college football investors that San Diego State would become an over team.
Good guys score first on a 15-yard touchdown pass from Carson Baker to Kobe Smith. Watch on @CBSSportsNet. pic.twitter.com/hmndw35Gbj
— San Diego State Football (@AztecFB) November 1, 2020
Hecklinski has the Aztecs running at 27 seconds per play for a rank of 77th in the nation. That is a considerable change in pace after Long's offenses historically finished bottom-10 year after year. Continuing on last week's research from Bet Labs, totals that have dropped more than two points since September 23 have cashed 68% of the time.
This Pace Report continues to utilize a number of variables to come up with a projection for each game (all of which are included in Action PRO).
Oddsmakers in New Jersey and Las Vegas have an assigned point value for each team, and that number is adjusted based on ensuing game results. I go a bit further by applying some math and advanced stats to my projections.
The formula first takes into account yards per play for offense and defense. Plays per game are also integrated to the yards per play difference to come up with a total. The formula is incomplete without a sign of what teams do in scoring opportunities. Finishing drives and pace must be accounted for in totals.
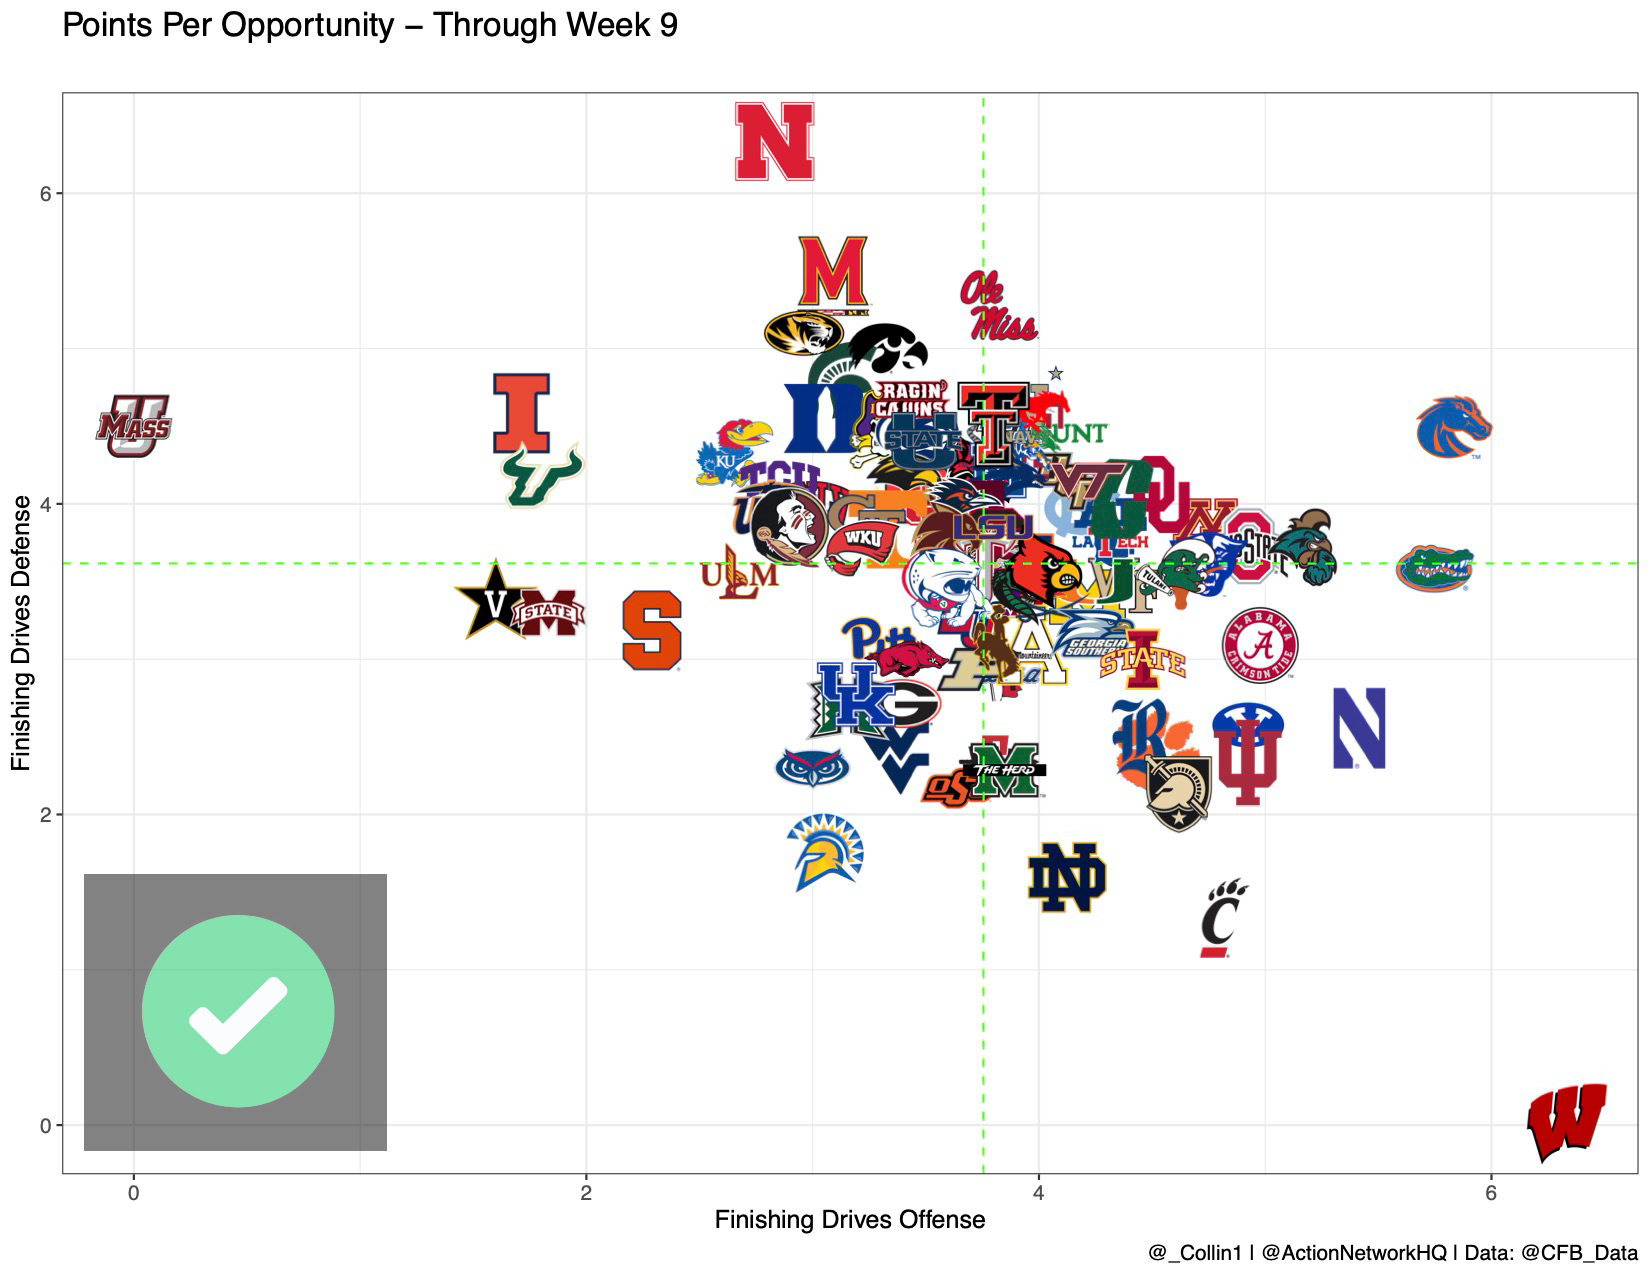
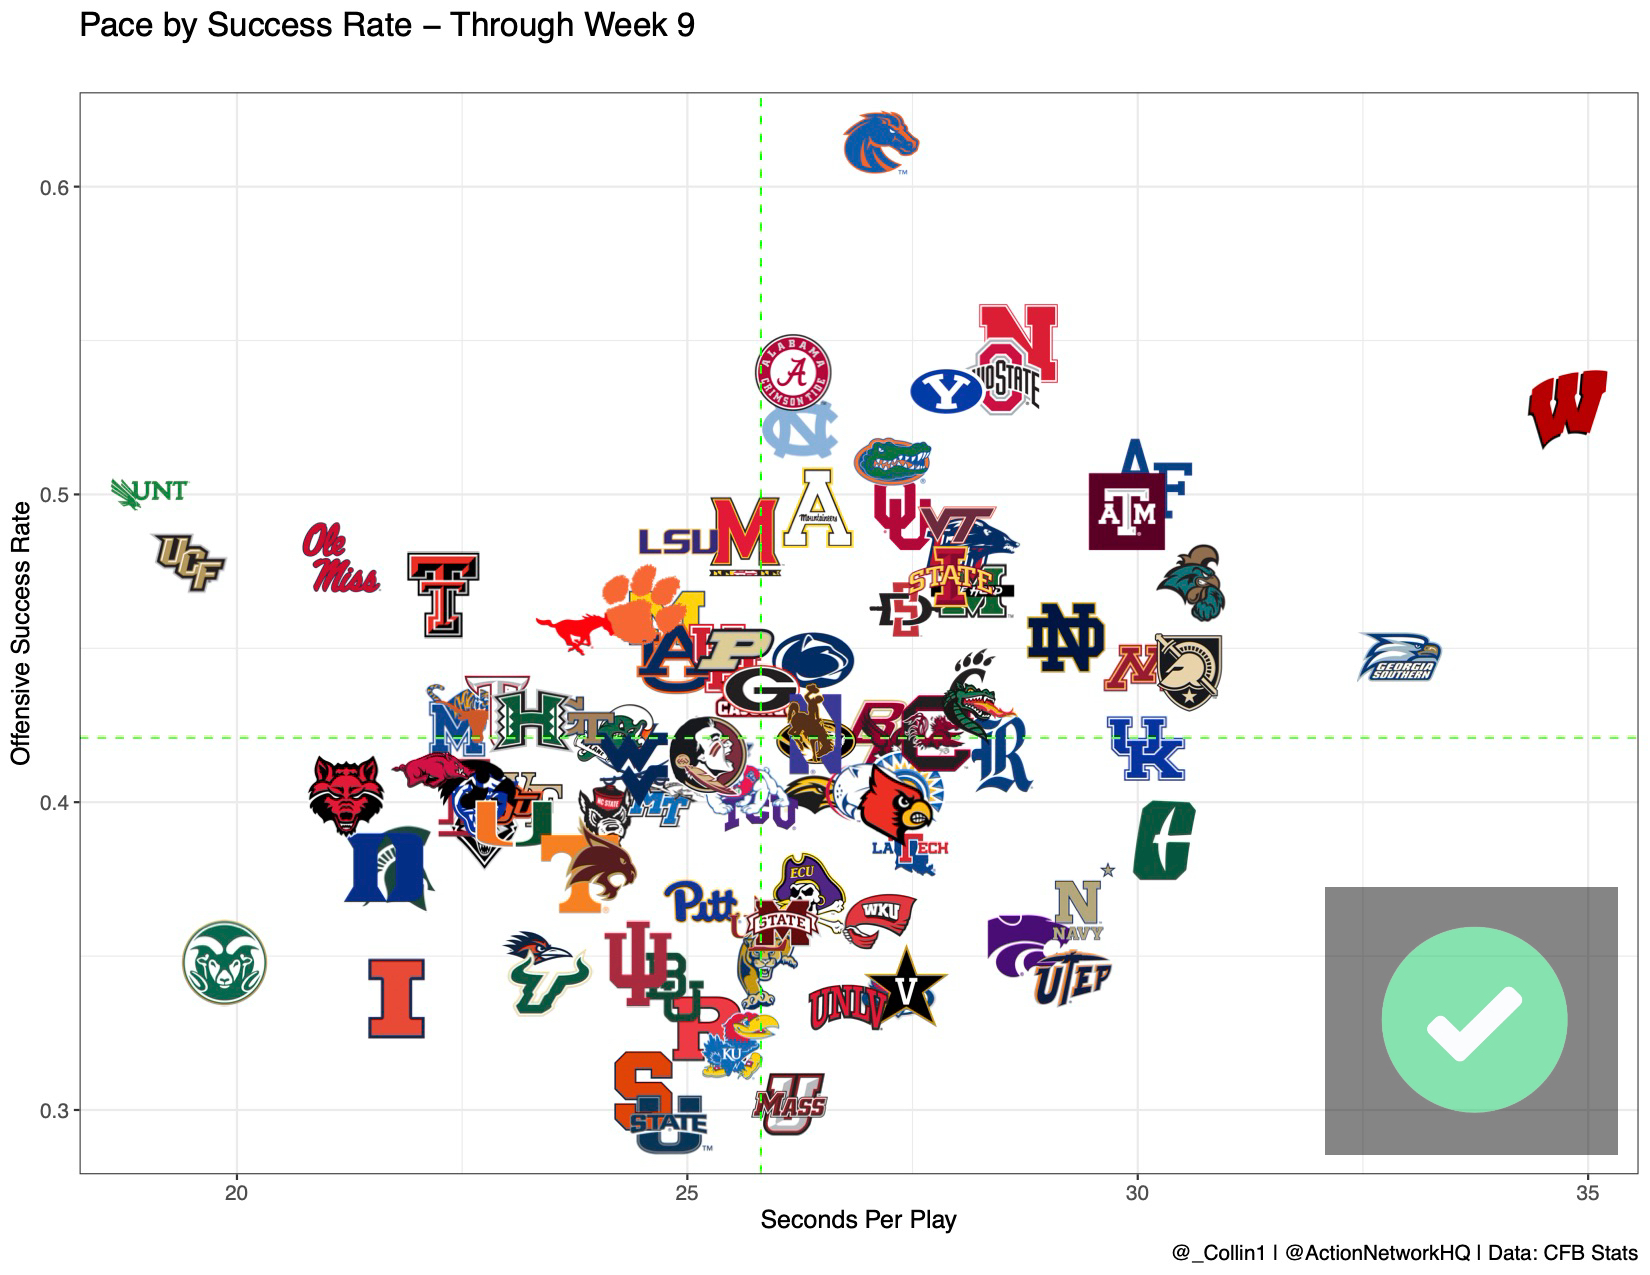
Whether a team is fantastic within the 40-yard line for scoring opportunities, pace of play must be considered. Seconds per play can give an investor an inside track into which teams have more snaps per game, and in combination with Success Rate and Finishing Drives, can develop facts around scoring points.
Our Pace by Success Rate chart looks at Seconds Per Play along with Success Rate, defined as gaining 50% of needed yards on first down, 70% of needed yards on second down, or 100% of needed yards on third or fourth down.
Here is the total list of projections for every game, without the PAC 12 in which a week of data will give more accurate total projections.
Week 10 Projected Totals
Our model projections, now part of Action PRO, automatically compare our projected totals to the betting market and grade them on an A-F scale.
Notes on Week 10 Totals
BYU vs. Boise State
Both the Cougars and Broncos are associated with slow-paced offenses, which continues to be the case in 2020. Both teams average over 27 seconds per play and have the Offensive Success Rate to string together 15-play drives and choke out the clock.
To most Week 10 gamblers, this is an obvious under play, but a closer look at Finishing Drives and explosiveness may dictate otherwise. Boise State ranks 87th against the explosive pass and 88th in Defensive Finishing Drives. Furthermore, each team ranks in the top 10 in Offensive Finishing Drives. There should be plenty of touchdowns instead of field goals to get this over the total.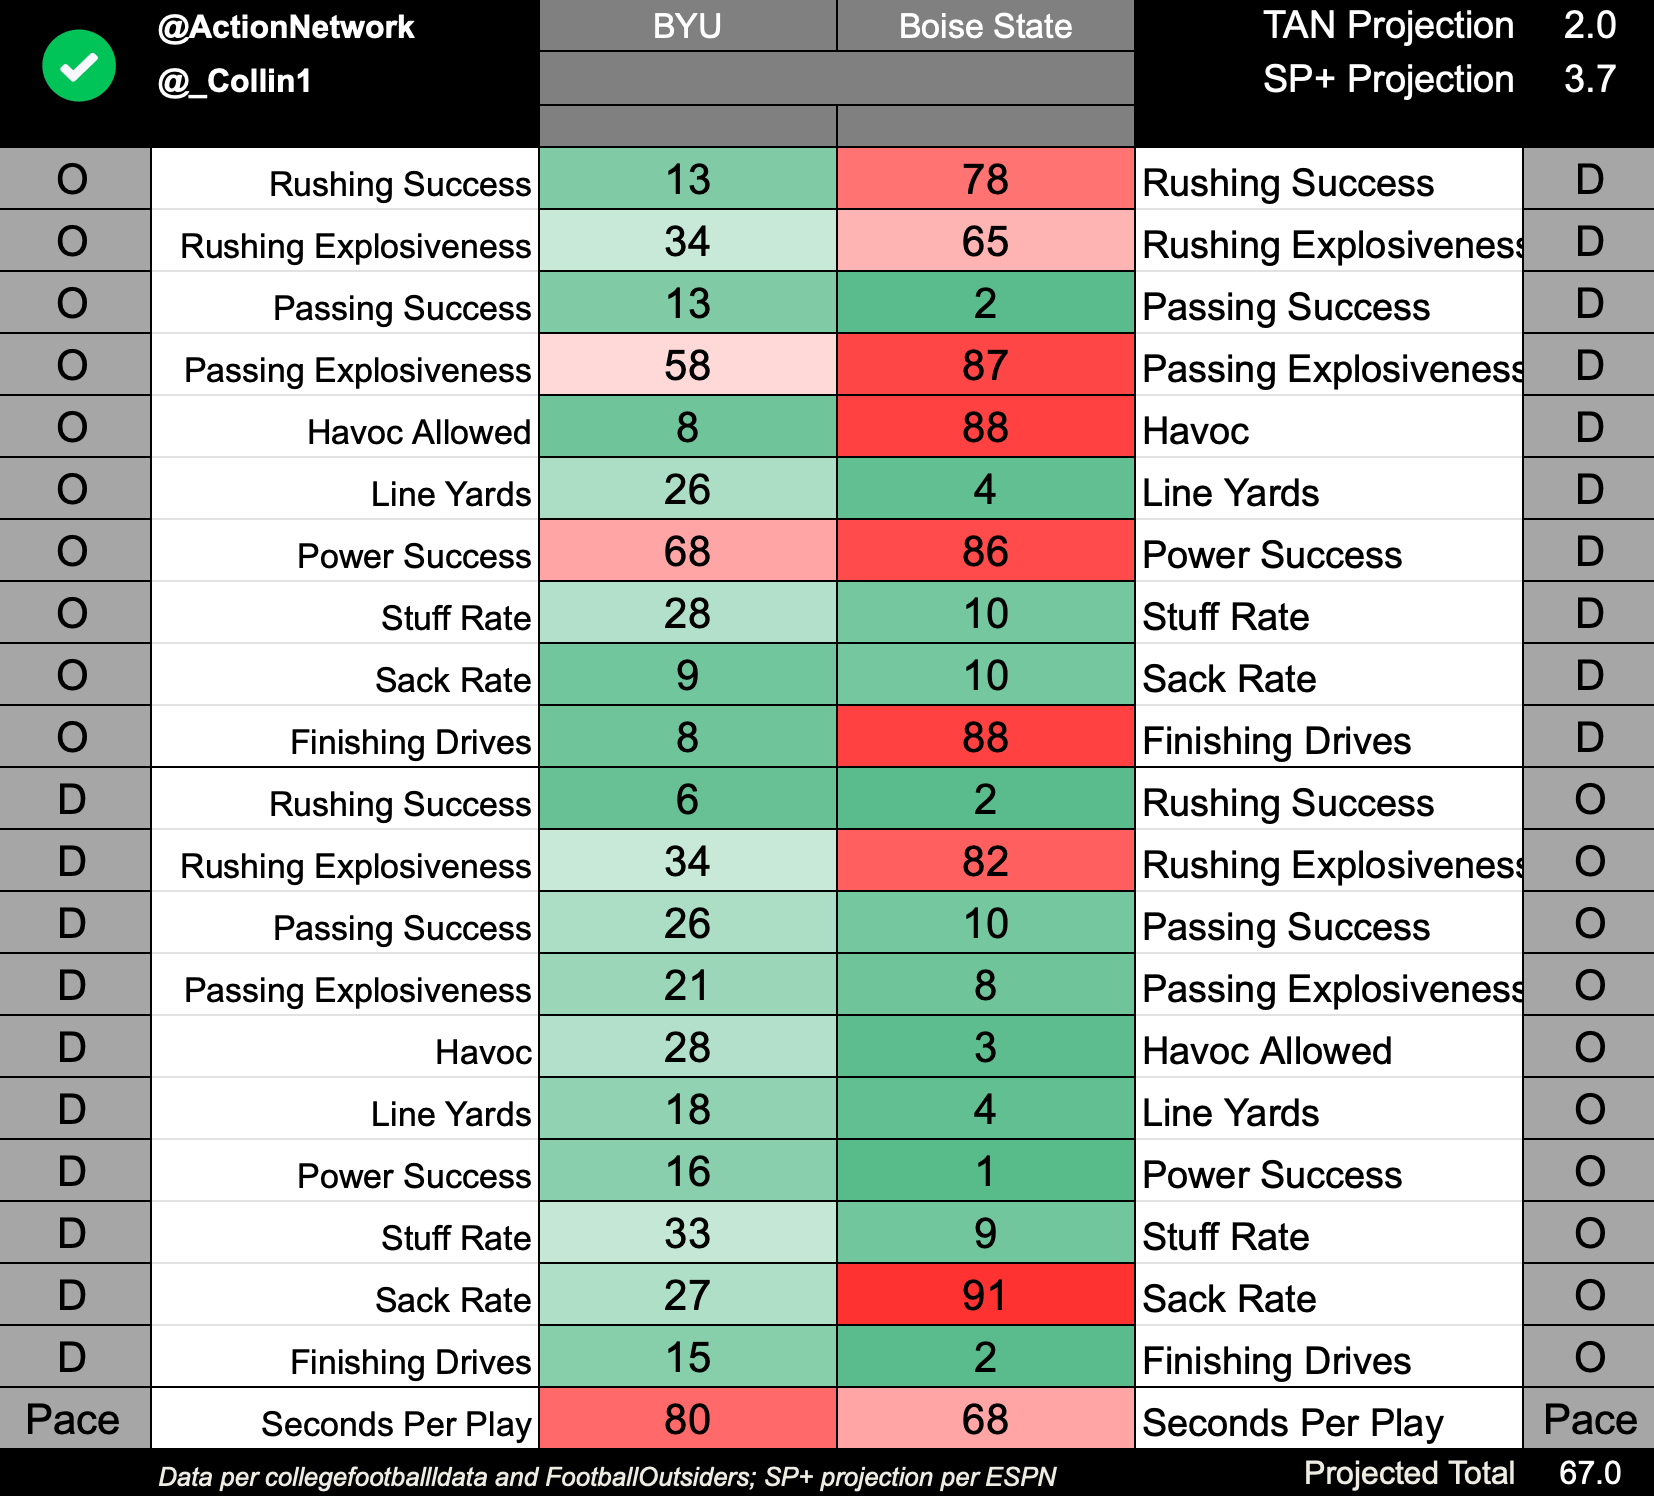
Rutgers vs. Ohio State
One key metric not captured in the matchup matrix is missed tackles, an area that is a reflection of coaching. Count Rutgers as one of the most improved teams in the nation in tackling, currently ranked sixth in FBS, per PFF. Ohio State should be able to name its score, but a rank of 88th in pace dictates the points will come along with chunks of clock.
Meanwhile, Rutgers has had its share of explosive plays on offense, but a rank of 68th in Finishing Drives shows a lack of putting points on the board in scoring opportunities.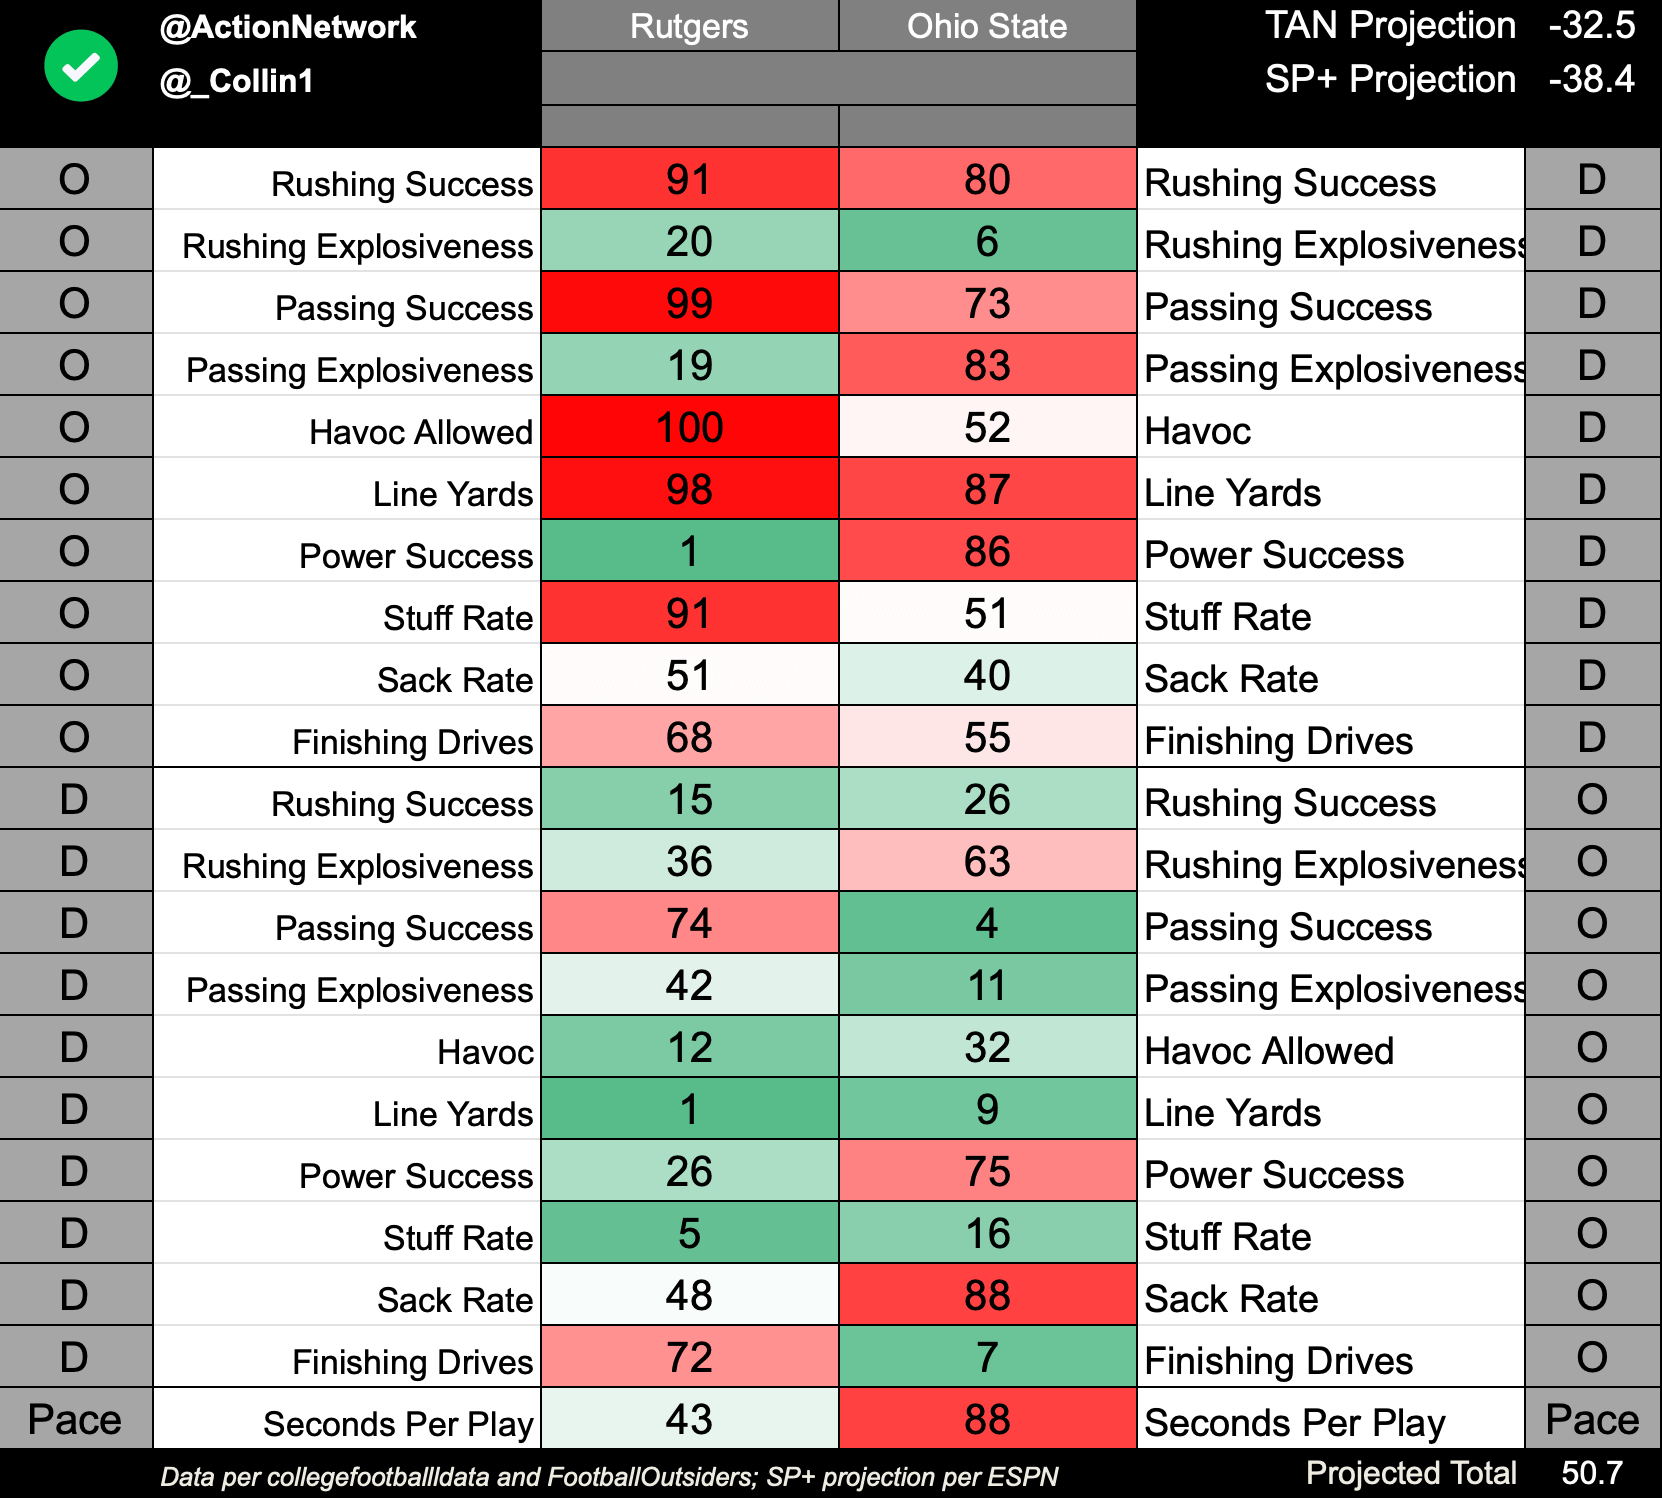
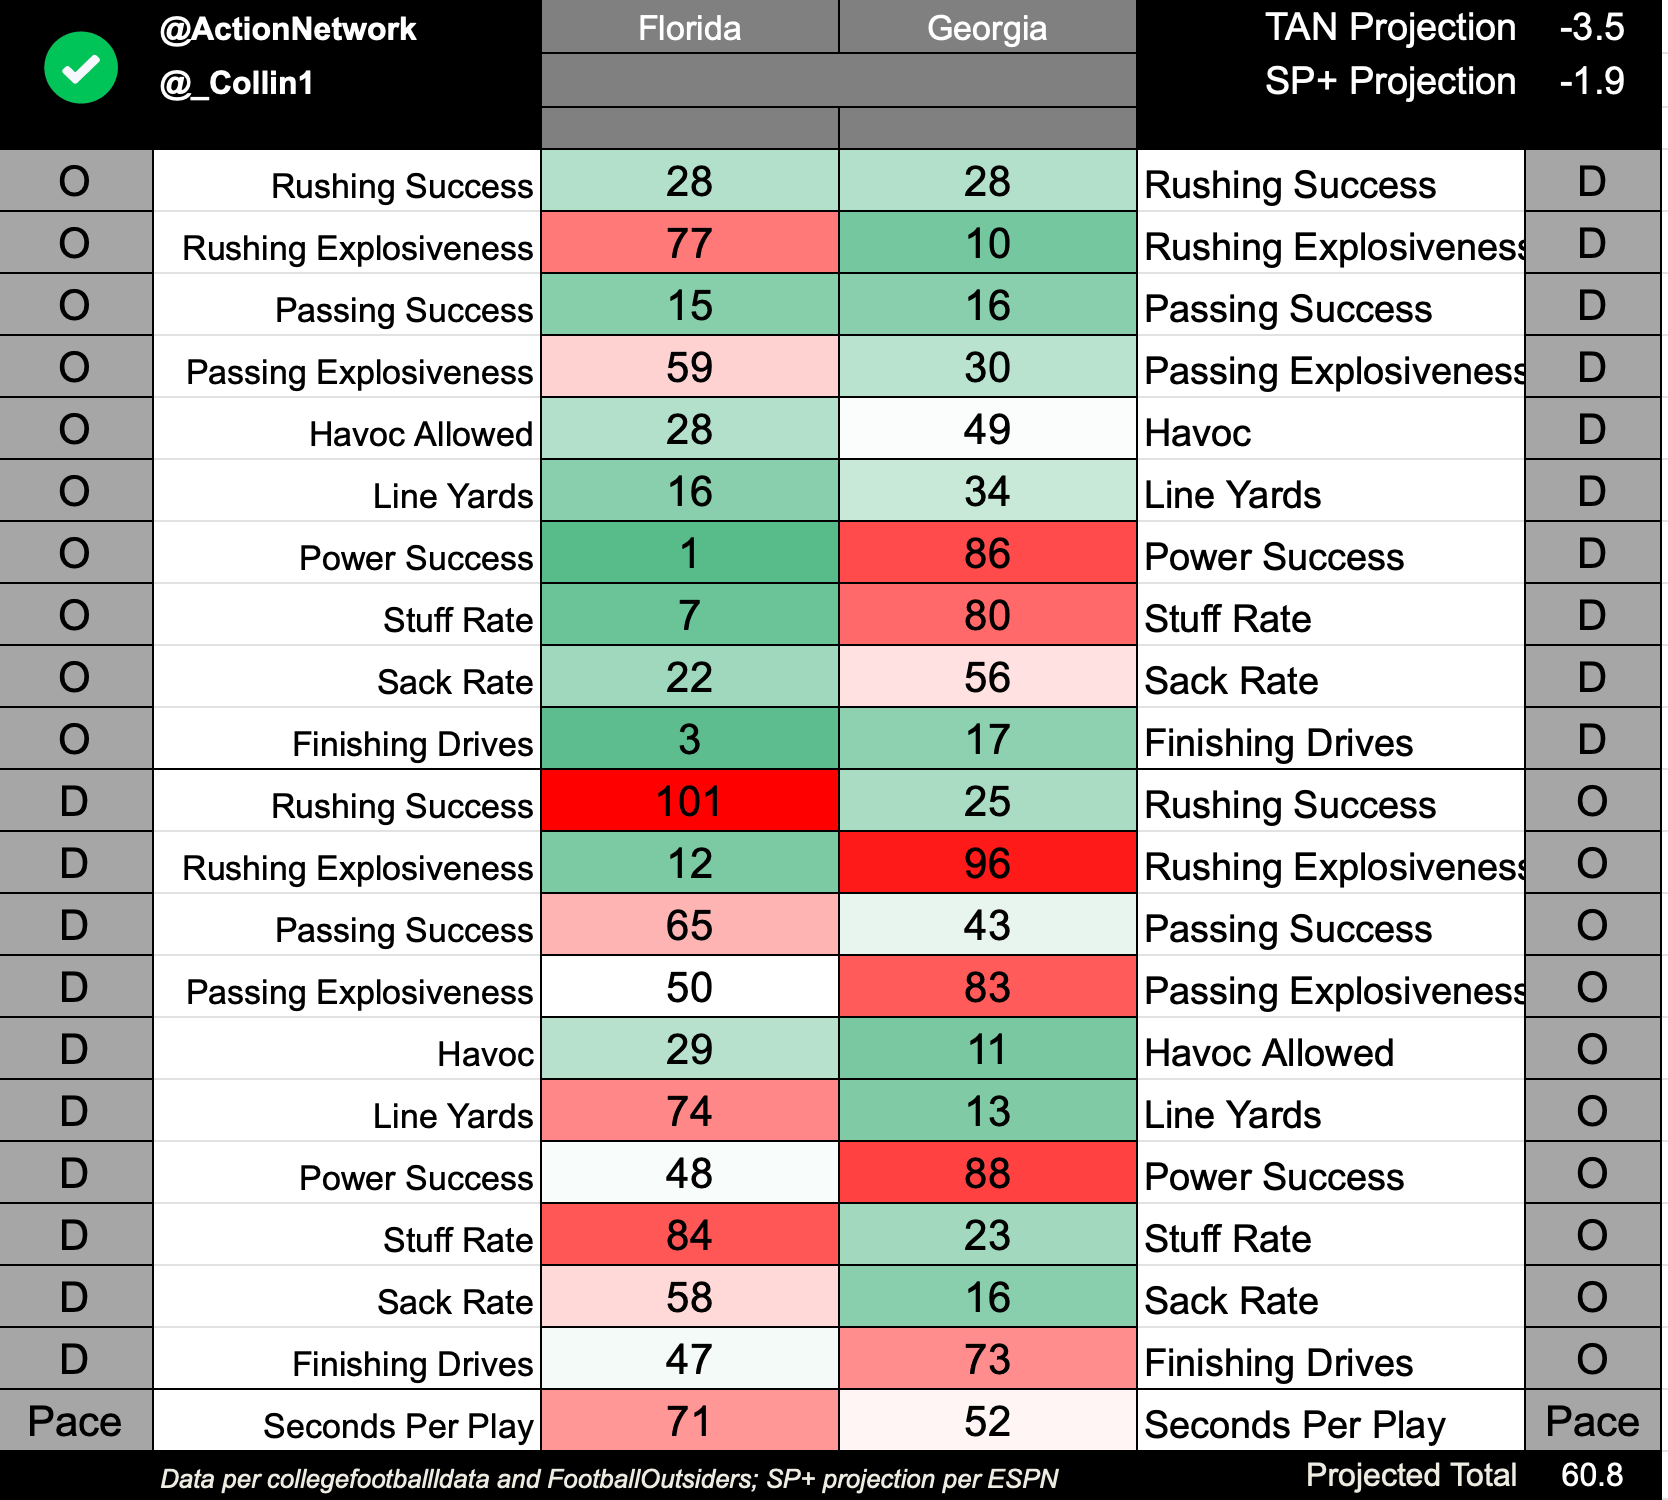
Florida vs. Georgia
With all of the calculations and equations to come up with a total on this game, one constant remains the same: the Gators are 99th in tackling this season, per PFF. Todd Grantham's unit now ranks 101st in Defensive Rushing Success Rate out of 103 teams ranked. The Georgia offensive line is 13th in Line Yards, which should give the Bulldogs easy access to moving the chains.
As for the Florida offense, a rank of third in Finishing Drives is a highlight of red-zone activity for Dan Mullen. The Gators have reached the red zone 21 times this season, leaving with 16 touchdowns and five field goals. Kirby Smart's defense will be without its highest-graded coverage player, as Richard LeCounte recovers from a motorcycle accident.