


This article is part three in a series that aims to re-think how we look at, and evaluate, the NHL Entry Draft. The previous post aimed to prove that NHLe can predict success independent of draft position. This article aims to predict failure. More specifically, it aims to prove that prospects who take a lot of penalties have under-performed expectations at the NHL level.
Defining Expectations
Expectations will be defined the exact same way as in the last post. So, if you read the last one, feel free to skip this section. For those who are new, let's define expectations.
To find which players have over/underperformed their draft position, we need a way to estimate the expected value of each prospect based on their draft position. This has been done in a previous article in this series, which can be found here.
That article outlines the process behind this draft pick model. Note: We will be using the Evolving Hockey's Goals Above Replacement (GAR) metric for this article. It’s a catch-all metric that measures how much a player contributes to their team's performance. Higher GAR values represent more productive players.

The pick-value chart gives us an expected value for each player based on their draft slot. Now, all we do is take the player’s cumulative GAR in their first seven seasons and subtract off expectations and we have their GAR relative to expected.
For example, let’s look at Nail Yakupov. Yakupov was the No. 1 overall pick in the 2012 NHL Entry Draft. As a result, his expected GAR from the chart is about 65. Unfortunately, he only produced about 8 goals above replacement in the seven seasons after 2012.
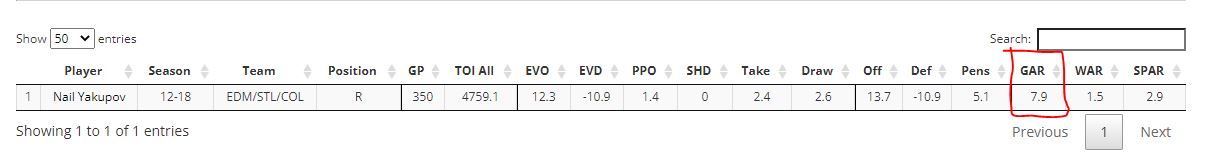
As a result, Yakupov’s value above expected is -57 (8-65). In other words, He dramatically underperformed his draft position. We know Yakupov is a generational draft bust, so a big negative number for him checks out.
Now all we have to do is apply this formula to every player drafted from 2007 to 2014, and start looking if any statistics can help us predict value above/below expectations.
The NHL draft market will have had all these statistics available to them, so if they are correlated with values above expected, it means the market was failing to account for them properly.
Penalty Minutes as Bias
So now that we have defined the value above expected, it's time for us to look for what metrics predict value above or below expected. Today's metric is penalty minutes. With Elite Prospect's dataset, let's look at how penalty minutes have related to value above expected.
Note: This will be penalty minutes per game played, only using data from the league in which the prospect played most of their games during their draft year.
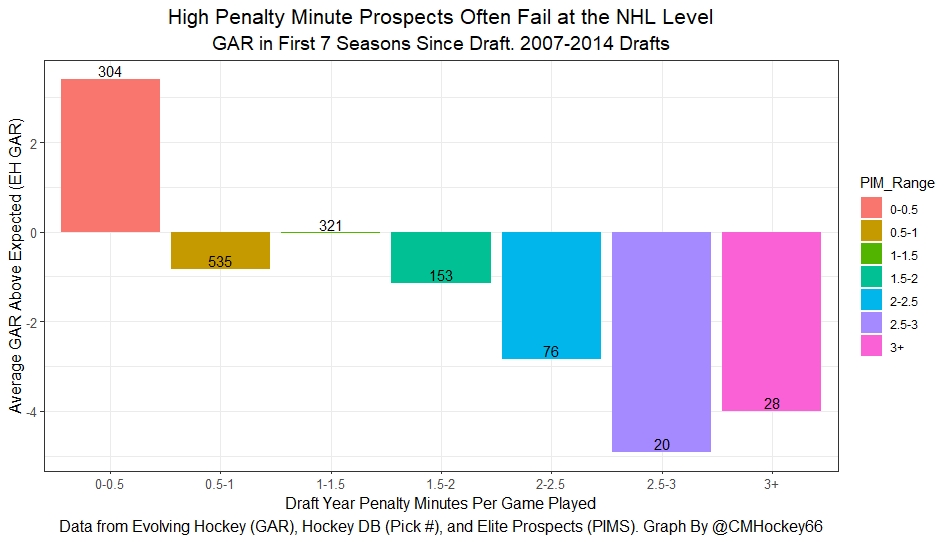
It turns out, that most of the positive NHL draft value was from the cohort of players averaging less than 0.5 penalty minutes per game. However, low penalty minutes do not signal success as much as high penalty minutes signal failure.
As penalty minutes are increasing, players tend to underperform their draft position more and more. The most penalized players on average, perform about half a win worse than their draft status.
This suggests the NHL is overvaluing players with high penalty minutes at the draft. Or, more likely, teams are chasing "toughness" and picking players who accumulate a lot of penalty minutes too high as a result.
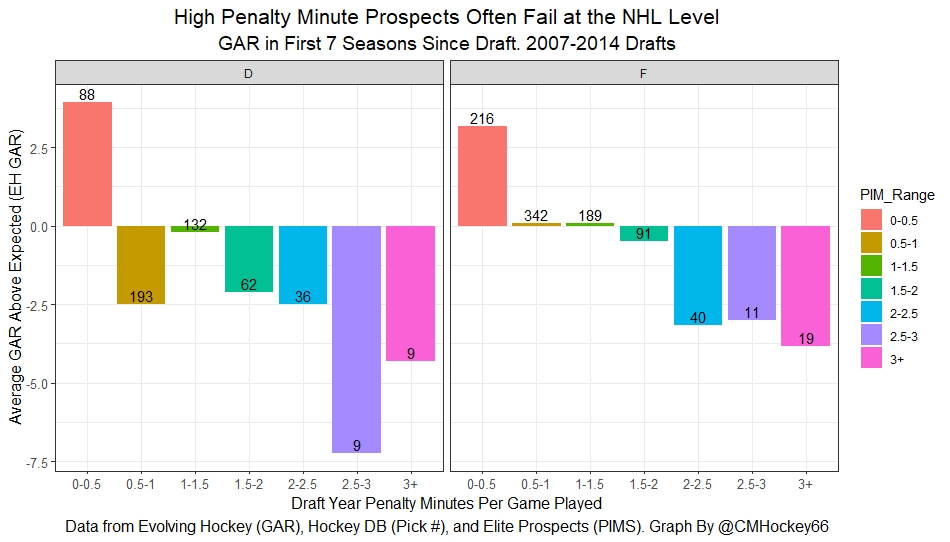
Again, we can also look at positional effects. It turns out both forwards and defenders with high penalty minutes per game have struggled to live up to their draft position.
Outliers, and Success Rates
The graphs above are the averages of each bin. One potential problem with averages is they are sensitive to outliers. To make matters worse, the NHL Draft is filled with outliers.
Thus, we will also look at success rates to show the correlations above are not simply a function of a handful of extremes. First up is the general plot of success rates by penalty minutes.
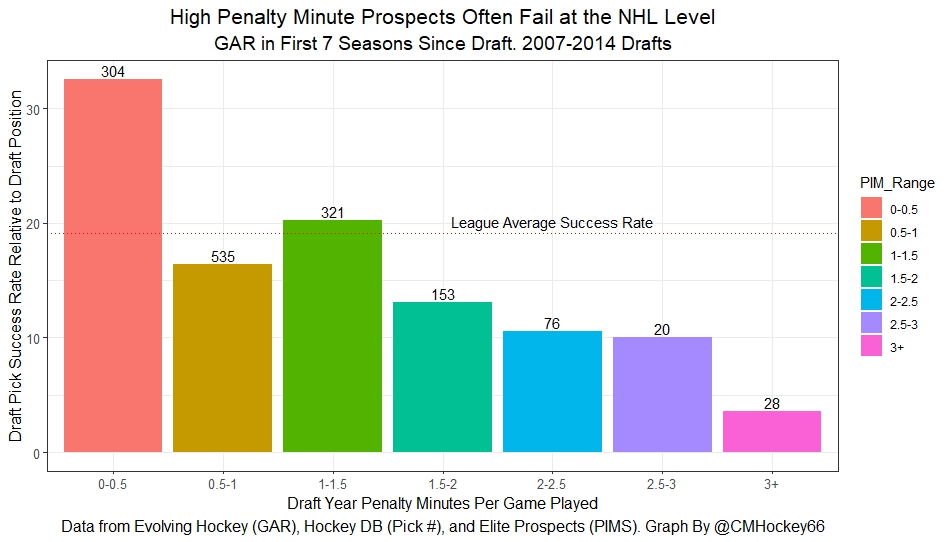
The success rate of the lowest penalty minute players is incredibly high relative to the base rate. Players with 0 to 0.5 penalty minutes per game were successful picks over 30% of the time, and the league average is about 20%. This is strong, but again, not as strong as the relationship between high penalty minutes and failure.
Of the 28 players with more than three penalty minutes per game played in their draft year, only one player outperformed his draft position. For the 100 or so players averaging between 2-3 penalty minutes per game, only 11 were successful picks. It really isn't much better for the 150+ players in the 1.5 to 2 PIM range, who were only successful 13% of the time. This represents a stunning waste of resources by NHL teams.
Finally, we can look at positional effects again, just with success rates.
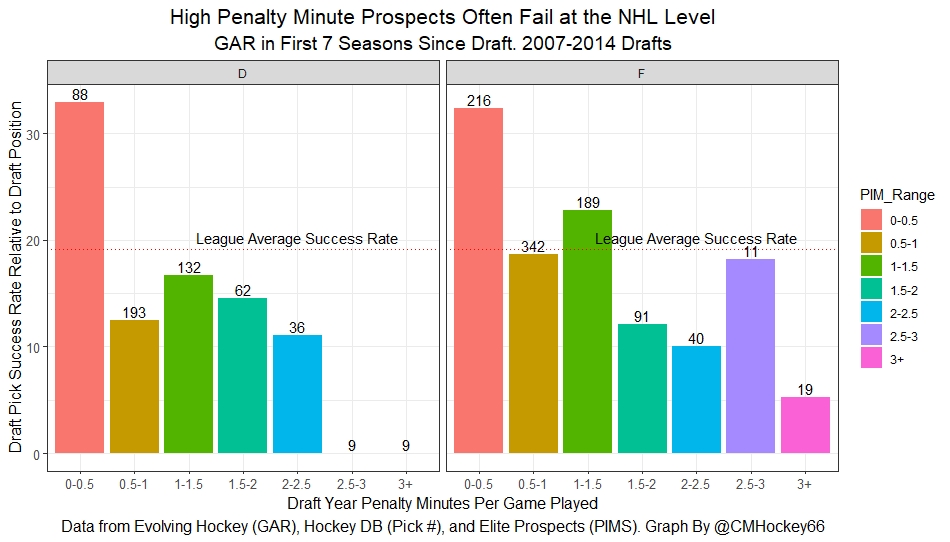
The general trend is the same for both forwards and defenders. Although, the extreme for defenders is incredible. Not a single one of the 18 defenders with over 2.5 penalty minutes per game was a successful pick. In other words, that one successful prospect with 3+ penalty minutes a game was a forward. In both cohorts, the only truly successful group was those averaging between 0 and 0.5 penalty minutes per game played.
Conclusion
Do you want to know who is going to be a great prospect? You should probably look at NHLe. Do you want to know who is likely to fail as a prospect? Penalty minutes are a great place to look. Players who have high penalty minutes have generally been disappointing prospects.
Since draft position is being controlled for in each of these figures and we still see these strong relationships, we can be confident NHL teams are overvaluing something about prospects with high penalty minutes, almost certainly toughness.


