


Not even a hurricane could stop the rise in college football scoring.
The demise of defenses can be seen through every team in each conference. The Ole Miss game total average is above 93 points through three games. Florida has scored on all 15 red zone trips, with 12 coming as touchdowns. If there is a takeaway from the COVID-19 era of college football, defenses did not have enough preparation through the no-pad Zoom era of practices.
Plenty of teams are displaying offensive and defensive characteristics with gambling deliverables. Finishing drives is the calculation of points per scoring chance. An opportunity is defined as an offensive team crossing the 40-yard line. This Pace Report will look at seconds per play by offensive success rate with a touch of finishing drives.
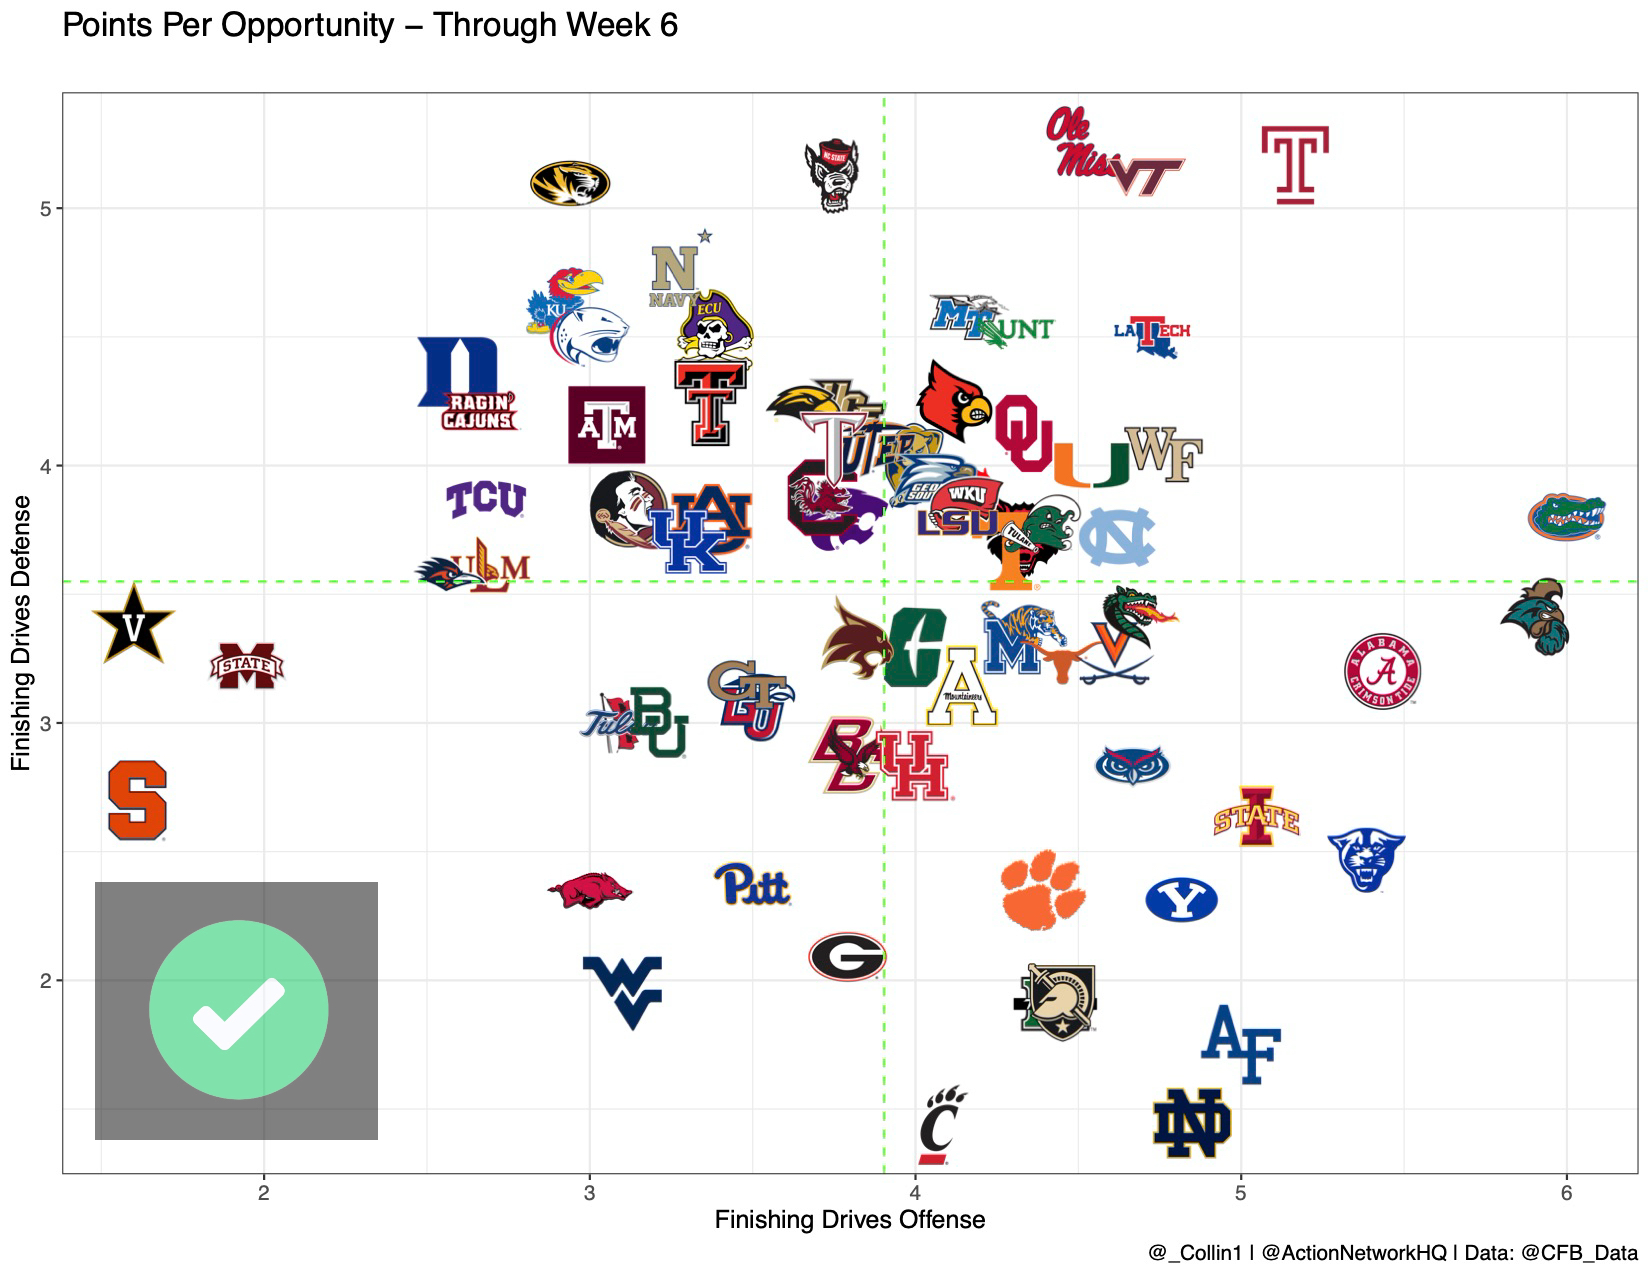
The goal of the finishing drives chart is to be as low and right as possible. In a limited sample set, Notre Dame and Georgia State have shown the ability to generate a maximum amount of points in scoring chances while playing lock down defense in the red zone. Florida remains atop the offensive Finishing Drives, scoring in all 15 trips with 12 ending in touchdown. Missouri is one of the teams on the opposite end of the spectrum, scoring less than a field goal per trip past the 40-yard line while the defense allows more than five points.
In a world where scoring has an increased medium of three points, there are a few teams that are worthy of consideration in betting the Under. Syracuse has the worst offensive success rate in the country and likely lost starting quarterback Tommy DeVito for the season. Mississippi State continues to struggle getting points on the board, having five offensive trips past the 40 against Kentucky for a total of zero points.
Jordan Rodgers rightly pointed this out: Josh Paschal makes an outstanding read to make this interception. He takes the initial contact, reads the screen and makes a play. pic.twitter.com/czcekd44sb
— Tyler Greever (@Tyler_Greever) October 11, 2020
In addition to scoring points when the opportunity presents, team totals may be enhanced by seconds per play. Arkansas State and Georgia State rank in the Top 5 for seconds per play, while Cincinnati and Tulsa rank in the bottom half of pace. Here is the latest Seconds per Play by Offensive Success Rate through Week 6:
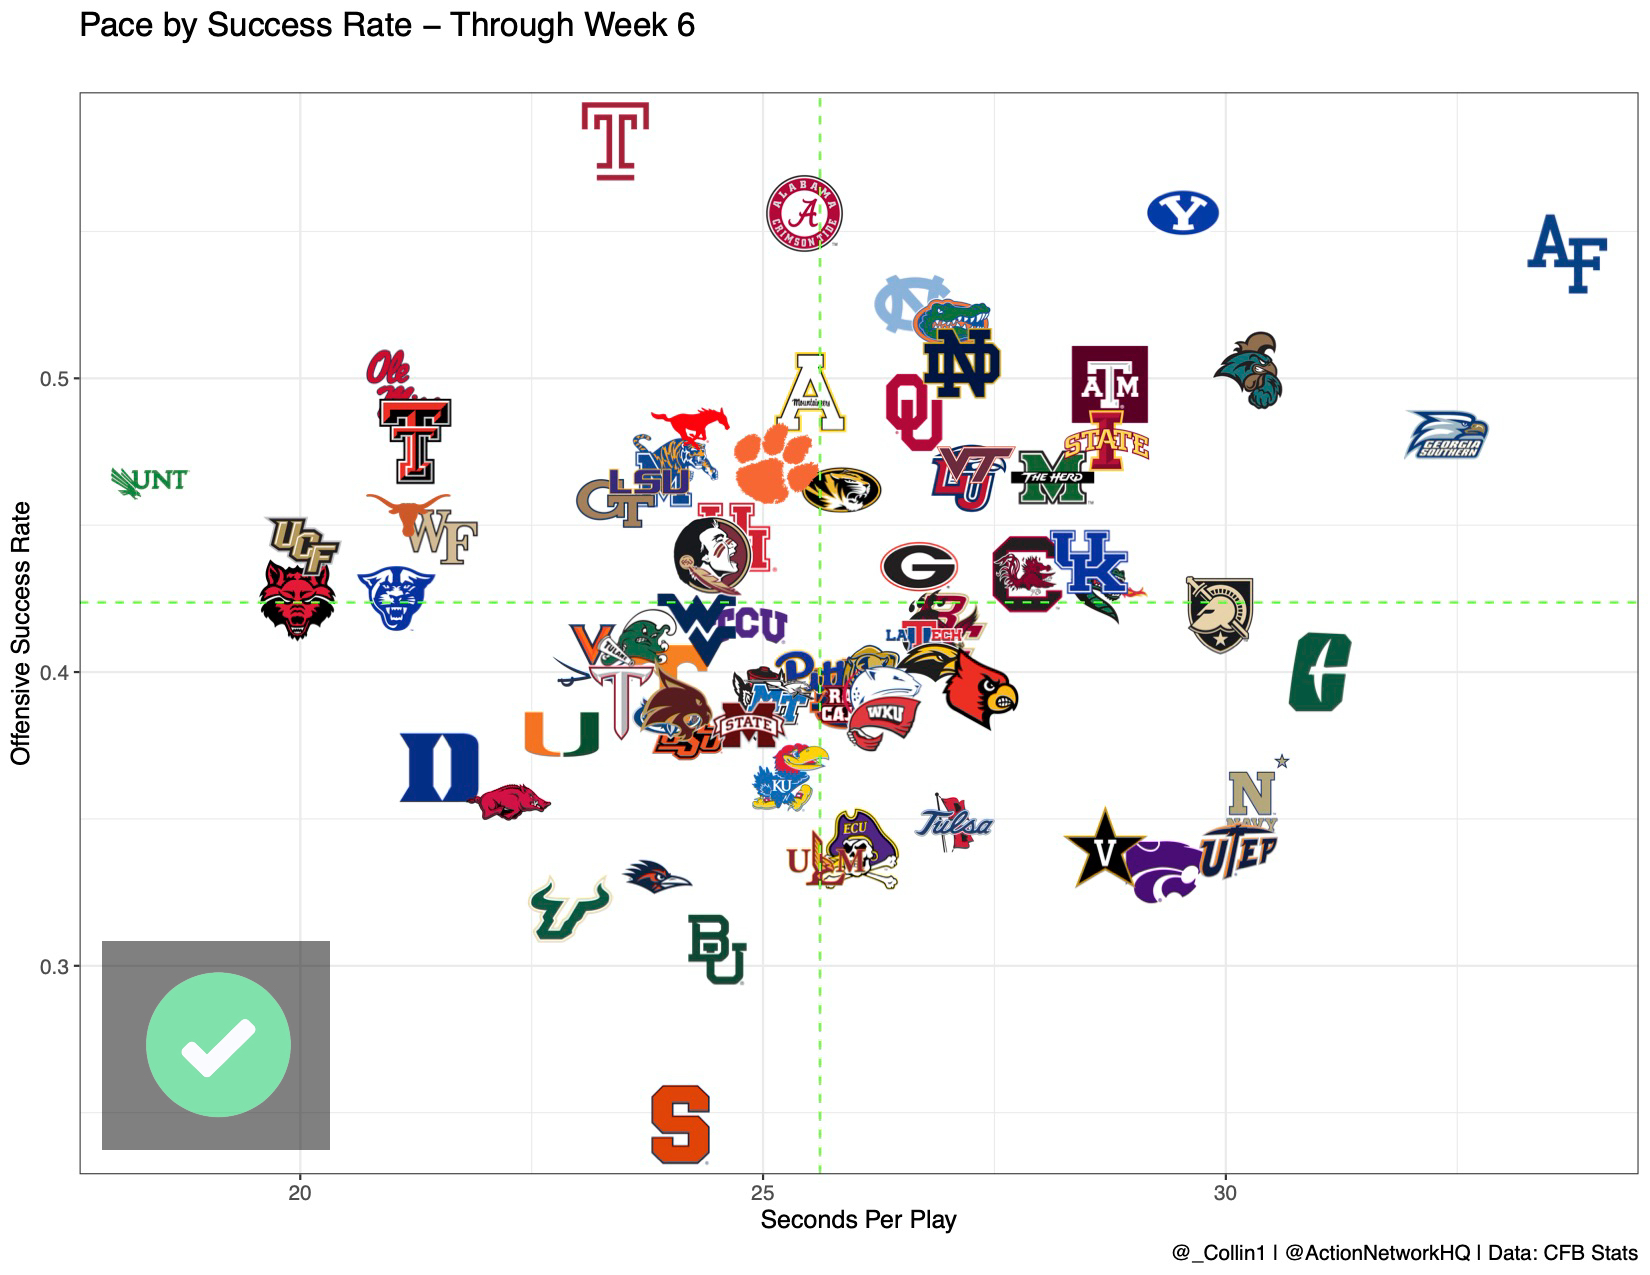
Alabama continues to ascend in offensive success rate and any team looking to speed up the pace will produce an easy Over wager. One team of notice is Arkansas, who has increased offensive success rate per week with a pace that approaches the level of Ole Miss. Feleipe Franks threw for more than 300 yards and four touchdowns in terrible weather conditions against Auburn in Week 6 action.
Two weeks straight?!?! Feleipe Franks goes deep to take the late lead on Auburn @RazorbackFB | #WPS 🐗🐗🐗pic.twitter.com/tnkeckjKgx
— Collin Wilson (@_Collin1) October 10, 2020
Here are the full projections for Totals on Week 7:
Team Notes on Total Wagers
- Two teams struggling to get points on the board is Auburn and South Carolina. The Gamecocks are 61st in seconds per play and rank 48th in finishing drives. The Tigers have similar issues scoring points, with a rank of 54th in finishing drives.
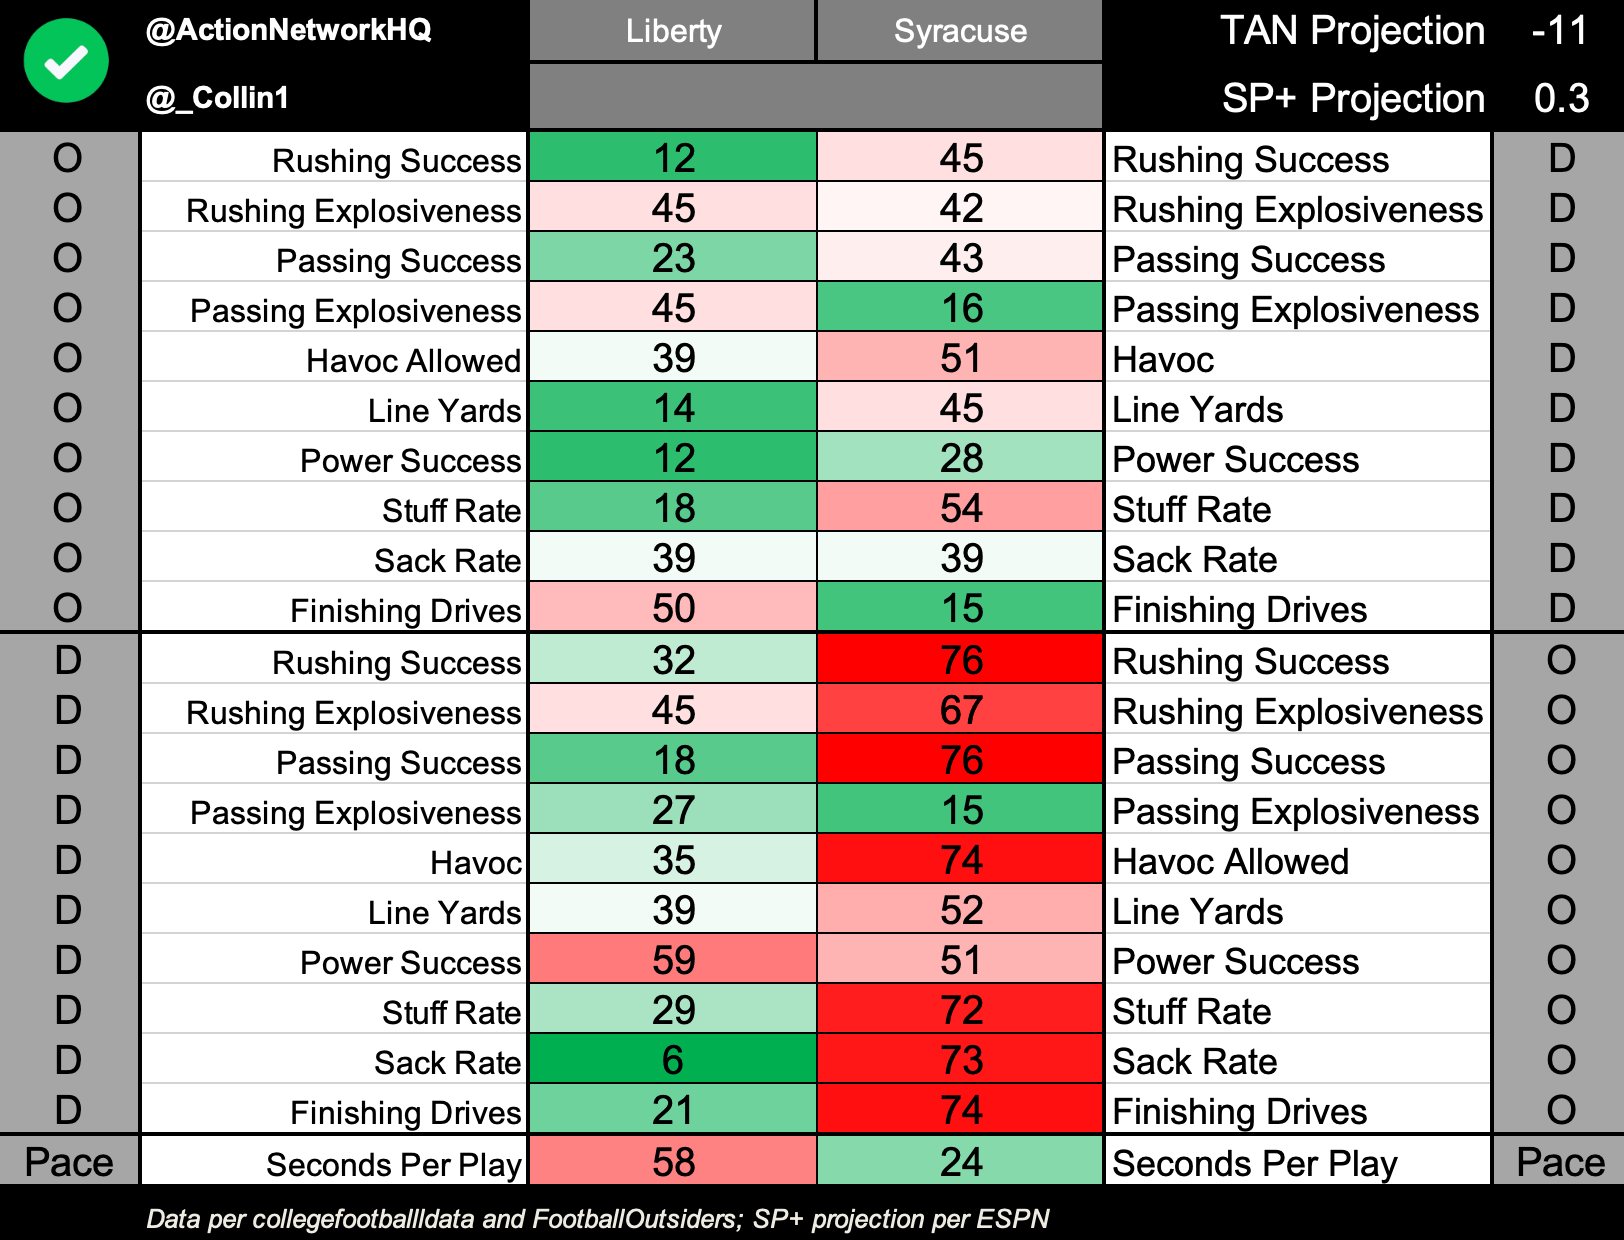
- Besides issues mentioned above, both the Orange and Flames have reasons for an Under ticket. Both Syracuse and Liberty rank top 21 in defensive finishing drives. Do not expect any kind of pace from Hugh Freeze's new look offense, ranking 58th in seconds per play.
- The projection says 60, while Sagarin says 71 for Ole Miss and Arkansas. As I said on the Action Network Podcast, we can throw Ole Miss numbers out the door as they are wrecking advanced analytics. We do know the Razorbacks are uptempo and the Rebels defense is the worst in the nation in finishing drives.
![]()
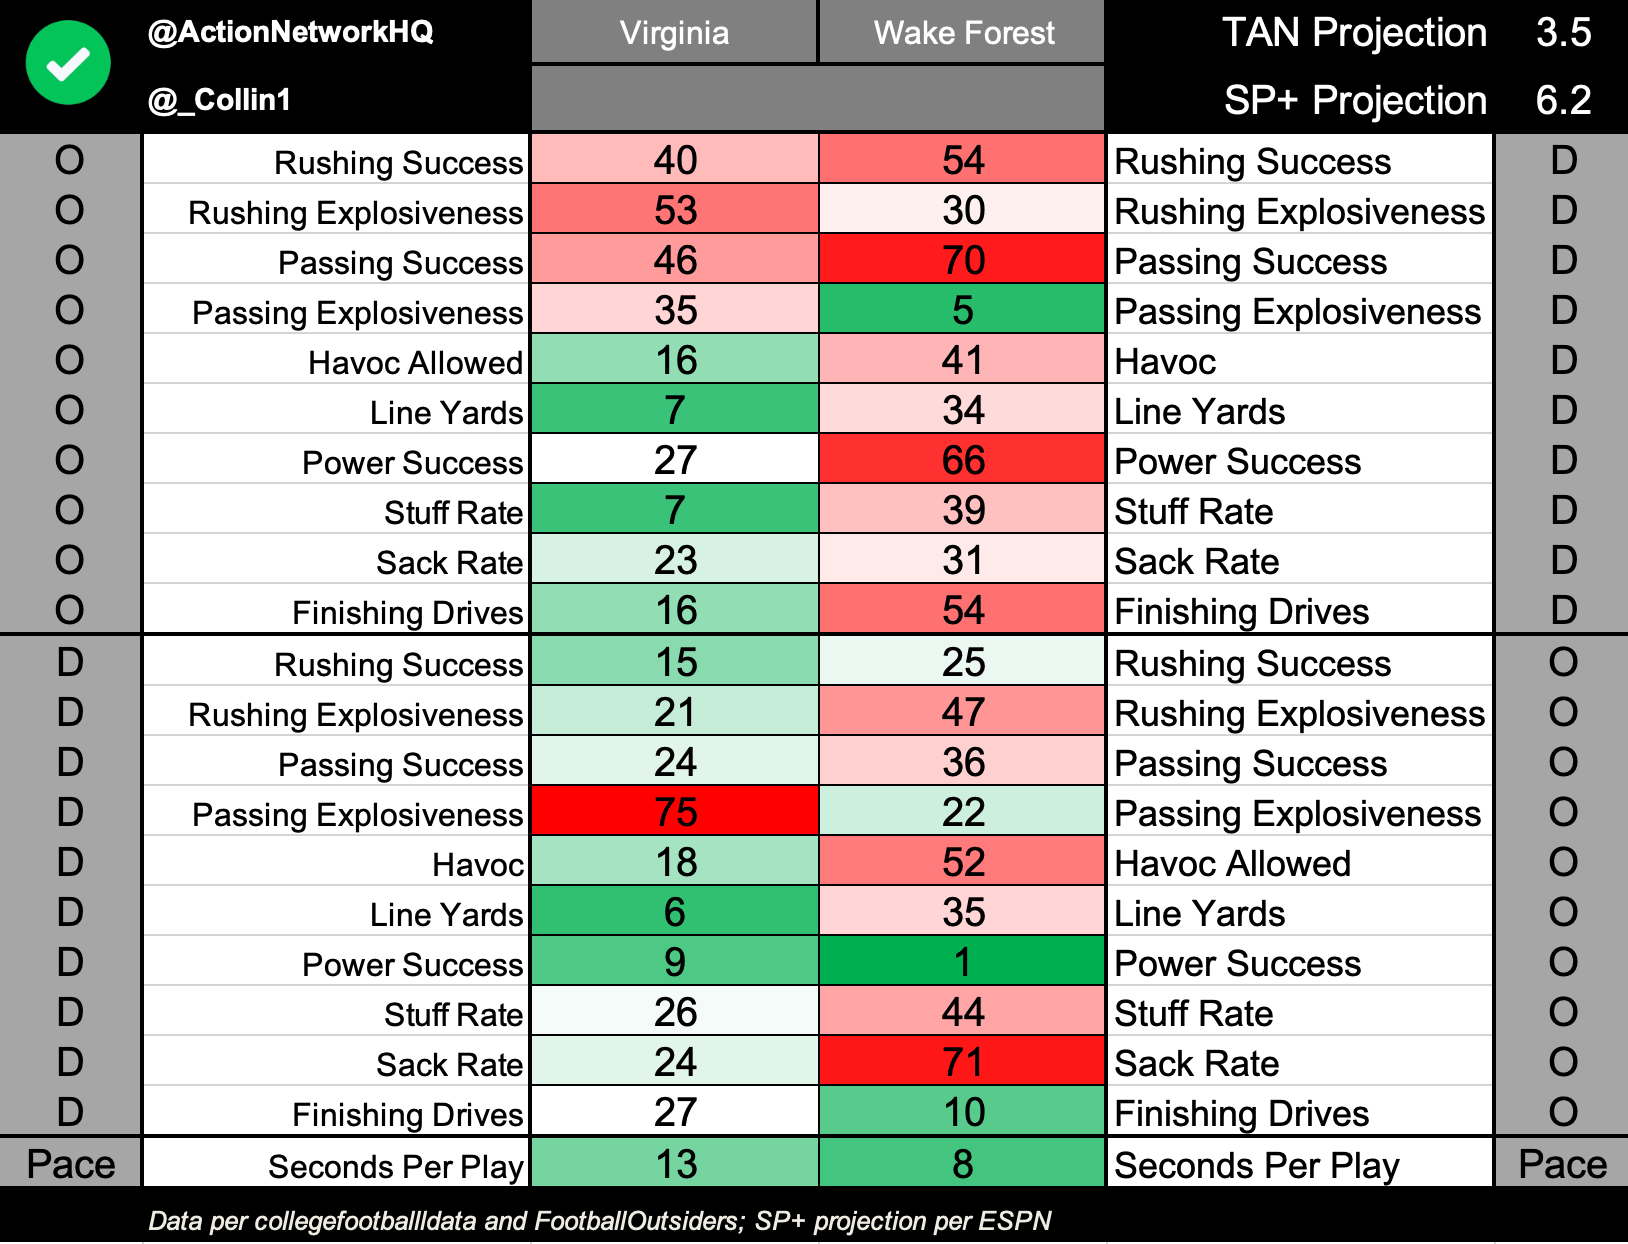
- Whether Brennan Armstrong or Lindell Stone lineup under center for Virginia, the Wahoos will continue an uptempo offense. Both the Cavaliers and Wake Forest rank top 13 in seconds per play and top 16 in offensive finishing drives. The Demon Deacons pass explosiveness should help get this Over to the window.

Check out our new NCAAF PRO Report, where we highlight factors that provide betting edges — like large wagers, historically profitable betting systems, model projections and expert picks — that when combined with sharp money can powerfully detail the smartest bets on a given slate.
Terms to Know
Postgame Win Expectancy is a calculation of all variables in a box score that dictate who would win the game if it was played a high number of times. Turnover luck, success rate and yards per play are notable components of this calculation and can influence a single game. But over a large sample, the team that moved the ball better would win more often than not.
There have been plenty of box scores in which a team wins as an underdog, but a negative value is applied to that team's power rating because the result was fluky rather than systematic.
Coach scheme changes can adjust a power rating quickly. For example, Oregon will undergo a change from Marcus Arroyo's conservative play-calling to new offensive coordinator Joe Moorhead's system. Moorhead's offense features a heavy dose of 11 personnel, West Coast spread concepts and modern RPOs.
That offensive philosophy has led to more explosiveness and higher rates of success on standard downs at each of Moorhead's previous stops at Penn State and Mississippi State. In a situation like this, a power rating can be useful to quickly adjust a team's forecast for future games. In the case of Mike Leach, an adjustment of totals is coming with an increase in plays per game.
Success Rate and Explosiveness were first defined in Bill Connelly's Five Factors and are strong indicators for future box scores. While EPA (Expected Points Added) and IsoPPP (Isolated Points Per Play) can be highly variable from season to season, Success Rate is a stable data point for handicappers to use for projections.
Simply put, if a team consistently achieves the desired amount of yards — determined by down and distance — then this is a "play-on" team with your bankroll. Texas A&M ranked 17th in offensive success rate last season and returns 80% of its offensive production for 2020; that combination makes the Aggies a play-on team.
As Week 7 approaches, we'll be keeping track of all these variables in and out of the box score. Be sure to bookmark our power ratings for the latest update on all FBS and FCS teams playing this fall.


