


Every year, millions of us tune in to watch the biggest games on earth. But no matter the sport, the teams, or the city, the real main event isn't happening on the field- it’s happening on the table, right next to a mountain of empty wing boxes.
In fact, big game days are some of the busiest days for chicken wing restaurants.
To find out where wing mania burns the hottest, we analyzed Google Trends search data during the year's biggest sporting events, mapped out monthly consumer menu divisions (Bone-In vs. Boneless searches), and pitted local menu pricing against cost of living to find where wings are the most affordable.
All of this together gave us the most chicken wing obsessed states.
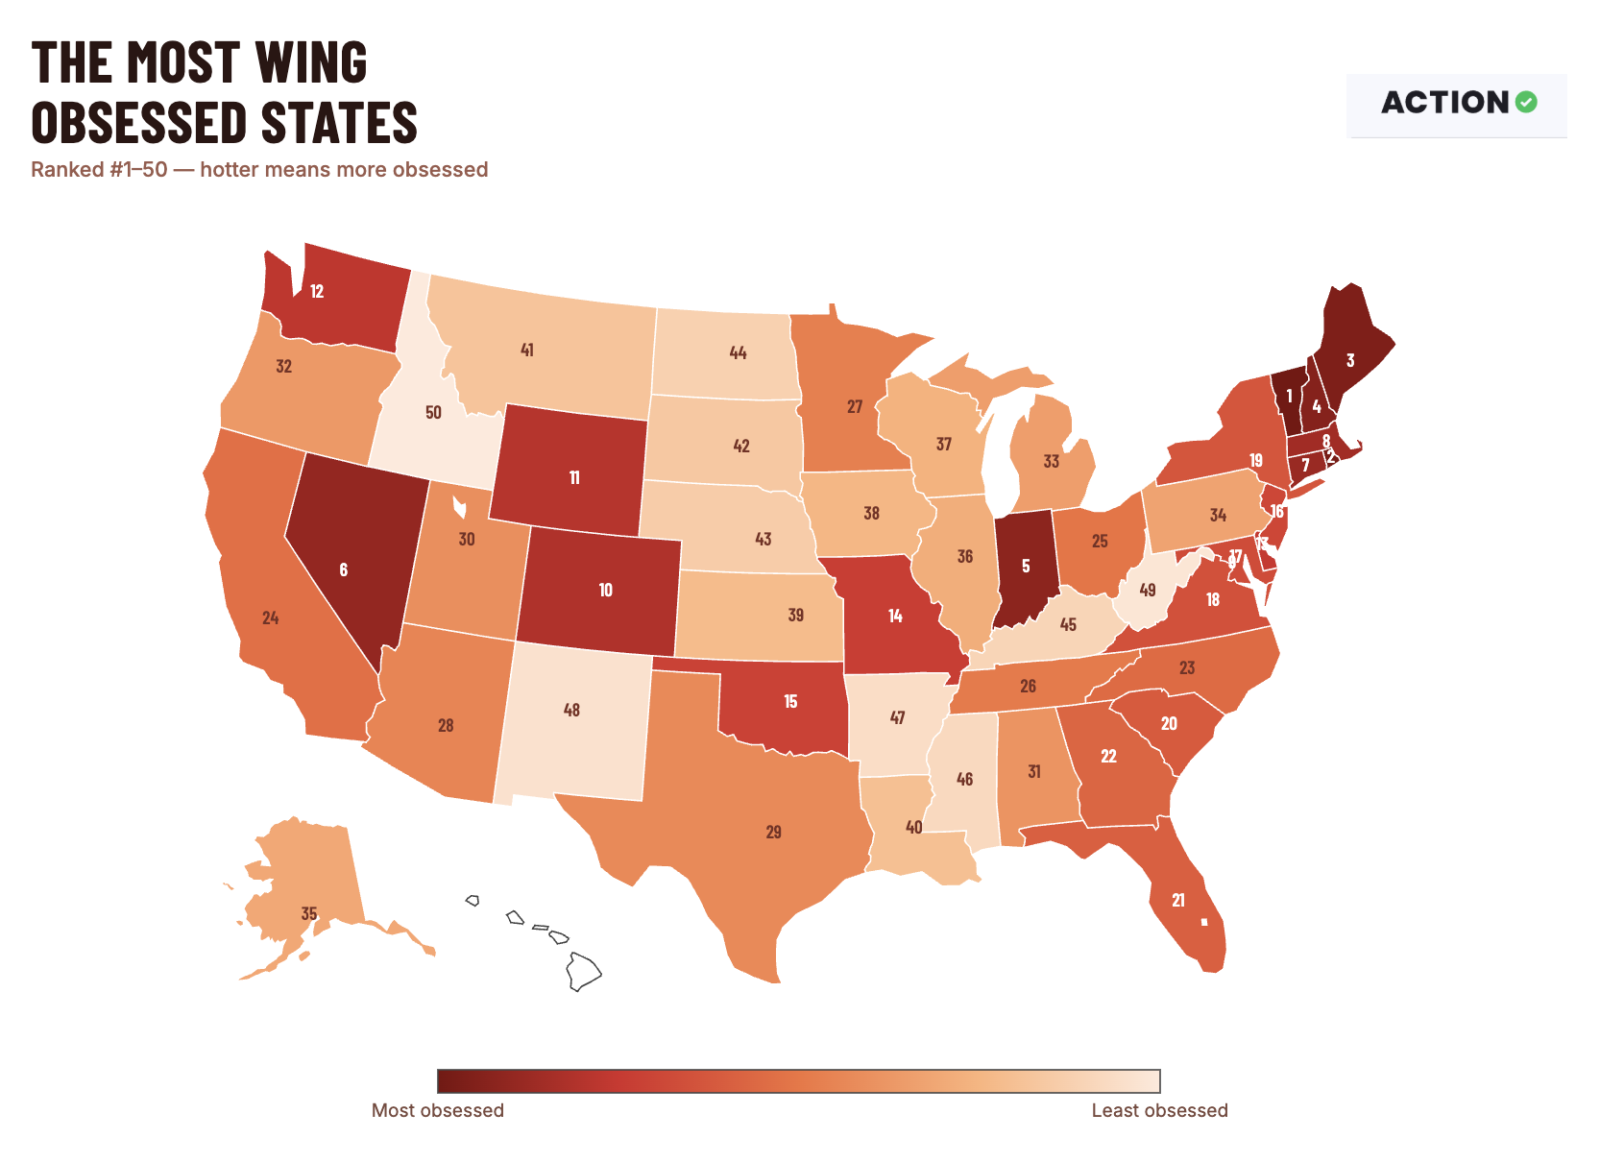
Below, you’ll see a map of each state's wing obsession. Continue reading for the full ranking, plus the sporting events that drive the most demand.
Key Findings
- Vermont ranks #1 as the most game-day wing-obsessed state in America.
- The NBA Finals (June 13, 2026) was the single biggest peak driver of wing searches across major states like Texas, California, Florida, and Ohio.
- Boneless wings completely dominate: Boneless chicken searches beat traditional bone-in wings in all 50 states.
- Washington, D.C. is the most economically efficient place to buy a feast. Thanks to high average earnings, D.C. sports fans only have to work 7.7 minutes to afford a 16-wing basket.
- West Virginia (#49) and Idaho (#50) wrap up the bottom of the overall index, dragged down heavily by low event search volumes or steep affordability ratios.
The Top 10 States for Game-Day Wing Intensity
1. Vermont
- Sports Obsession Score: 100
- Peak Event: Super Bowl (Feb 8, 2026)
- Minutes of Work to Afford a Basket: 12.92
Vermont is the undisputed, heavyweight champion of game-day wings. The Green Mountain State lacks a major pro sports franchise, but its fans compensate with unmatched search volume spikes during the Super Bowl, hitting a perfect 100 on the obsession scale. Vermont also boasts an incredibly high "Purist Culture Score" (33.3%), meaning they harbor one of the largest concentrations of traditional bone-in wing lovers in the country.
2. Rhode Island
- Sports Obsession Score: 77
- Peak Event: Super Bowl (Feb 8, 2026)
- Minutes of Work to Afford a Basket: 12.05
Rhode Island takes the runner-up spot by pairing an elite Super Bowl interest spike (77.00) with highly resilient local wage data. Ocean State fans can lock down their game-day catering baskets comfortably, requiring just over 12 minutes of labor time to fund a double-digit basket split between Pizza Hut and Buffalo Wild Wings.
3. Maine
- Sports Obsession Score: 73
- Peak Event: Super Bowl (Feb 8, 2026)
- Minutes of Work to Afford a Basket: 12.82
New England secures a clean sweep of the podium. Much like its neighbors, Maine sees massive search volume when the Super Bowl rolls around (73.00). They also run surprisingly high on traditional bone-in preferences (22.2%) compared to the rest of the nation, cementing their status as deep-rooted wing traditionalists.
4. New Hampshire
- Sports Obsession Score: 80
- Peak Event: Super Bowl (Feb 8, 2026)
- Minutes of Work to Afford a Basket: 12.37
Rounding out the northern block, New Hampshire stands tall at #4. Its raw sports obsession score sits at a massive 80.00 on game days, and a solid local wage floor ensures that ordering a massive platter of Honey BBQ flats and drums doesn't put a painful dent in the wallet.
5. Indiana
- Sports Obsession Score: 62
- Peak Event: CFP Championship (Jan 19, 2026)
- Minutes of Work to Afford a Basket: 13.53
The first non-New England state to crack the top tier breaks the Super Bowl mold. In Indiana, the College Football Playoff Championship reigns supreme as the primary wing-ordering catalyst. Hoosiers log an elite event interest level of 62.00, keeping local delivery drivers working overtime in the dead of winter.
6. Nevada
- Sports Obsession Score: 62.5
- Peak Event: CFP Championship (Jan 19, 2026)
- Minutes of Work to Afford a Basket: 12.98
Las Vegas is a massive delivery-centric hub, and it shows. Nevada hits near-identical scores to Indiana, peaking sharply during college football's biggest night. With plenty of local watch parties and sporting events happening simultaneously, the "skip cooking and order wings" default option is incredibly strong here.
7. Connecticut
- Sports Obsession Score: 58.5
- Peak Event: Super Bowl (Feb 8, 2026)
- Minutes of Work to Afford a Basket: 11.05
Connecticut positions itself as an economic wing engine. While their search interest spikes for the Super Bowl, their defining advantage is high local hourly wages ($39.87). It takes just 11.05 minutes of labor for an average worker to clear the cost of a multi-sauce game-day basket.
8. Massachusetts
- Sports Obsession Score: 48.25
- Peak Event: Super Bowl (Feb 8, 2026)
- Minutes of Work to Afford a Basket: 10.25
Massachusetts presents a fascinating data split. They possess one of the lowest traditional bone-in scores in America—meaning they have completely surrendered to boneless chicken dominance (87% lead). However, an exceptionally high wage baseline means citizens need less than ten and a half minutes of work to secure their food.
9. District of Columbia
- Sports Obsession Score: 27
- Peak Event: Super Bowl (Feb 8, 2026)
- Minutes of Work to Afford a Basket: 7.70
D.C. is an economic anomaly. They technically have some of the lowest raw game-day search spikes in the country (scoring just 27.00 on the obsession index). Yet, because the average hourly earning rate sits at a staggering $58.18, D.C. is hands-down the easiest place in America to effortlessly finance a massive sports feast.
10. Colorado
- Sports Obsession Score: 44.75
- Peak Event: March Madness Final (Apr 6, 2026)
- Minutes of Work to Afford a Basket: 10.92
Colorado rounds out the top 10 by proving to be a massive college basketball stronghold. Their wing passion hits its absolute apex during the March Madness National Championship game in April, outperforming the Super Bowl and NBA Finals in local search interest.
The Unsung Engine: The NBA Finals Surge
While casual sports marketing campaigns tend to dump millions into Super Bowl promos, our index shows that the NBA Finals (June 13, 2026) is the secret backbone of the entire wing industry.
The NBA Finals served as the single largest peak volume trigger for wing demand in a staggering number of highly populated, crucial consumer states:
- California (NBA Finals Peak, 27.25 baseline interest)
- Texas (NBA Finals Peak, 32.50 baseline interest)
- Florida (NBA Finals Peak, 44.75 baseline interest)
- Ohio (NBA Finals Peak, 51.75 baseline interest)
- North Carolina (NBA Finals Peak, 52.75 baseline interest)
Because the NBA Finals span a multi-game series rather than a singular Sunday afternoon, it generates a massive, sustained baseline of restaurant traffic across the Sun Belt and Midwest.
The Bone-In vs. Boneless Search Divide
If you thought the cultural war between traditional bone-in flats and boneless wing sauced-nuggets was a close battle, the Google search data paints a complete blowout. Boneless wings won all 50 states without dropping a single jurisdiction.
The highest concentrations of boneless wing devotion are clustered in the northeast and midwest, with Massachusetts (87.0% lead), New York (85.8% lead), and Kansas (85.2% lead) near-entirely phasing traditional wings out of high-intent search volumes.
The only regions keeping the classic, traditional wing house identity alive are Wyoming (boasting the highest bone-in share in the U.S. at 40.0%), followed by Vermont (33.3%) and Alaska (33.3%).
Wings And Sports Just Go Together
Let’s be real, sports and yummy foods just go together. Why make a big mess cooking (and potentially miss big game moments) when you can just order a bunch of wings and sit back in take in the game. While NBA games and the Super Bowl tend to drive the most wing demand, sports of all kinds have their fans hankering for buffalo sauce.
If you like to pair your sports (and wings) with bets, be sure to check out these World Cup betting promos if you're in one of the legal sports betting states. Sadly, we have no wing coupons to offer.
Master Leaderboard: Every U.S. State Ranked, From Most Wing-Obsessed To Least
| Rank | State | Obsession Score (40%) | Peak Event | Minutes of Work to Afford |
| 1 | Vermont | 100 | Super Bowl (Feb 8) | 12.92 |
| 2 | Rhode Island | 77 | Super Bowl (Feb 8) | 12.05 |
| 3 | Maine | 73 | Super Bowl (Feb 8) | 12.82 |
| 4 | New Hampshire | 80 | Super Bowl (Feb 8) | 12.37 |
| 5 | Indiana | 62 | CFP Championship (Jan 19) | 13.53 |
| 6 | Nevada | 62.5 | CFP Championship (Jan 19) | 12.98 |
| 7 | Connecticut | 58.5 | Super Bowl (Feb 8) | 11.05 |
| 8 | Massachusetts | 48.25 | Super Bowl (Feb 8) | 10.25 |
| 9 | District of Columbia | 27 | Super Bowl (Feb 8) | 7.7 |
| 10 | Colorado | 44.75 | March Madness Final (Apr 6) | 10.92 |
| 11 | Wyoming | 31 | Super Bowl (Feb 8) | 13.71 |
| 12 | Washington | 37.25 | March Madness Final (Apr 6) | 10.85 |
| 13 | Delaware | 40 | Super Bowl (Feb 8) | 13.03 |
| 14 | Missouri | 56.5 | March Madness Final (Apr 6) | 12.51 |
| 15 | Oklahoma | 57.33 | March Madness Final (Apr 6) | 13.53 |
| 16 | New Jersey | 43.67 | NBA Finals (Jun 13) | 11.99 |
| 17 | Maryland | 48.25 | NBA Finals (Jun 13) | 11.71 |
| 18 | Virginia | 47.75 | NBA Finals (Jun 13) | 10.83 |
| 19 | New York | 43.25 | CFP Championship (Jan 19) | 11.75 |
| 20 | South Carolina | 64.33 | CFP Championship (Jan 19) | 14.37 |
| 21 | Florida | 44.75 | NBA Finals (Jun 13) | 11.81 |
| 22 | Georgia | 47 | CFP Championship (Jan 19) | 11.97 |
| 23 | North Carolina | 52.75 | NBA Finals (Jun 13) | 12.05 |
| 24 | California | 27.25 | NBA Finals (Jun 13) | 11.98 |
| 25 | Ohio | 51.75 | NBA Finals (Jun 13) | 13 |
| 26 | Tennessee | 46.25 | NBA Finals (Jun 13) | 13.12 |
| 27 | Minnesota | 44.75 | NBA Finals (Jun 13) | 10.38 |
| 28 | Arizona | 38.75 | NBA Finals (Jun 13) | 11.61 |
| 29 | Texas | 32.5 | NBA Finals (Jun 13) | 12.4 |
| 30 | Utah | 38 | Super Bowl (Feb 8) | 12.48 |
| 31 | Alabama | 44 | NBA Finals (Jun 13) | 12.81 |
| 32 | Oregon | 40 | Super Bowl (Feb 8) | 12.4 |
| 33 | Michigan | 41.75 | NBA Finals (Jun 13) | 12.78 |
| 34 | Pennsylvania | 44.25 | NBA Finals (Jun 13) | 12.57 |
| 35 | Alaska | 50 | Super Bowl (Feb 8) | 12.73 |
| 36 | Illinois | 32 | CFP Championship (Jan 19) | 12.87 |
| 37 | Wisconsin | 38.75 | NBA Finals (Jun 13) | 13.19 |
| 38 | Iowa | 57.5 | NBA Finals (Jun 13) | 13.78 |
| 39 | Kansas | 43.5 | NBA Finals (Jun 13) | 12.88 |
| 40 | Louisiana | 41.67 | NBA Finals (Jun 13) | 13.22 |
| 41 | Montana | 53 | Super Bowl (Feb 8) | 13.44 |
| 42 | South Dakota | 43 | Super Bowl (Feb 8) | 13.23 |
| 43 | Nebraska | 35 | Super Bowl (Feb 8) | 13.19 |
| 44 | North Dakota | 37 | Super Bowl (Feb 8) | 11.8 |
| 45 | Kentucky | 49 | CFP Championship (Jan 19) | 14.46 |
| 46 | Mississippi | 66 | NBA Finals (Jun 13) | 14.94 |
| 47 | Arkansas | 33 | Super Bowl (Feb 8) | 14.3 |
| 48 | New Mexico | 29 | Super Bowl (Feb 8) | 13.69 |
| 49 | West Virginia | 51 | Super Bowl (Feb 8) | 14.96 |
| 50 | Idaho | 67.5 | CFP Championship (Jan 19) | 11.85 |
Methodology
This data tracks high-intent sports search and structural dining economies across all 50 states and Washington, D.C.
To compute the final Unified Wing Index, three distinct datasets were cleaned and balanced dynamically:
- Obsession Demand Score (40% Weight): Calculated using localized Google Trends search volumes normalized specifically within localized event windows for the 2026 Super Bowl, CFP Championship, March Madness Finals, and NBA Finals.
- Purist Culture Score (30% Weight): Drawn from Google Keyword Planner monthly search data tracking the volume ratios of traditional/bone-in wing queries versus boneless chicken terms. Higher traditional shares scored higher to isolate traditional chicken-wing strongholds.
- Affordability Score (30% Weight): Established by taking local average menu pricing for a standard wing basket across national restaurant footprints (Buffalo Wild Wings and Pizza Hut) and cross-referencing it directly against localized average hourly earnings. High affordability states (least minutes of work required to purchase a basket) received a higher score.
You can see the full dataset here.


