


The first half of the NBA season has already seen some wild circumstances, but now it is time to move to the second half.
The Detroit Pistons have the best straight up record in the NBA. The Sacramento Kings have lost 14 consecutive games outright coming out of the All-Star break. The Phoenix Suns have already eclipsed their win total.
Let's explore some more NBA betting trends, stats, notes, outliers, and more to preview what's left in the regular season.
All data, stats and trends are updated as of Wednesday, February 18, at 2 p.m. ET. Credit to Bet Labs, SDQL and Sports Odds History for a lot of the betting queries.
NBA Betting Trends, Stats, Notes

Dog Day
Outright Success
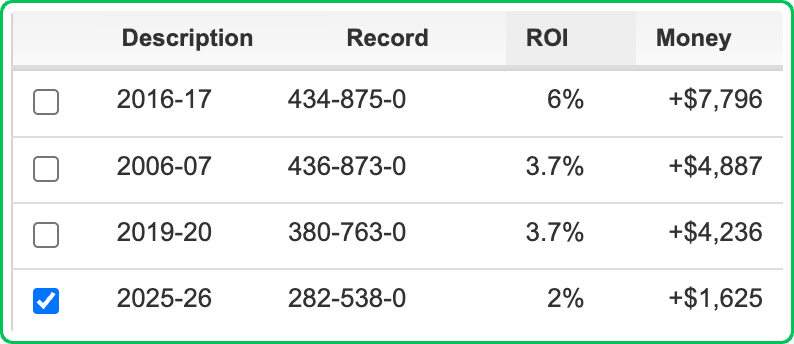
NBA underdogs on the moneyline so far this season have produced a 2% ROI with a $100 bettor up $1,625, which would be the 4th-best mark over a full season since 2005 and the best mark since 2019.
Piston Power
Kings of the East
The Pistons are on top of the NBA world… entering the All-Star break that is.
But there's still a long way to go.
For the first time since 2006-07, the Pistons entered the All-Star break sitting atop the East.
Two years ago, the Pistons were 8-46 at the break, after losing 28 straight games and 35 out of 36 games — a truly remarkable turnaround.
This season, Detroit is 14-2 SU vs. teams with a winning percentage of 60% or better.
The only team in the last decade with a mark close to Detroit's against teams at 60% or better entering the All-Star break was the Thunder last year at 15-3 SU — a team that went on to win the title.
Another stat that puts the Pistons' success into perspective is the fact that they are 9-1 SU and ATS as underdogs this season.
The rest of the NBA is 273-537 SU (33.7%) as underdogs this year.
Kings' Tankathon
Sacramento's Struggles Continue
What the Kings have done this season to enter the All-Star break with the league's worst record should be a crime.
Amazingly enough, the Kings have been their worst against the worst teams in the league, which is probably not an accident.
Kings Straight Up Record This Season
| Opponent | SU Record |
|---|---|
| vs. Teams 50% or Less: | 2-16 SU |
| vs. Teams 55% or Less: | 2-22 SU |
| vs. Teams 60% or Less: | 3-27 SU |
| vs. Teams Above 60%: | 9-16 SU |

After The Break
Superlative Time
Playing after the All-Star break means coming off some extended rest and prep time for coaches, players and teams.
When looking at how coaches perform against the spread on extended prep time, this would be the moment in this week's games.
• Of 106 NBA head coaches since 2005, Doc Rivers' 13-4 ATS mark is the best of any head coach on 7+ days rest/prep time. The 2nd-best in that department is Erik Spoelstra, who is 14-5 ATS on the extended rest period.
• On the other end of the spectrum, here are coaches that have struggled ATS on longer rest/prep time: Quin Snyder's teams are just 4-8 ATS on 7+ days rest. The three other names that belong on this side of the list are Kenny Atkinson at 2-5 ATS, JB Bickerstaff at 3-6 ATS, and Will Hardy, who is winless, at 0-3 ATS.

Win Total Update
Phoenix On Top Of The Sun
Exiting the All-Star break, here is where we sit for updated NBA win totals from preseason numbers.
Only one team has eclipsed their win total: the Phoenix Suns — which we will discuss more below.
No teams have officially gone under yet, but the Clippers, Cavaliers and Pacers are close.
Close To The Over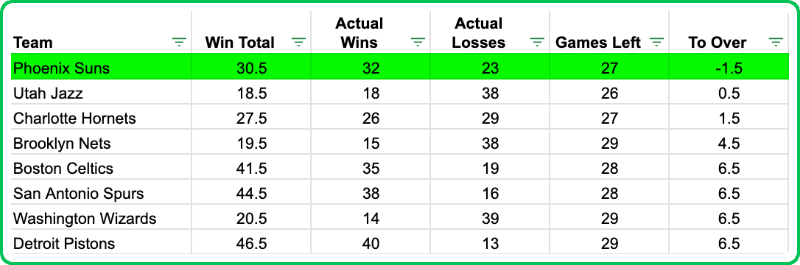
Close To The Under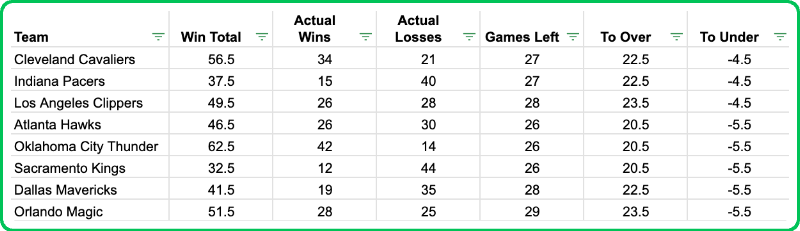
Eclipse The Sun
Phoenix Over
The Phoenix Suns eclipsed their preseason win total in their 51st game of the season, five games before they even entered the All-Star break.
Since 2000, only 15 teams have eclipsed their preseason win total in the 51st game or earlier, including the Suns this season.
Of those 15 teams, only the 2025-26 Phoenix Suns and the 2004-05 Seattle Supersonics had a win total of 30+ and still went over in their 51st game or earlier.

Top and Bottom
Where Thunder & Jazz Sit
Entering the 2025 season, we had some serious outliers in the win total market.
• Utah has 18 wins at the All-Star break — one win away from eclipsing their win total, which would mean the five-lowest win totals since 2000 all went over.
• The Thunder need 21 wins to go over their win total with 26 games left to play. If they get up to six losses, they would go under their win total, which would follow history for high win totals.
Double Trouble
Thunder as Big Favorites
There's a few different ways to look at this.
So far this season, we have seen 176 games where there has been a double-digit favorite — the Thunder have been that team in 20% of those games (35 of 176).
Oklahoma City is 27-8 SU and 17-18 ATS as a double-digit favorite.
The Thunder's eight losses as double-digit favorites in their first 56 games are the most for any team in the last 30 years.
Of course, Oklahoma City is a double-digit favorite in its first game back from the All-Star break on Friday night vs. Mavericks.
Part of the reason for the Thunder's record as double-digit favorites is their average spread per game this season, which sits at an absurd -11 in their 56 games played.
If the Thunder hold that -11 mark for the entire regular season, it would match the 1996 Bulls for the highest mark for any team over the last 30 years.
Gone in 60 Seconds
Disappointing Cavaliers
The Cavaliers won 64 games outright last season, the 2nd-most in the NBA behind just the NBA champion Thunder.
However, Cleveland has certainly had issues covering the spread this season.
The Cavs are 23-32 ATS this season, the 3rd-worst mark in the NBA; a $100 bettor would be down $1,108 if they took the Cavs every game for a -20.2% ROI on the season.
Since 2000, here are the worst ATS teams the season after winning 60+ games — often coming up short when it comes to expectations: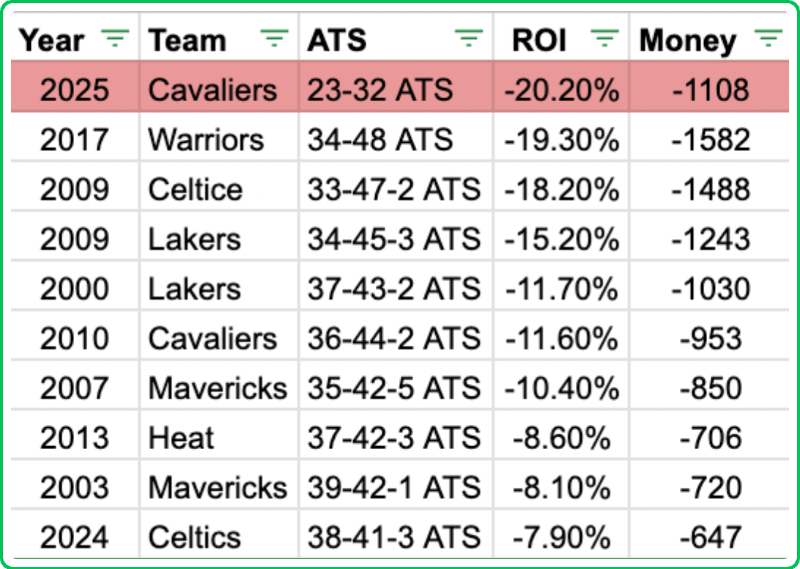

Falling Unders
Staying Low
At the All-Star break, NBA Unders are 423-396-1 (51.6%).
In the first half of the season, the real value lied with falling totals.
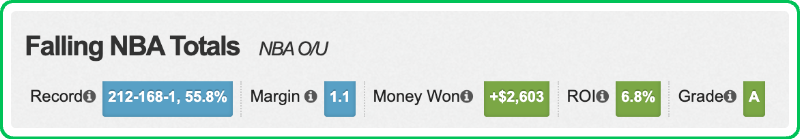
When the over/under drops between the opening and closing lines — for example, if the total opens 230 and closes 228 — the under is 212-168-1 (55.8%) this season.
A $100 bettor taking each of those totals would be up $2,603 for a +6.8% ROI.
That would be the 2nd-best mark over a full season in the 22-year history of the Bet Labs database, just behind 2017.
When it comes to falling totals, two teams who have exceeded expectations.
• In Hornets games where the O/U drops from the opening to closing lines, the under is 19-5.
• In Pistons games where the O/U drops from the opening to closing lines, the under is 21-7-1.
No Rest for Washington
Wizards' Back-to-Back Struggles
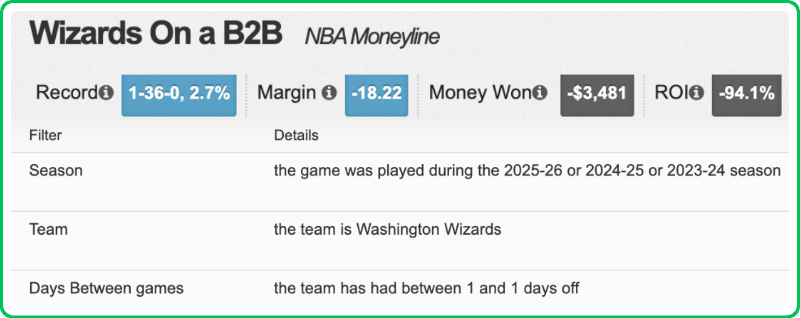
There is only one team in the NBA this season that has yet to win a game outright when playing a game on back-to-back days — the Washington Wizards, who are 0-9 straight up this season playing on a back-to-back.
The rest of the NBA is actually six games above .500 SU when playing on a back-to-back this season, going 141-135 SU.
This isn't a new trend for the Wizards.
Over the last three seasons, Washington is an amazing 1-36 SU playing on a back-to-back, losing by 18.2 points per game.
Washington's lone B2B win came at home last February against the Nets.
Washington has lost 14 consecutive games outright on a back-to-back entering the All-Star break.
Running Behind
Bulls Bad Favorites
This season, the Chicago Bulls haven't been great. They entered the All-Star break 11th in the East with a 24-31 SU record.
Chicago has had the most trouble when the expectations have been high, as a favorite.
The Bulls are 10-14 SU as favorites this season; a $100 bettor would be down $830 taking Chicago on the moneyline as favorites every game, the worst mark of any team in the NBA.
Chicago hasn't finished a full regular season under .500 SU as a favorite since 2000, when the Bulls were only favorites in four total games and went 1-3 SU.

Garden of Eden
New York's Home Dominance
Even after the Knicks terrible home loss to the Pacers before the All-Star break, New York is 19-9 ATS at Madison Square Garden this season, the best home mark for any team in the NBA.
In fact, New York's 67.9% ATS winning percentage at home would be the Knicks' best home ATS winning percentage in a full regular season in the last 30 years if they continue at this rate the rest of the way.
The Knicks have 12 home games left during the regular season, starting as 3.5-point favorites against the Pistons on Thursday night at MSG.
Front Runners
Lakers Holding Steady
The Lakers have done a great job at holding leads late in games this year.
When the Lakers have led entering the fourth quarter this season, they are 24-0 straight up (22-2 ATS) over the full game — the only undefeated team in the NBA in that department.
Even if you look at holding a lead at the half, the Lakers are 20-1 SU (18-3 ATS) this season. Their 95.2% winning percentage when leading at the half is also the best of any team in the NBA.
One area where the Lakers have struggled this season is the role of the underdog.
The Lakers are 8-14 ATS as 'dogs, but they have lost 10 consecutive games ATS as an underdog dating back to before Christmas.
No Fight
Nets & Heat Have Trouble Mounting Comebacks
It has been nearly impossible for certain teams to come back late in games this season — the Nets and Heat specifically top this list.
The Nets are 1-32 SU over the full game when trailing entering the fourth quarter this year, the worst mark of any team in the NBA.
Meanwhile, the Heat are the 2nd-worst team in this category, sitting at 1-22 SU this year.
Brooklyn has been especially bad when it comes to coming back in games.
When the Nets have trailed by 10+ points at any point, they are 1-34 SU this season, also the worst mark in the NBA.

Public Struggles
Tough Season for the Joes
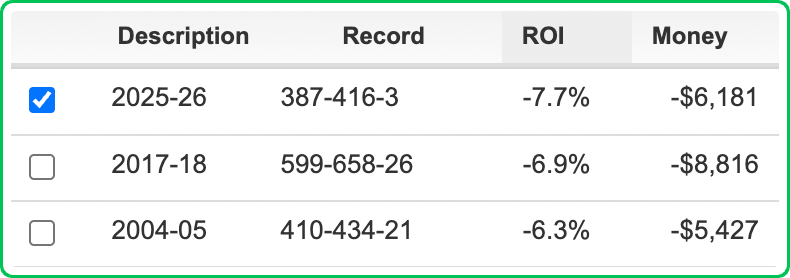
According to Action Network betting data, teams with 51% of spread tickets or more, which indicates the betting public, are 387-416-3 ATS (48.2%) entering the All-Star break this season.
From a ROI perspective, those public teams would have lost over $6,000 at $100 per bet if you bet them every game over the course of the season for a -7.7% ROI.
If that -7.7% ROI holds up over the second half of the season, it would be the worst mark in the 22-year history of the Bet Labs database.
Where the betting public has really struggled is when they are on the side of the favorite.
When favorites have 51%+ of the spread tickets backing them this season, they are 212-244-2 ATS for a -10.8% ROI.
Fighting Back
Hornets' Rebound
Over the last few months, there hasn't been a better story across the NBA than the Charlotte Hornets, who currently sit 9th in the Eastern Conference.
The Hornets own the longest active drought without a playoff appearance, sitting at nine consecutive years entering 2025-26.
• Since December 1, the Hornets are 23-12 ATS — the best mark of any team in the NBA.
• Since January 1, Hornets are 15-7 ATS — the best mark of any team in the NBA.
The Hornets are currently two wins away from eclipsing their preseason win total of 27.5, breaking a 3-year under streak in that department — the franchise's longest win total under streak in the last 30 years.
The Bounce-Back Spot
Heat Off A Loss
Classic Spoelstra.
This season, the Heat are 20-7 ATS off of an outright loss, the best mark of any team in the NBA. But this isn't something new for Spo and the Heat.
The Heat are .500 ATS or better off of a loss over the last five seasons — and in 14 of their last 15 seasons under Erik Spoelstra.
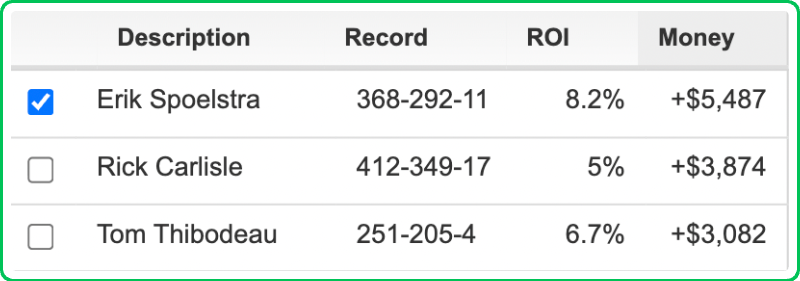
In the last 15 seasons, the Heat are 315-237-9 ATS (57.1%) under Spo when coming off of an outright loss, the best mark of any team in the NBA.
If you look over the last 20 years, Spoelstra is by far the best head coach against the spread off of a loss, with a decent gap ahead of Rick Carlisle.

Closing The Door
First Half vs. Second Half
This season, the Miami Heat are the class of the NBA when you look at the first half spread, going 38-18 1H ATS in the first half of the season.
If you look at the second half spread, the Dallas Mavericks lead the way at 33-21 2H ATS; the best mark in the NBA.
One thing I wanted to examine was the differential between each teams' first half ATS mark and their second half ATS mark and see who had the biggest discrepancies:
Good First Half, Tough Second Half
- Lakers: 57.7% 1H ATS vs. 37% 2H ATS = 21% difference
- Mavericks: 61.1% 1H ATS vs. 42.6% 2H ATS = 19% difference
- Cavaliers: 52.7% 1H ATS vs. 36.4% 2H ATS = 16% difference
- Timberwolves: 60% 1H ATS vs. 45.5% 2H ATS = 15% difference
- Blazers: 54.6% 1H ATS vs. 39.3% 2H ATS = 14% difference
Good Second Half, Tough First Half
- Sixers: 63% 2H ATS vs. 45.3% 1H ATS = 18% difference
- Spurs: 65.5% 2H ATS vs. 50.9% 1H ATS = 15% difference
- Celtics: 63% 2H ATS vs. 49.1% 1H ATS = 14% difference
- Heat: 67.9% 2H ATS vs. 54.6% 1H ATS = 13% difference
- Clippers: 57.4% 2H ATS vs. 44.4% 1H ATS = 13% difference

Through The Roof
High Totals
Entering the All-Star break, the average over/under in the NBA sits at 231, the highest mark for any season in the last 30 years — which has been a theme over the last decade.
In that span, we have seen an average over/under of 205 or more in a single season 11 times — all 11 have come since 2015.
Each and every season the totals just seem to keep getting higher and higher:
If you look at the average over/under every five seasons, the jump has been drastic.
| Season | Avg. O/U |
|---|---|
| 2025 | 231 |
| 2020 | 224.5 |
| 2015 | 205.1 |
| 2010 | 199.7 |
| 2005 | 193.8 |
| 2000 | 189.2 |


