


On Halloween night, every trick-or-treater hopes for a good candy haul. However, going door to door is a bit like roulette since you never know what you’re going to get.
Some doors will unveil true treats like Reese’s Peanut Butter Cups and Peanut M&Ms. Yet, other doors unleash quirky, less desirable candies like candy corn, raisins, and even toothbrushes.
Here at The Action Network, we like odds, and it got us thinking: What are your odds of getting each candy? Are some states more likely to hand out controversial candy corn?
Taking into account trick or treating habits, candy sales, and candy preferences, we found where trick or treaters are most likely to get candy corn- and what your odds are of getting a coveted Reese’s.
Fun Findings
- A trick-or-treater has a 22.52% chance of receiving candy corn.
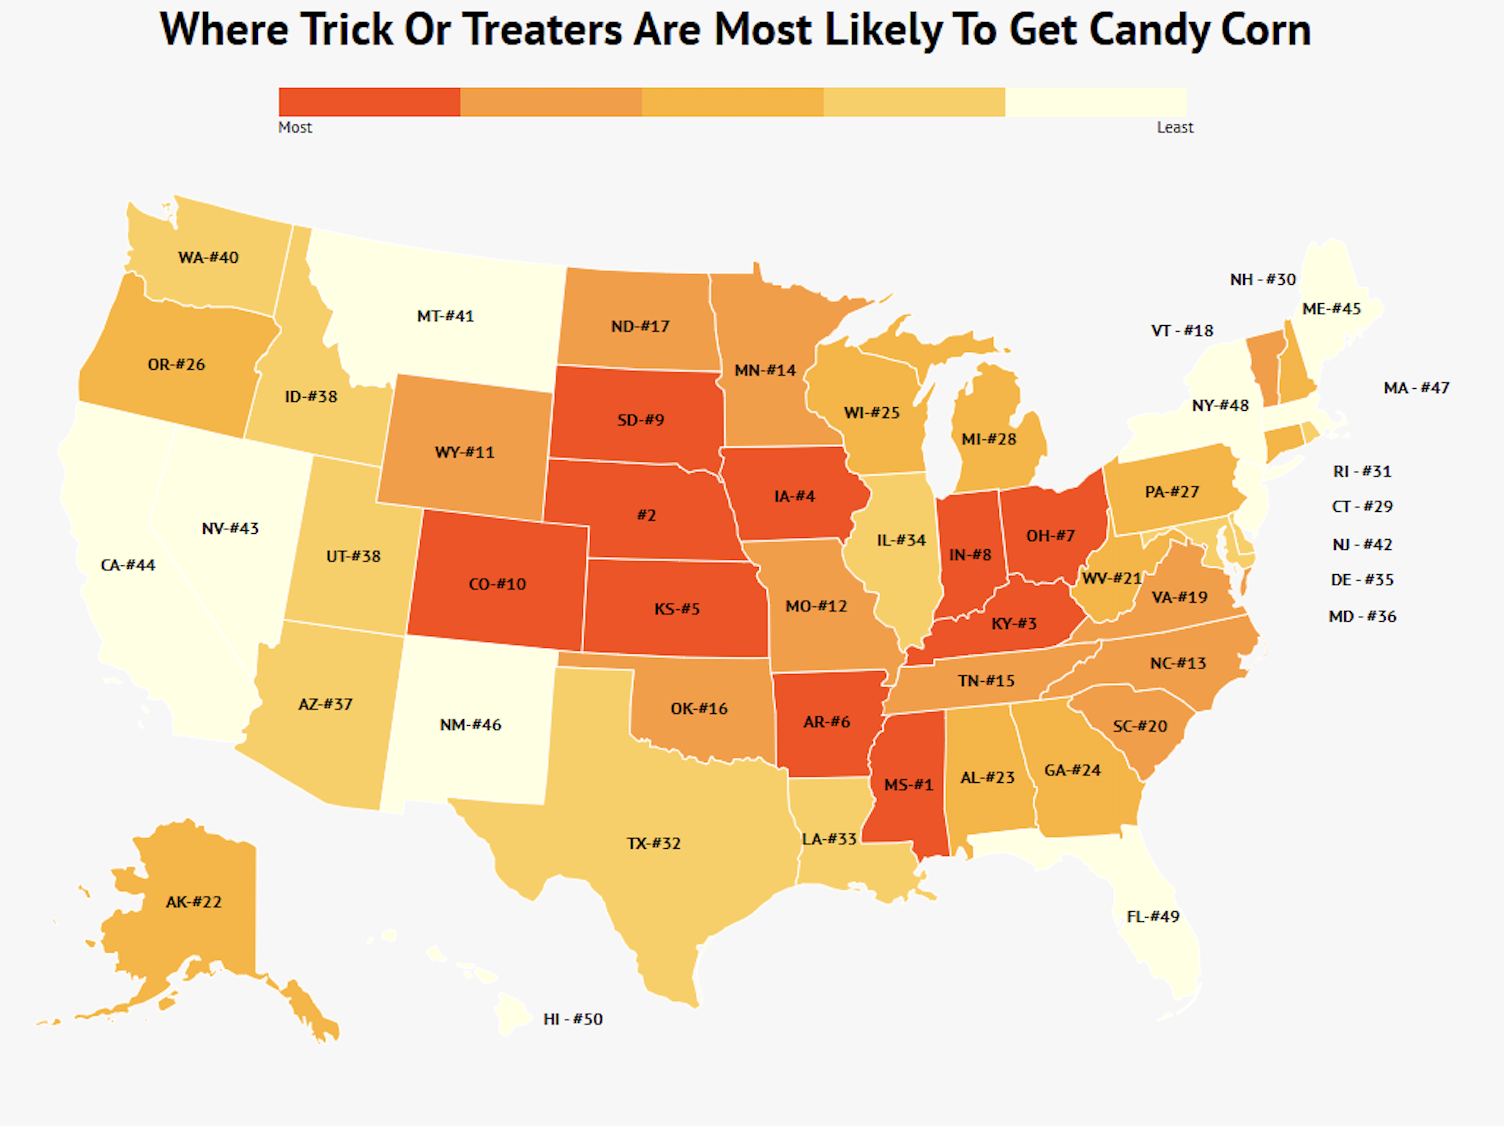
- 45.53% Mississippi trick-or-treaters can expect candy corn- more than anywhere else in the country.
- Nebraska follows at 2nd with 44.72% odds and Kentucky in 3rd with 42.82%.
- Hawaii is the state where trick-or-treaters are least likely to receive the dreaded candy corn, with odds of only 11.3%.
- A lot of trick or treaters, a whopping 66.83%, will score Reese’s Peanut Butter Cup — talk about hitting the candy jackpot!
- Peanut M&Ms and Plain M&Ms are close runners-up, with 64.95% and 62.17% odds of ending up in your pumpkins and pillowcases.
- 1.9% of unfortunate trick-or-treaters can expect to receive a toothbrush in their bucket.
Halloween Candy Odds
These numbers show how likely each candy is to end up in your Halloween bucket — think of them as your “candy odds.” The higher the percentage, the better your chances.
| Candy Type | Implied Probability | Fractional Odds | American Odds |
| Reese's Peanut Butter Cups | 66.83% | 1/1 | -201 |
| Peanut M&Ms | 64.95% | 1/1 | -185 |
| M&Ms | 62.14% | 1/1 | -164 |
| Kit Kat | 60.24% | 1/1 | -152 |
| Snickers | 58.07% | 1/1 | -138 |
| Sour Patch Kids | 55.18% | 1/1 | -123 |
| Hershey's Milk Chocolate | 50.09% | 1/1 | -100 |
| Milky Way | 45.23% | 1/1 | +121 |
| Twix | 33.17% | 2/1 | +201 |
| Haribo Goldbears | 33.17% | 2/1 | +201 |
| Candy Corn | 22.52% | 3/1 | +344 |
| Raisins | 3.92% | 25/1 | +2,451 |
| Toothbrushes | 1.98% | 50/1 | +4,951 |
*Odds above are for entertainment purposes only. These do not reflect odds that may be available on betting apps.
- Chocolate candies have the highest odds of ending up in a trick-or-treat bag- the top 5 most likely candies are all chocolate.
- Sour Patch Kids are the first non-chocolate to appear on the list. Individual trick-or-treaters have 55.18% odds of receiving this yummy treat.
- With only 3.92% odds, raisins are the stealthy intruders of the candy world, offering a rare, health-conscious addition to your Halloween haul.
- 1.98% of trick-or-treaters will receive a toothbrush. We cannot determine by these numbers if the houses handing out toothbrushes are the most likely to be toilet-papered, but I have a hunch the two could be correlated.
The States Where Trick-or-Treaters Are Most Likely To Get Candy Corn
While candy corn odds vary nationwide, a few states stand out for their serious sweet tooth — and surprising love for this polarizing treat.
| Rank | State | Candy Corn Buying (% difference from national average) | Population Density (People Per Square Mile) | Houses Per Treater | Implied Probability |
| 1 | Mississippi | 92.3 | 63.1 | 46 | 45.53% |
| 2 | Nebraska | 91.2 | 25.5 | 45 | 44.72% |
| 3 | Iowa | 72.8 | 57.1 | 42 | 42.12% |
| 4 | Kentucky | 76.8 | 114.1 | 43 | 42.82% |
| 5 | Kansas | 70.5 | 35.9 | 42 | 41.66% |
| 6 | Indiana | 42.8 | 189.4 | 34 | 34.45% |
| 7 | South Dakota | 70.2 | 11.7 | 34 | 33.96% |
| 8 | Ohio | 40.4 | 288.8 | 35 | 34.62% |
| 9 | Arkansas | 52.6 | 57.9 | 37 | 36.71% |
| 10 | Colorado | 33.5 | 55.7 | 30 | 30.4% |
| 11 | Wyoming | 33.9 | 5.9 | 30 | 29.54% |
| 12 | Missouri | 22.9 | 89.5 | 29 | 29.06% |
| 13 | North Carolina | 22.6 | 214.7 | 29 | 29.05% |
| 14 | Tennessee | 23.5 | 167.6 | 29 | 28.95% |
| 15 | Minnesota | 27.8 | 71.7 | 29 | 29.02% |
| 16 | Oklahoma | 11.5 | 57.7 | 28 | 28.07% |
| 17 | Vermont | 17 | 69.8 | 27 | 27.45% |
| 18 | Virginia | 15.1 | 218.6 | 27 | 27.32% |
| 19 | South Carolina | 17.3 | 170.2 | 27 | 27.28% |
| 20 | North Dakota | 16.2 | 11.3 | 28 | 27.58% |
| 21 | West Virginia | 21.1 | 74.6 | 27 | 26.8% |
| 22 | Alaska | 21 | 1.3 | 25 | 25.34% |
| 23 | Alabama | 20.1 | 99.2 | 25 | 25.17% |
| 24 | Georgia | 13.2 | 185.6 | 24 | 24.17% |
| 25 | Wisconsin | 7.2 | 108.8 | 24 | 23.79% |
| 26 | Oregon | 4 | 44.1 | 23 | 23.37% |
| 27 | Pennsylvania | 6.9 | 290.6 | 23 | 23.35% |
| 28 | Michigan | 3.3 | 178 | 23 | 23.07% |
| 29 | Connecticut | 1.5 | 744.7 | 23 | 22.7% |
| 30 | Rhode Island | 5.7 | 1061.4 | 22 | 22.44% |
| 31 | Texas | -3.6 | 111.6 | 21 | 20.87% |
| 32 | Louisiana | -3.7 | 107.8 | 21 | 20.84% |
| 33 | Delaware | -5 | 508 | 21 | 20.56% |
| 34 | Illinois | -4.8 | 230.8 | 21 | 20.6% |
| 35 | Maryland | -5.7 | 636.1 | 20 | 20.08% |
| 36 | Arizona | -3.1 | 62.9 | 20 | 19.96% |
| 37 | Utah | -8.3 | 39.7 | 19 | 19.02% |
| 38 | Idaho | -8.3 | 22.3 | 19 | 19.02% |
| 39 | Washington | -7.3 | 115.9 | 19 | 18.84% |
| 40 | Nevada | -21 | 28.3 | 18 | 17.91% |
| 41 | Montana | -19.4 | 7.4 | 18 | 18.25% |
| 42 | New Jersey | -20.4 | 1263 | 18 | 18.02% |
| 43 | New Hampshire | 2.4 | 153.8 | 23 | 22.53% |
| 44 | Maine | -6.7 | 44.2 | 16 | 16.12% |
| 45 | Massachusetts | -12.7 | 901.2 | 16 | 15.69% |
| 46 | New York | -14.6 | 428.7 | 16 | 15.67% |
| 47 | New Mexico | -27.6 | 17.5 | 16 | 15.93% |
| 48 | California | -32.9 | 253.7 | 17 | 16.92% |
| 49 | Florida | -42.7 | 401.4 | 15 | 14.93% |
| 50 | Hawaii | -55.3 | 226.6 | 11 | 11.3% |
Odds above are for entertainment purposes only. These do not reflect odds that may be available on betting apps.
Top 5 Candy Corn-Loving States
1. Mississippi
- Top Candy Preference: Candy Corn
- Implied Probability for Candy Corn: 45.53%
- Population Density: 63 people per square mile
Trick-or-treaters are more likely to receive candy corn in Mississippi than anywhere else in the country. Candy corn is, unsurprisingly, the favorite candy in the Magnolia State. Maybe candy corn should be the state mascot.
2. Nebraska
- Top Candy Preference: Candy Corn
- Implied Probability for Candy Corn: 44.72%
- Population Density: 25 people per square mile
In 2nd place is the Cornhusker state- or should we say candy corn husker state? Nebraskans prefer candy corn above all other candied treats. The state is fairly spread out and that means Nebraskan trick-or-treaters overcome geography for their candy corn.
3. Kentucky
- Top Candy Preference: Reese’s Peanut Butter Cups
- Implied Probability for Candy Corn: 42.82%
- Population Density: Approximately 113 people per square mile
While Kentucky’s favorite candy is Reese’s Peanut Butter Cups, they have a strong fondness for candy corn. Around 42.82% of trick-or-treaters will take home the controversial candy.
4. Iowa
- Top Candy Preference: Peanut M&Ms
- Implied Probability for Candy Corn: 42.12%
- Population Density: 57 people per square mile
What do trick-or-treaters bring home in Iowa? Odds are high for Peanut M&Ms and candy corn. Interesting combo.
5. Kansas
- Top Candy Preference: Candy Corn
- Implied Probability for Candy Corn: 41.66%
- Population Density: 36 people per square mile
Fun Fact: Kansas is not in Kansas when it comes to their love for candy corn. Maybe it’s the golden hue that reminds them of the endless sunflower fields!
Other Interesting Facts
- Biggest Candy Gamble: Getting a Reese's Peanut Butter Cup is almost a given, but scoring candy corn is a risky bet, especially in states like Hawaii or Florida.
- For those trying to dodge candy corn, destinations like Hawaii's beaches or New York's bustling streets offer your best bets for a diverse and delightful candy array.
- Regional Preferences:States like Arkansas and Ohio have over a 30% chance of distributing candy corn, aligning with the Midwest and Southern penchant for this polarizing treat.
- Coastal Candy Trends:Coastal states like California, New York, and Florida have some of the lowest candy corn probabilities, with chances dipping as low as 11.3% in Hawaii.
Methodology
Multiple data sources inform our odds. For candy sales and preferences, we turned to the National Confectioners Association, Instacart, and DoorDash. Favorite candy refers to the most uniquely popular candy in each state (i.e., everyone loves PB cups, but where loves them more than anywhere else).
Data on population density (a large factor in number of houses trick or treaters are able to visit in one night) comes from the US Census and was taken into account on the state level. For each state, when calculating houses trick or treated, a minimum and maximum amount was applied for feasibility.
Additionally, data from YouGov was used for number of houses, both nationally and regionally
These odds are just for fun. No reputable betting site is taking bets on whether your neighbor is handing out Twizzlers.
May The Odds Be Ever In Your Favor
Halloween truly is a game of chance. Your (or your trick-or-treaters’) candy haul may vary. Most houses pick from a diverse bowl of delicious treats. Odds are high for Reese’s Peanut Butter cups and other yummy goods.
However, there's a chance that candy corn and even a toothbrush might end up in a pumpkin bucket.
If your candy assortment isn’t to your liking, you can always mix up your odds by knocking on more doors or even going to a different neighborhood. Preferably a neighborhood with full-sized candy bars and a distaste for their houses being egged.
Much like the thrill of a savvy bet on a Fanatics Sportsbook Promo, embracing the unpredictable nature of Halloween night can make it all the more exciting. Happy trick-or-treating from all of us at The Action Network!


