


The charts below show the model as of October 30, 2026. The numbers update as polls and prices move between now and election day. How to read them does not.
The PredictionPro 2026 Midterms Model answers one question: what are each party's odds, before looking at what the markets say? It never uses a market price as an input. That separation is the whole idea. A model that looks at the price likely echoes it.
A model built on its own evidence can disagree, and a disagreement is where an edge (a price the model thinks is wrong) can exist.
Step 1. Start with the national vote
The model first forecasts the national House vote. It runs four regression versions built on fundamentals, the slow-moving conditions that have historically predicted how the president's party fares in a midterm. Each version gets equal weight, so no single approach dominates.
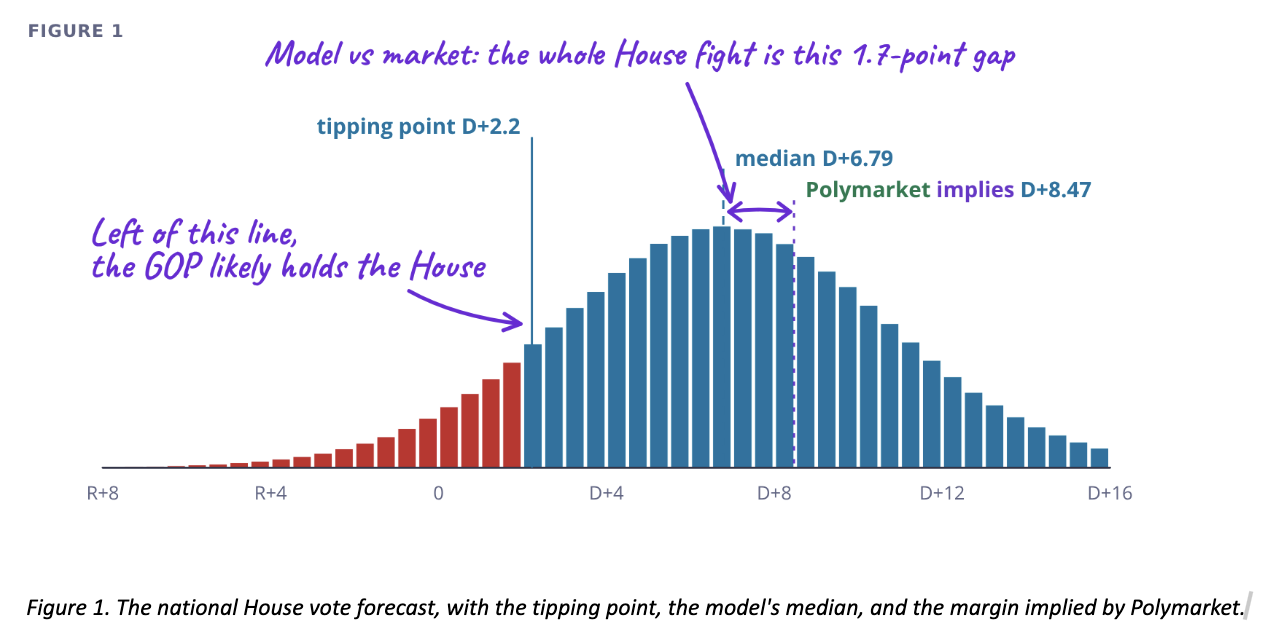
The result is a spread of outcomes, not a solitary number. The dashed line marks the middle of that spread, the model's best single guess at the national margin. The width matters as much as the middle, because a wide spread leaves plenty of room for surprise in either direction. In the October 30 snapshot (Figure 1), the middle sat at Democrats +6.8, and nine in 10 outcomes landed between about D+0 and D+13.
The solid line is the tipping point in any smart money tool. Because of how district lines are drawn, an even national vote does not give an even chance at the House. This cycle, Democrats need roughly a two-point national lead just to make control of the chamber a coin flip. Everything left of that line, the red bars, points to a Republican House.
Step 2. Turn the vote into odds
Count the share of simulated outcomes that land right of the tipping point to get the House probability. The Senate control markets work differently. Only about a third of seats are up, and this year's map leans Republican, so a national swing moves few Senate seats.
The model instead rates each race from the national forecast and the state's past partisan lean, adds this year's race polls where they exist, and simulates the full map 40,000 times. The Senate probability is the share of those runs in which Democrats reach a majority.
Step 3. Put the model next to the price
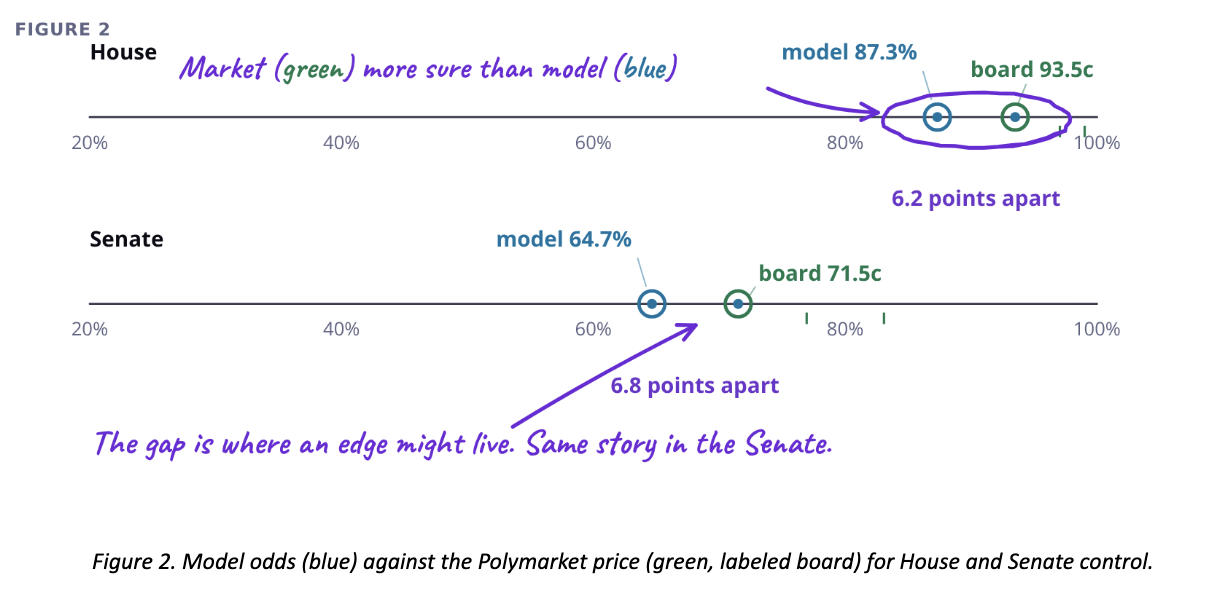
Polymarket prices each chamber as a contract that pays $1 if Democrats win, so a price of 90 cents reads as a 90% chance. When the price sits above the model, the market is more confident in Democrats than the model is, and when it sits below, less.
Run the House price backward through the same tipping-point math, and it gives the national margin the market is implicitly betting on. Whatever the gap size on a given day, the House disagreement shrinks to one question: is the model's national margin or the market's closer to right?
On October 30, the market was more confident in Democrats than the model in both chambers, by six to seven points, and its House implied price was about D+8.5 against the model's D+6.8.

Step 4. Find the races that disagree
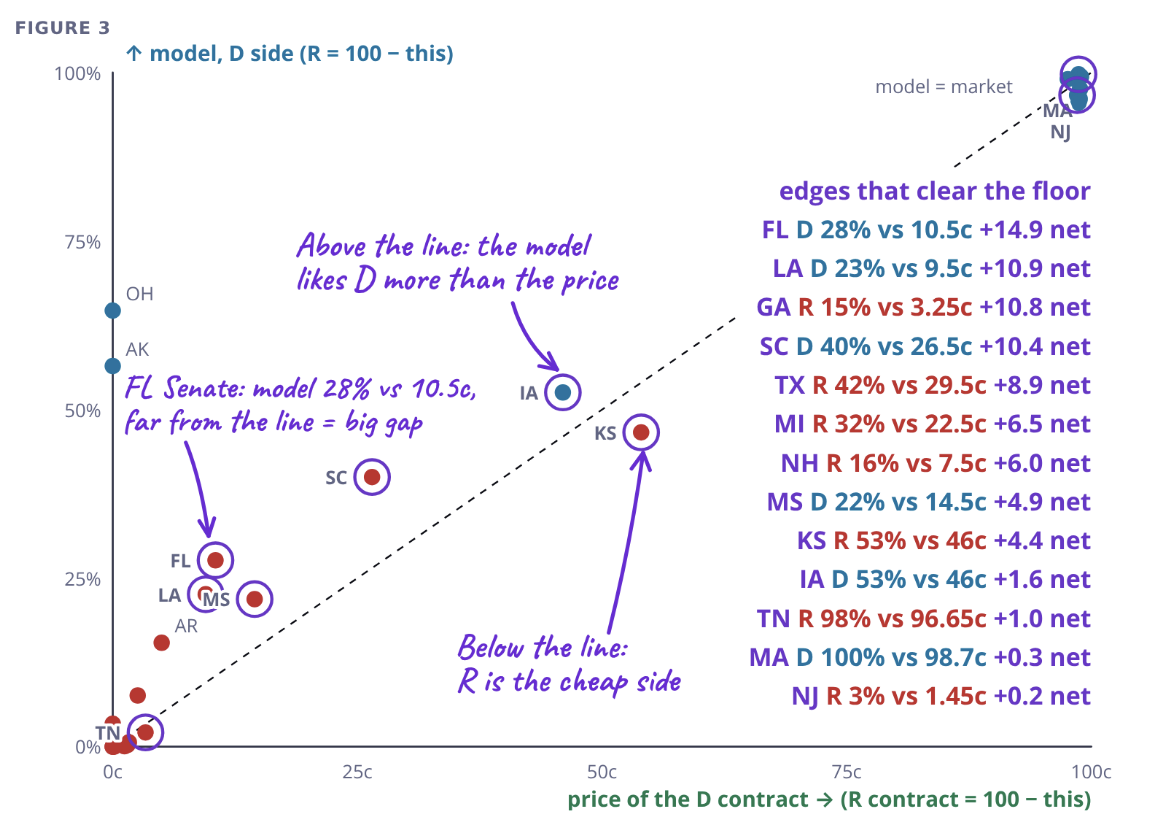
The same comparison runs seat by seat. In this Senate chart, each dot is one race, with the model's Democratic probability on the vertical axis and the price of the Democratic contract on the horizontal.
Dots on the dashed line mean the two agree. A dot above the line means the Democratic contract is cheap, and a dot below means the Republican contract is cheap. Purple circles mark gaps that survive trading costs.
Most prediction market contracts on the board never get that far because their quotes are too thin. A contract counts as tradeable only if it has at least $2,000 of depth (money available to trade) within 5 cents of the price, a spread (the gap between the buy and sell price) of 2 cents or less, and a trade in the last seven days.
Step 5. Size the bet carefully
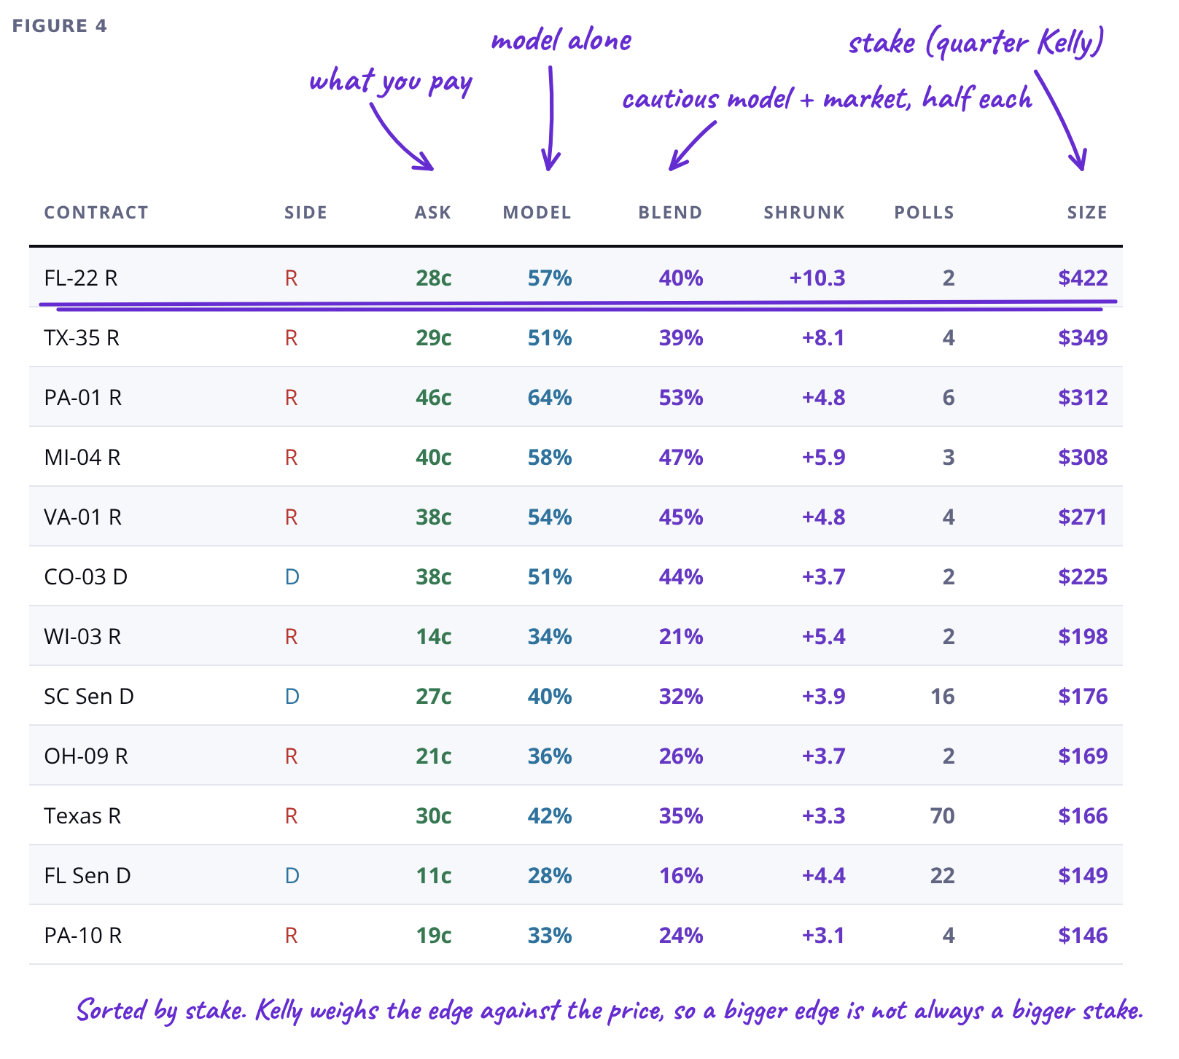
A gap is not yet a trade. PredictionPro's trading desk acts on a blend rather than the raw model. It takes the model's most cautious number (adjusted for its tendency to be overconfident) and averages it evenly with the market price, because the other side of a trade may know something the model does not. A contract is sized only if it passes every one of the desk's tests.
Among them, the edge left after that blend and trading costs must still be at least three points, the model's number must rest on at least two race polls (an unpolled race can also qualify, but a race with only one poll cannot), the return must be at least 10% per dollar, and the order book must be deep enough to fill. Stakes use a quarter of the Kelly formula, a standard rule for sizing a bet by its edge, against a $10,000 notional bankroll.
Kelly weighs edge against price, so the biggest edge doesn't always get the biggest stake. Quarter Kelly gives up some growth in exchange for surviving the times the model is wrong. The list changes as the board moves, and a contract drops off once its price catches up to the blend.
How to use it
The notebook updates every morning through election day with fresh polls and prices, so check its date stamp before acting on any number. Prices keep moving after the morning update, so check the live price before placing a trade.
The reading order stays the same. Start with the chamber odds (Figure 2) for the big picture, then the national vote chart (Figure 1) to see what has to be true, then the trade table (Figure 4) for that morning's list.
(This column is not financial advice)