


Pickleball is the fastest-growing sport in America. The dinks and third-shot drops have brought something else with them: a steep climb in emergency room visits.
Recent national health data highlights the growing severity of court mishaps, including a JAMA Ophthalmology study revealing over 3,000 pickleball-related eye injuries in emergency departments, with incidents spiking sharply by more than 400 cases per year. As experts note, many players jump into fast-paced play without considering the sport's sudden movements, lateral pivots, and physical risks.
To find where players face the highest relative exposure to court mishaps, we paired national ER injury trends and age-susceptibility multipliers with state-level playing infrastructure and court density.
The result is a composite Pickleball Injury Risk Score (0–100) that highlights America's biggest injury hotspots, and each state's individual pickleball injury risk.
Key Findings
- Florida tops the nation with a 35.39% implied probability of pickleball injury, due to a large senior population and pickleball infrastructure.
- 3 New England states make the top 5: Maine (#2), Vermont (#4), and New Hampshire (#5) all have high odds of injury.
- Florida has the most pickleball courts of any state with 7,674 total courts. However, Vermont has the most courts per 100k residents.
- Oklahoma has the lowest risk of pickleball injury, only 6.6%.
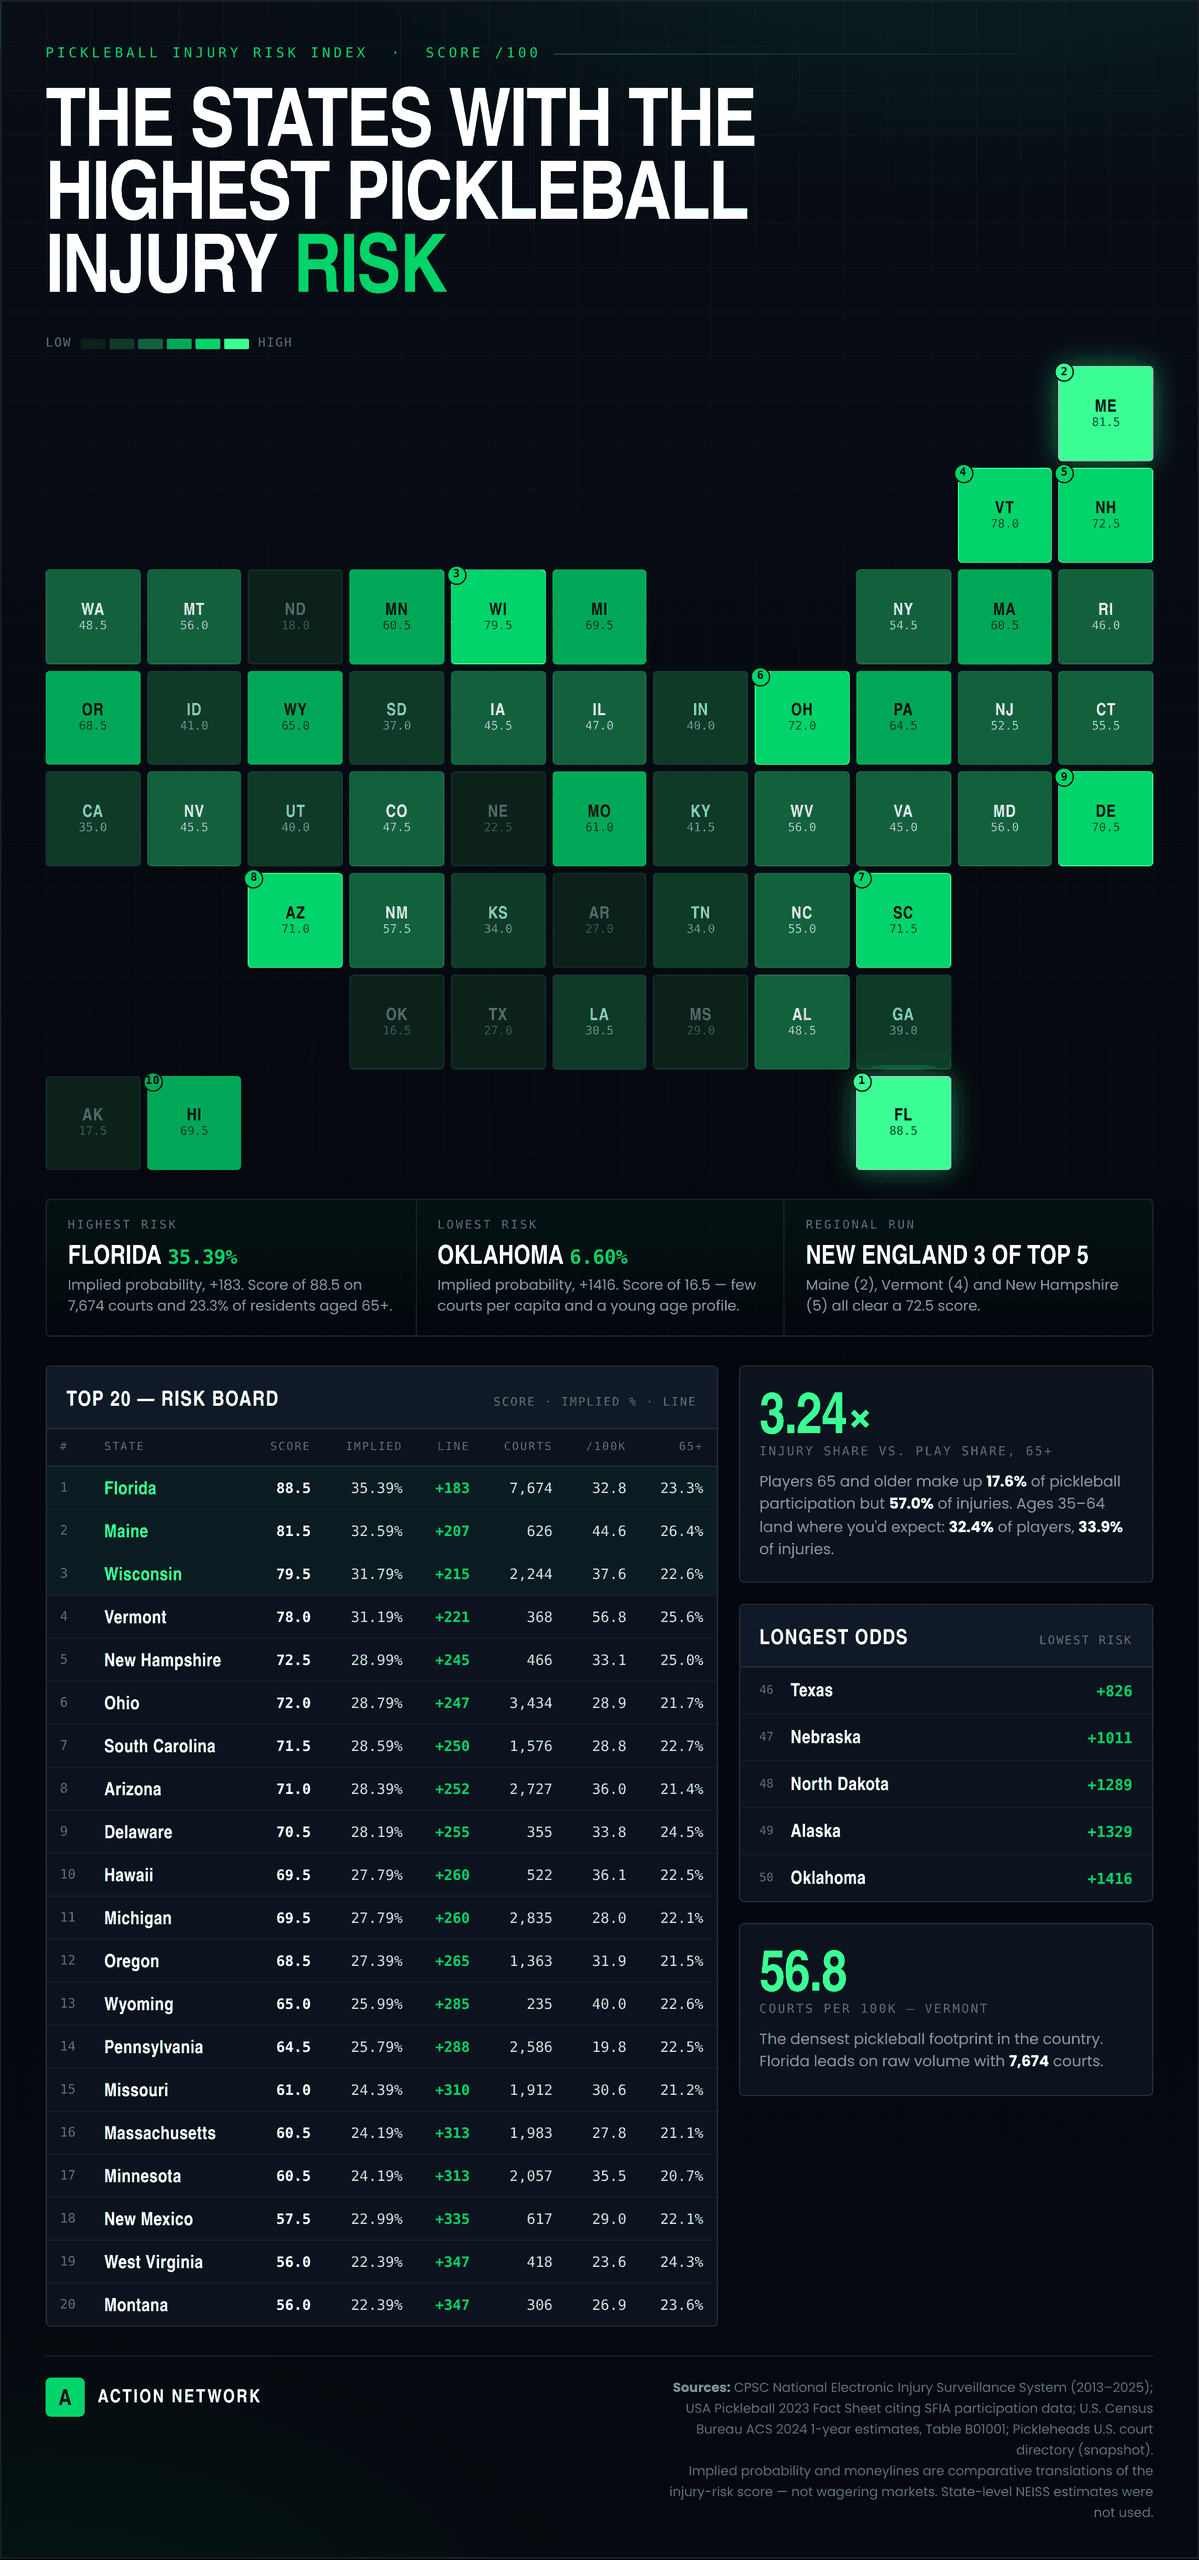
The 10 States With The Highest Pickleball Injury Risk
| Rank | State | Injury Risk Score | Implied Probability | American Moneyline | Courts per 100k | Pop. Share 65+ |
| 1 | Florida | 88.5 | 35.39% | +183 | 32.83 | 23.3% |
| 2 | Maine | 81.5 | 32.59% | +207 | 44.55 | 26.4% |
| 3 | Wisconsin | 79.5 | 31.79% | +215 | 37.64 | 22.6% |
| 4 | Vermont | 78.0 | 31.19% | +221 | 56.75 | 25.6% |
| 5 | New Hampshire | 72.5 | 28.99% | +245 | 33.07 | 25.0% |
| 6 | Ohio | 72.0 | 28.79% | +247 | 28.90 | 21.7% |
| 7 | South Carolina | 71.5 | 28.59% | +250 | 28.77 | 22.7% |
| 8 | Arizona | 71.0 | 28.39% | +252 | 35.96 | 21.4% |
| 9 | Delaware | 70.5 | 28.19% | +255 | 33.75 | 24.5% |
| 10 | Hawaii | 69.5 | 27.79% | +260 | 36.10 | 22.5% |
1. Florida
Florida tops the nation as America’s premier pickleball injury capital with an index-topping Risk Score of 88.5 and a 35.39% implied probability of injury.
Florida's high risk is driven by sheer scale and dense demographic susceptibility: Florida boasts 7,674 pickleball courts (the highest absolute total in the country) and a heavy senior presence, with 23.3% of its population aged 65 or older. Picture sun-soaked retirement communities, non-stop court action, and busy emergency departments treating backward-stepping tumbles under the palms.
2. Maine
Maine takes second place with a 32.59% implied probability of pickleball injury. Maine's position is propelled by its age profile, posting the highest senior concentration in the top 10 at 26.4% aged 65+, combined with impressive court availability (44.55 courts per 100k residents). Packed local courts and an older player base make for a high injury risk in Maine.
3. Wisconsin
Wisconsin lands in third with a 31.79% implied probability. Supported by 2,244 total courts (37.64 per 100k people) and a massive 36.9% population share in the 35–64 age bracket, Wisconsin represents the highest-risk state in the Midwest. With court infrastructure booming across the state, enthusiastic rec leagues are keeping emergency rooms busy from summer parks to indoor winter venues.
4. Vermont
In 4th place is Vermont, with a 31.19% injury risk. Vermont's risk is driven almost entirely by staggering infrastructure intensity: its 56.75 courts per 100k residents is the highest per-capita court concentration of any state in the nation. Combined with a 25.6% senior demographic, Vermont gives its residents more court access per person than anywhere else, and that constant physical exposure translates directly into court-related injury risk.
5. New Hampshire
New Hampshire lands in fifth place with 28.99% implied probability of injury. Tucked into the high-risk Northern New England corridor, the state combines a substantial 25.0% senior population share with widespread court availability (33.07 courts per 100k residents). Local parks and rec centers stay humming with activity, but that easy access to fast-paced games means plenty of veteran players end up taking unexpected spills on the hardcourt. Maybe the state motto should be "live free or dink."
6. Ohio
Fueled by 3,434 total courts and strong court distribution (28.90 per 100k residents), Ohio pickleball players have some of the highest risks in the country. Ohio presents high absolute exposure across its 37.2% middle-aged population base. From suburban park districts to urban facilities, huge playing volumes mean ankle turns and muscle strains are a frequent reality for Ohio dinkers.
7. South Carolina
South Carolina ranks seventh with a score of 71.5 (28.59% implied probability). A major East Coast retirement hub, its score is anchored by a 22.7% senior population share paired with 1,576 total courts (28.77 per 100k residents). Warmer weather keeps players on the court year-round, multiplying the opportunities for intense Third-Shot Drops and awkward court stumbles.
8. Arizona
Arizona scores 71.0 (28.39% implied probability). Well-known as a sunbelt pickleball mecca, Arizona backs up its reputation with 2,727 courts, a high infrastructure intensity of 35.96 courts per 100k residents, and a 21.4% senior share. Endless sunshine and massive active-adult complexes keep court traffic high, making ER visits for sprains and fractures a regular fixture.
9. Delaware
Delaware ranks 9th, with a 28.19% implied probability of risk. Despite its small geographic footprint, Delaware posts a robust 33.75 courts per 100k residents and features a prominent senior population share of 24.5%. With court construction humming and a demographic built for high injury overrepresentation, Delaware punches far above its weight class in relative risk.
10. Hawaii (tie)
Hawaii ties for the tenth spot with a 27.79% injury risk. Hawaii relies on high court density (36.10 courts per 100k) and a 22.5% senior share to claim its spot. Packed island venues, intense local play, and high per-capita court access mean paradise comes with its fair share of court-side physical hazards.
10. Michigan (Tie)
Sharing the tenth spot with Hawaii, Michigan posts an identical injury risk. Michigan earns its ranking through pure infrastructure volume and a strong core demographic, bringing 2,835 total courts (27.96 per 100k residents) and a 22.1% senior population share. High court accessibility across both peninsula communities keeps local ERs regularly seeing pickleball-related injuries.
Don’t Get Caught in a Pickle
As pickleball continues to expand across American parks, recreation centers, and commercial facilities, injuries will likely continue to rise. Highly populated retirement states like Florida and high-court-density regions like Northern New England carry relatively higher injury risks.
However, proper warm-ups, court maintenance, footwear suited for lateral pivoting, and awareness regarding backwards-stepping falls can help ensure that America's favorite new pastime remains a fun, healthy way to stay active. So go forward and dink safely.
If your interest in pickleball falls more along the spectating side, you will be excited to learn you can bet on pickleball. While traditional markets have betting options for the Professional Pickleball Association (PPA) Tour and Major League Pickleball (MLP), you can also take trade on pickleball outcomes on top prediction markets.
If that sounds like a good dill, you can learn more about the best prediction market apps and take advantage of these best prediction market promos.
| Rank | State | Injury Risk Score | Implied Probability | American Moneyline | Courts per 100k | Pop. Share 65+ |
| 1 | Florida | 88.5 | 35.39% | +183 | 32.83 | 23.3% |
| 2 | Maine | 81.5 | 32.59% | +207 | 44.55 | 26.4% |
| 3 | Wisconsin | 79.5 | 31.79% | +215 | 37.64 | 22.6% |
| 4 | Vermont | 78.0 | 31.19% | +221 | 56.75 | 25.6% |
| 5 | New Hampshire | 72.5 | 28.99% | +245 | 33.07 | 25.0% |
| 6 | Ohio | 72.0 | 28.79% | +247 | 28.90 | 21.7% |
| 7 | South Carolina | 71.5 | 28.59% | +250 | 28.77 | 22.7% |
| 8 | Arizona | 71.0 | 28.39% | +252 | 35.96 | 21.4% |
| 9 | Delaware | 70.5 | 28.19% | +255 | 33.75 | 24.5% |
| 10 | Hawaii | 69.5 | 27.79% | +260 | 36.10 | 22.5% |
| 11 | Michigan | 69.5 | 27.79% | +260 | 27.96 | 22.1% |
| 12 | Oregon | 68.5 | 27.39% | +265 | 31.90 | 21.5% |
| 13 | Wyoming | 65.0 | 25.99% | +285 | 39.99 | 22.6% |
| 14 | Pennsylvania | 64.5 | 25.79% | +288 | 19.77 | 22.5% |
| 15 | Missouri | 61.0 | 24.39% | +310 | 30.61 | 21.2% |
| 16 | Massachusetts | 60.5 | 24.19% | +313 | 27.79 | 21.1% |
| 17 | Minnesota | 60.5 | 24.19% | +313 | 35.51 | 20.7% |
| 18 | New Mexico | 57.5 | 22.99% | +335 | 28.96 | 22.1% |
| 19 | West Virginia | 56.0 | 22.39% | +347 | 23.62 | 24.3% |
| 20 | Montana | 56.0 | 22.39% | +347 | 26.91 | 23.6% |
| 21 | Maryland | 56.0 | 22.39% | +347 | 29.19 | 20.3% |
| 22 | Connecticut | 55.5 | 22.19% | +351 | 26.91 | 21.7% |
| 23 | North Carolina | 55.0 | 21.99% | +355 | 27.54 | 20.6% |
| 24 | New York | 54.5 | 21.79% | +359 | 16.77 | 21.1% |
| 25 | New Jersey | 52.5 | 20.99% | +376 | 25.82 | 20.3% |
| 26 | Alabama | 48.5 | 19.40% | +416 | 26.78 | 21.1% |
| 27 | Washington | 48.5 | 19.40% | +416 | 28.94 | 19.6% |
| 28 | Colorado | 47.5 | 19.00% | +426 | 33.03 | 19.1% |
| 29 | Illinois | 47.0 | 18.80% | +432 | 25.92 | 20.3% |
| 30 | Rhode Island | 46.0 | 18.40% | +444 | 24.63 | 21.9% |
| 31 | Nevada | 45.5 | 18.20% | +450 | 24.39 | 20.4% |
| 32 | Iowa | 45.5 | 18.20% | +450 | 35.42 | 20.9% |
| 33 | Virginia | 45.0 | 18.00% | +456 | 26.15 | 20.2% |
| 34 | Kentucky | 41.5 | 16.60% | +503 | 21.82 | 20.8% |
| 35 | Idaho | 41.0 | 16.40% | +510 | 39.62 | 20.1% |
| 36 | Indiana | 40.0 | 16.00% | +525 | 28.08 | 20.1% |
| 37 | Utah | 40.0 | 16.00% | +525 | 48.35 | 14.2% |
| 38 | Georgia | 39.0 | 15.60% | +541 | 27.50 | 18.7% |
| 39 | South Dakota | 37.0 | 14.80% | +576 | 28.88 | 21.5% |
| 40 | California | 35.0 | 14.00% | +614 | 18.65 | 18.7% |
| 41 | Tennessee | 34.0 | 13.60% | +635 | 21.43 | 20.3% |
| 42 | Kansas | 34.0 | 13.60% | +635 | 28.21 | 20.3% |
| 43 | Louisiana | 30.5 | 12.20% | +720 | 17.75 | 20.7% |
| 44 | Mississippi | 29.0 | 11.60% | +762 | 18.45 | 21.0% |
| 45 | Arkansas | 27.0 | 10.80% | +826 | 20.40 | 20.7% |
| 46 | Texas | 27.0 | 10.80% | +826 | 17.39 | 16.6% |
| 47 | Nebraska | 22.5 | 9.00% | +1011 | 27.82 | 19.5% |
| 48 | North Dakota | 18.0 | 7.20% | +1289 | 28.75 | 19.2% |
| 49 | Alaska | 17.5 | 7.00% | +1329 | 27.70 | 18.8% |
| 50 | Oklahoma | 16.5 | 6.60% | +1416 | 18.70 | 19.3% |
Methodology
We scored all 50 states on a 0–100 index that blends two factors: how many residents fall into the age groups most likely to get hurt playing pickleball, and how much pickleball there is to play.
The age weighting comes from national emergency-room data. Using CPSC's National Electronic Injury Surveillance System (2013–2025) alongside participation figures from USA Pickleball's 2023 fact sheet, players aged 35 to 64 turn up in injury records at roughly the rate you'd expect – 32.4% of participants, 33.9% of injuries. Players 65 and older are a different story: 17.6% of participants but 57.0% of injuries, an overrepresentation of about 3.24 times. Each state's population shares for those two brackets, drawn from the Census Bureau's 2024 American Community Survey, are weighted accordingly.
Exposure comes from the Pickleheads court directory, counted two ways — total courts, which captures raw volume, and courts per 100,000 residents, which captures intensity.
The implied probabilities and moneylines are comparative translations of each state's score, meant to make the gaps legible. They are not wagering markets. NEISS is a national hospital sample, so no state-level injury estimates were used. You can see the full dataset here.


