


With summer baseball season in full swing, grabbing a hot dog at the stadium remains one of America’s favorite traditions. But not every team delivers the same experience when it comes to that classic ballpark bite.
A new study from The Action Network ranks every Major League Baseball team based on their overall hot dog experience — factoring in affordability, estimated consumption, online popularity, and fan satisfaction. The Hot Dog Index reveals where fans are getting the best value — and where the experience might be falling short.
Before we dive into the rankings, here’s a quick breakdown of how it was measured. The data experts at The Action Network analyzed four key metrics to create the Hot Dog Index:
- Affordability: The cost of a stadium hot dog, adjusted for local purchasing power. Cities with stronger buying power and lower prices scored higher.
- Consumption: An estimate of how many hot dogs are eaten per home game, based on attendance and league-wide averages from the National Hot Dog and Sausage Council.
- Popularity: The percentage of public mentions of hot dogs found in Reddit threads and Google Maps reviews for each stadium — capturing how much people are talking about them, whether positively or negatively.
- Satisfaction: A sentiment analysis of all hot dog-related comments from Reddit and Google Maps. The score reflects net sentiment — calculated by subtracting the percentage of negative mentions from positive ones — to capture overall fan satisfaction.
A full explanation of how each score was calculated is available at the end of this page.
Which MLB Teams Offer the Best Overall Stadium Hot Dog Experience?
This section brings it all together — affordability, popularity, consumption, and satisfaction — to reveal the stadiums offering the best all-around hot dog experience in 2025.
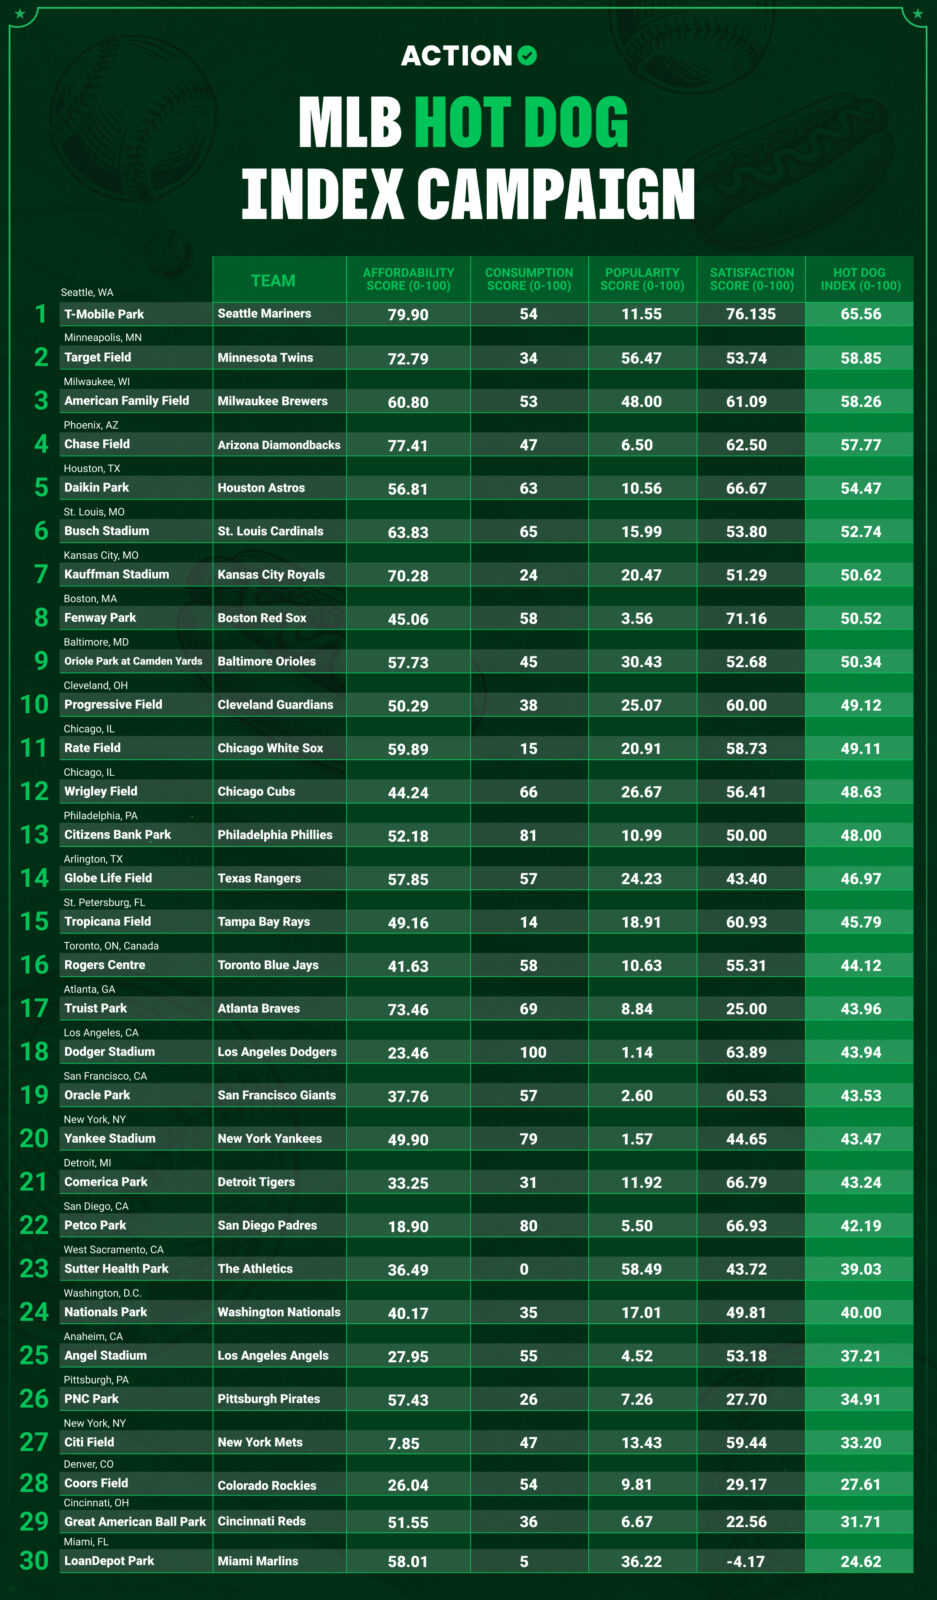
The Seattle Mariners secure the top spot in the 2025 Hot Dog Index with an impressive score of 65.56 out of 100. Their dominance is driven by strong affordability (79.90) and exceptionally high fan satisfaction (76.14). Not far behind are the Minnesota Twins (58.85) and Milwaukee Brewers (58.26), both performing consistently well across categories, especially in online buzz and positive feedback.
At the other end, the Cincinnati Reds (31.71), Colorado Rockies (27.61), and Miami Marlins (24.62) lag behind. The Marlins, in particular, post extremely low consumption numbers (5 out of 100) and an unprecedented negative satisfaction score (-4.17) — a rare outcome that highlights deep discontent among visitors.
Which MLB Teams Provide the Best Value for Stadium Hot Dogs?
Here, we rank teams by how affordable their stadium hot dogs are when factoring in both local pricing and purchasing power. It's not just about cost — it’s about value for fans.
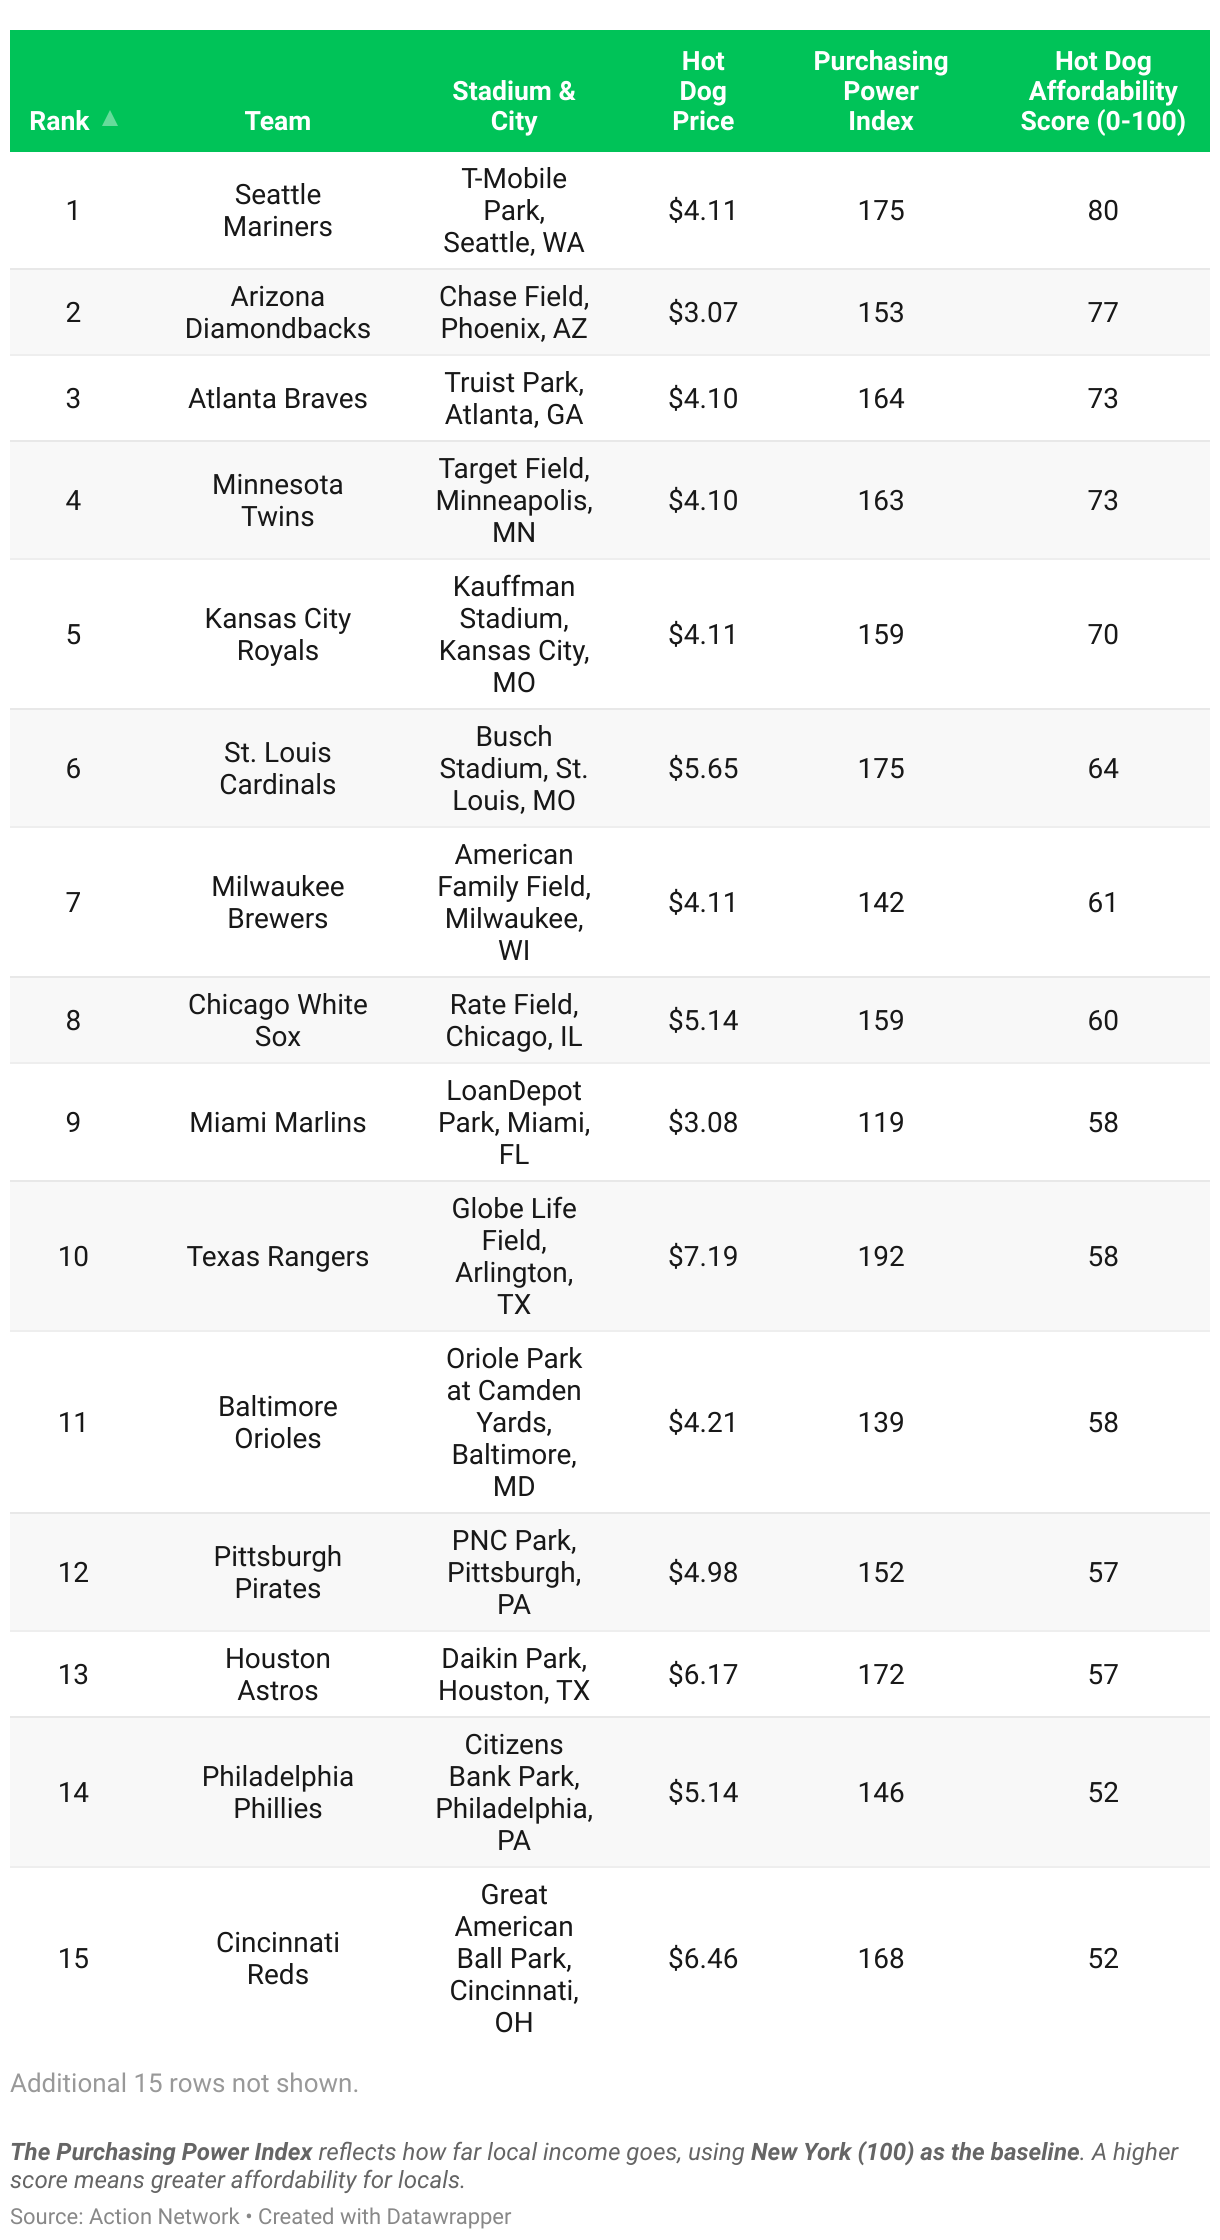
The Seattle Mariners lead the Affordability Index with a score of 79.90 out of 100, offering hot dogs for just $4.11 in a city with a strong purchasing power index (175.3). They’re closely followed by the Arizona Diamondbacks (77.41) and Atlanta Braves (73.46), whose prices remain fan-friendly in context with their local economies.
At the opposite end, fans attending games hosted by the Los Angeles Dodgers (23.46), San Diego Padres (18.90), and especially the New York Mets (7.85) pay significantly more relative to local cost of living. The Mets stand out with a steep $7.19 hot dog price — one of the highest in the league — paired with a much lower purchasing power index, offering fans the least value overall.
Where MLB Fans Are Estimated to Eat the Most Hot Dogs?
This section estimates which teams’ ballparks are fueling the biggest appetites, using attendance and league-wide averages to spotlight where the most dogs are being devoured — based on a total of 19.1 million hot dogs sold across MLB, according to the National Hot Dog and Sausage Council.
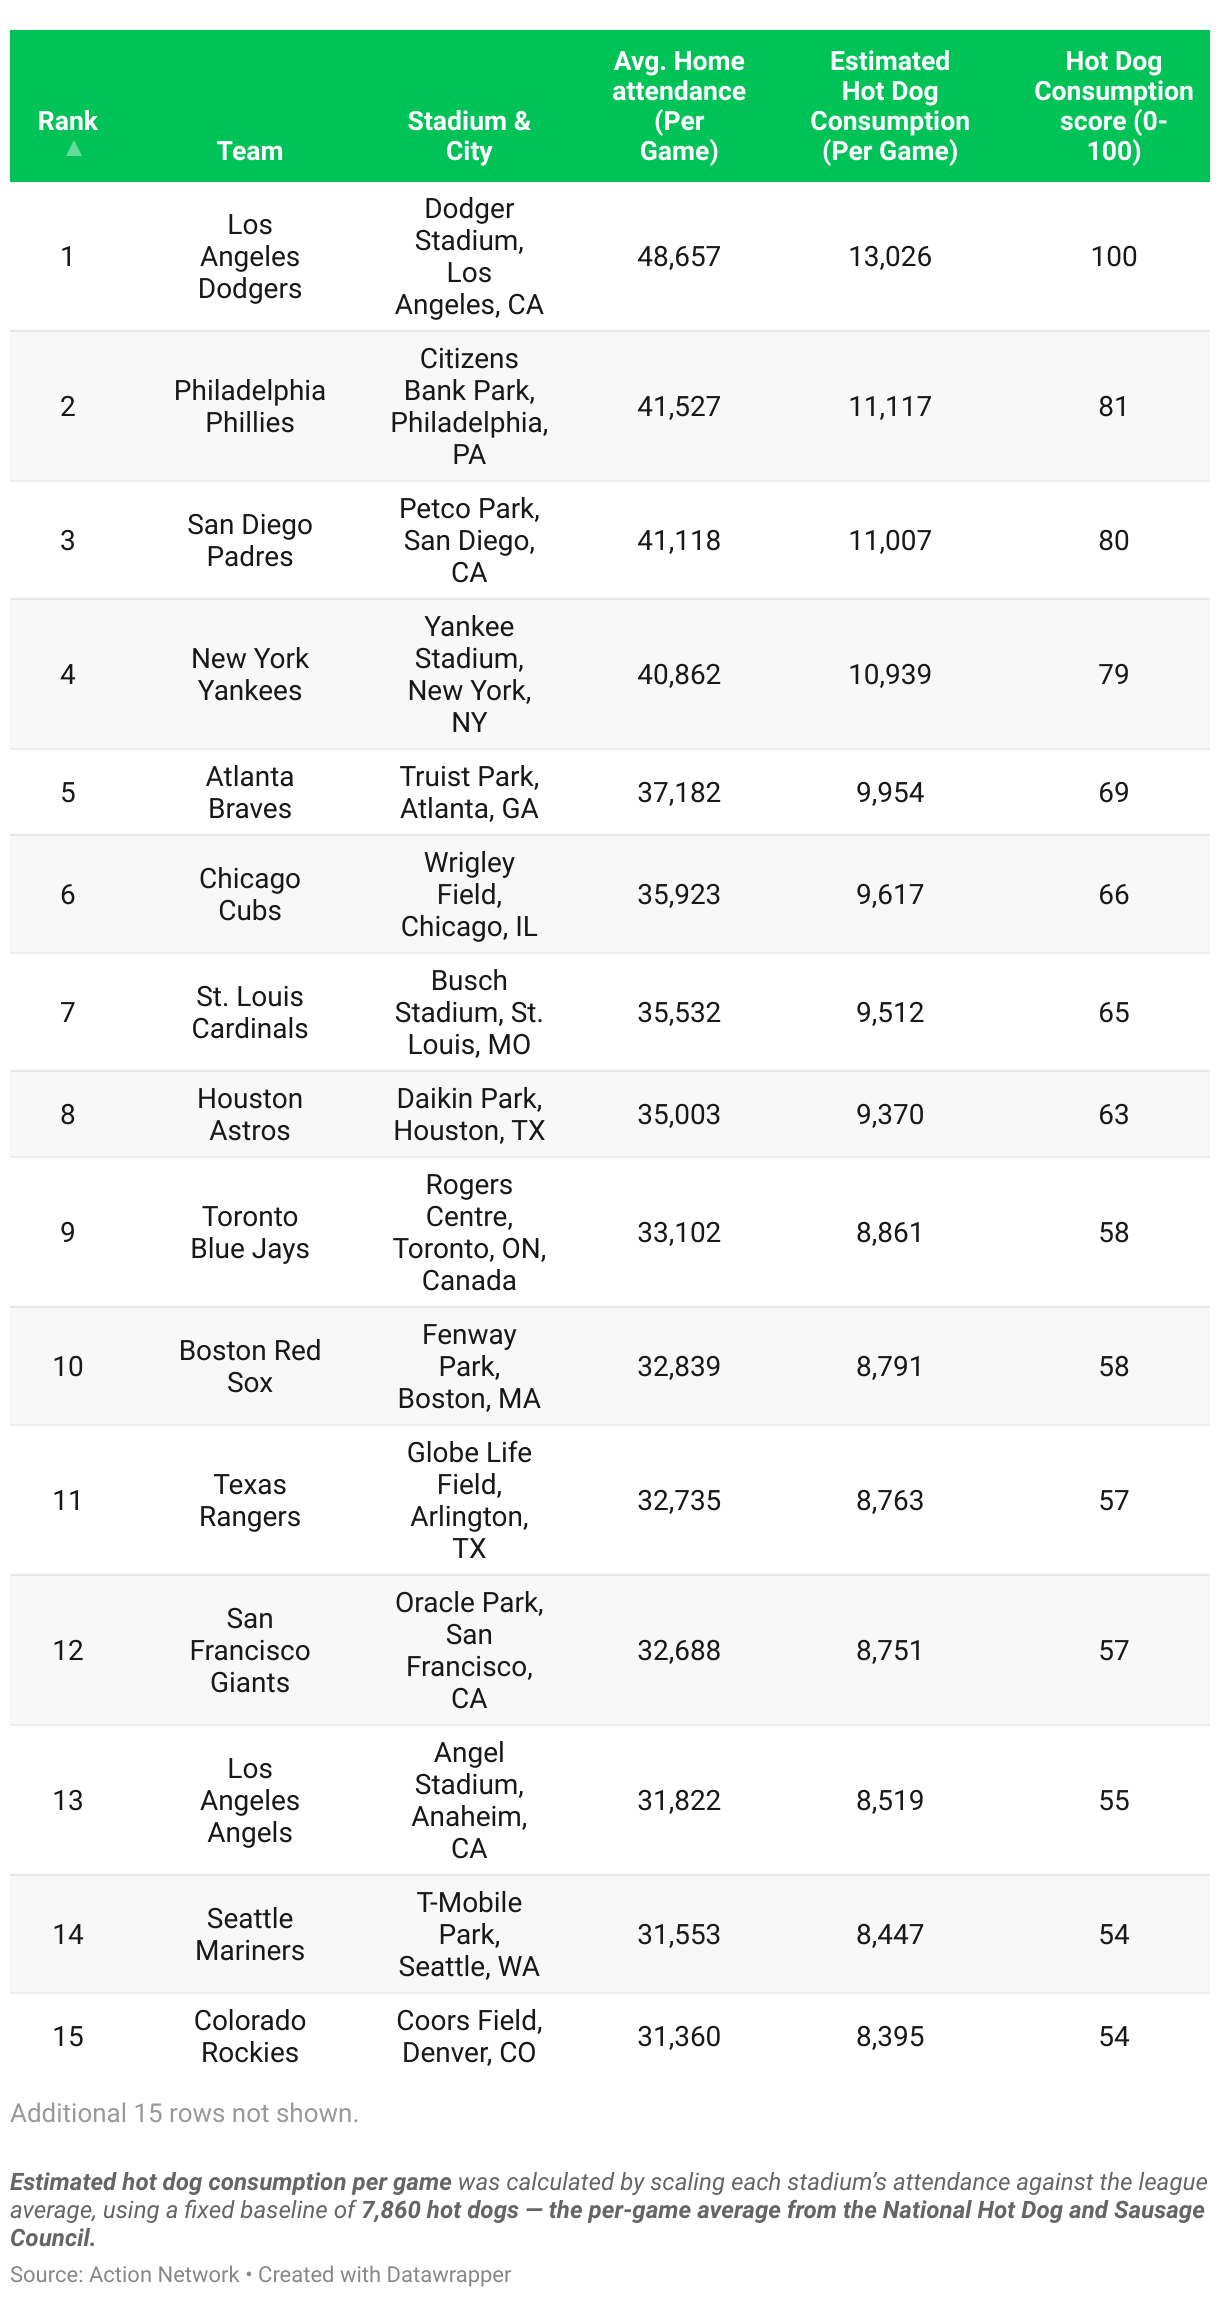
Topping the Consumption Index are the Los Angeles Dodgers, with a perfect score of 100 out of 100, based on an estimated 13,025 hot dogs consumed per game — the highest in the league. They’re followed by the Philadelphia Phillies (81, estimated 11,116 per game) and the San Diego Padres (80, estimated 11,007 per game), showing strong demand from their crowds.
At the lower end, the Tampa Bay Rays (14, estimated 4,421), Miami Marlins (5, estimated 3,594), and the Athletics (0, estimated 3,048) show the least hot dog consumption. The Athletics, despite their stadium change, draw the lowest estimated numbers, reflecting reduced engagement with food options among attendees.
Which MLB Teams Generate the Most Online Buzz About Their Ballpark Hot Dogs?
We analyzed thousands of Reddit comments and Google Maps reviews to uncover where hot dogs are making headlines — the stadiums people can’t stop talking about, from die-hard fans to casual visitors, with feedback that’s either glowing or critical.
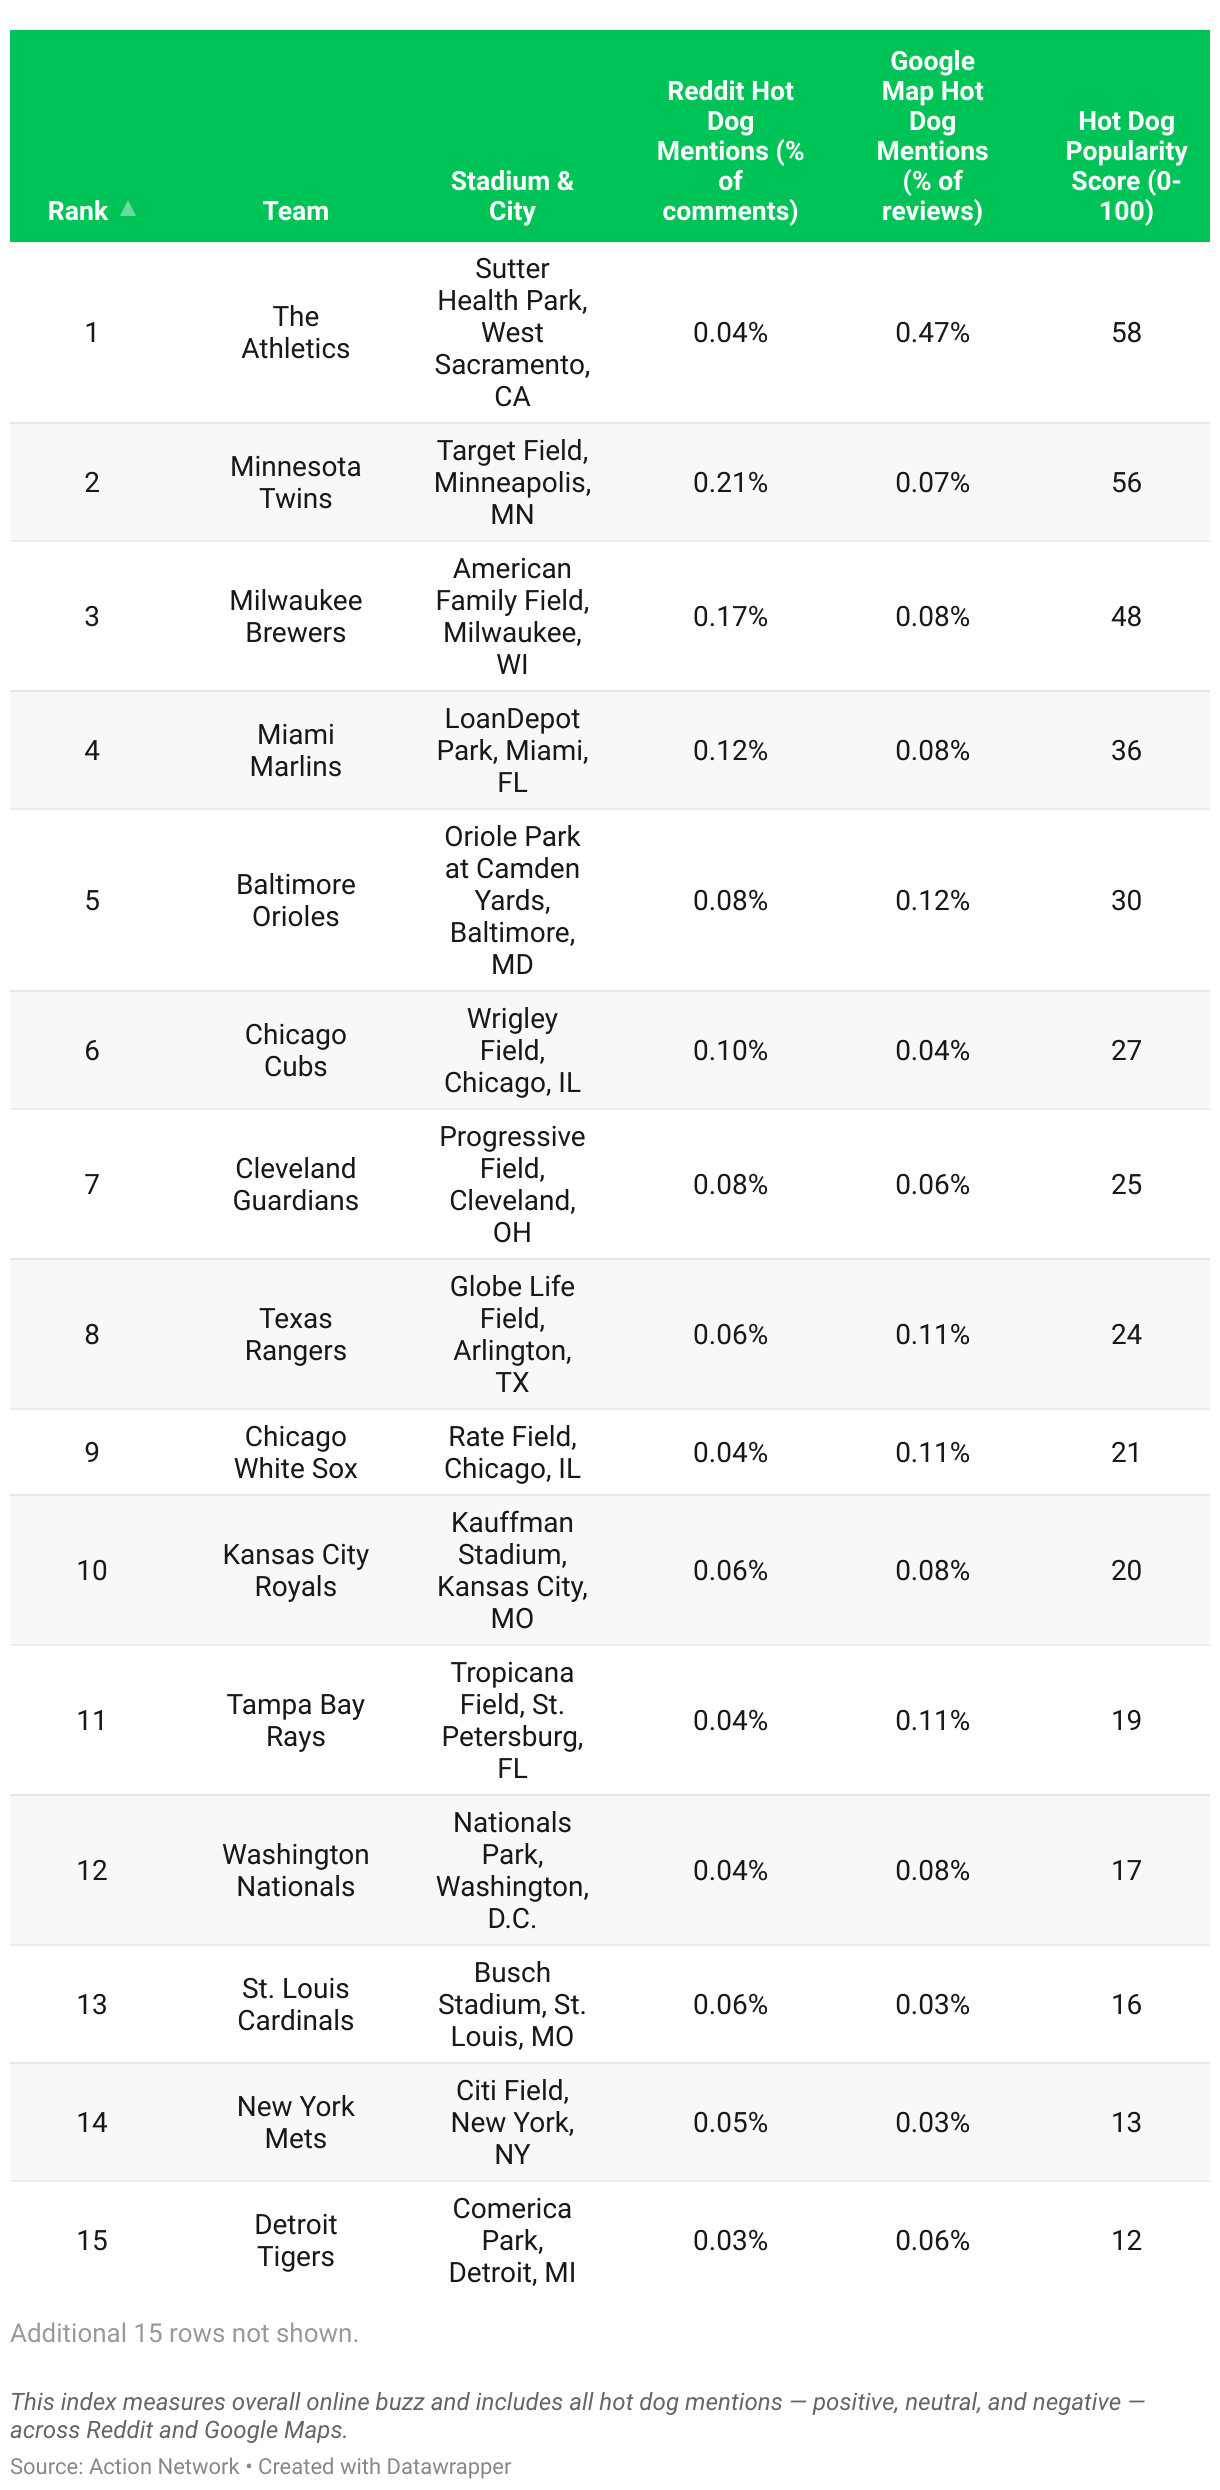
While their overall rank may be lower, The Athletics top the Popularity Index with a score of 58.49 out of 100, thanks to strong visibility online — with hot dogs mentioned in 0.47% of Google Maps reviews and 0.038% of Reddit comments. The Minnesota Twins (56.47) and Milwaukee Brewers (48.00) also rank highly, with their hot dogs consistently coming up in fan discussions across platforms.
In contrast, hot dogs at the San Francisco Giants (2.60), New York Yankees (1.57), and Los Angeles Dodgers (1.14) generate little buzz online. Despite large attendance numbers, their offerings aren’t sparking much conversation — a potential signal that they’re not standing out to fans.
Which MLB Teams Offer the Highest Fan Satisfaction for Their Stadium Hot Dogs?
This section reveals which stadium hot dogs are leaving a lasting impression — for better or worse. By analyzing sentiment from fans and visitors, we uncover where satisfaction is soaring and where it’s falling short.
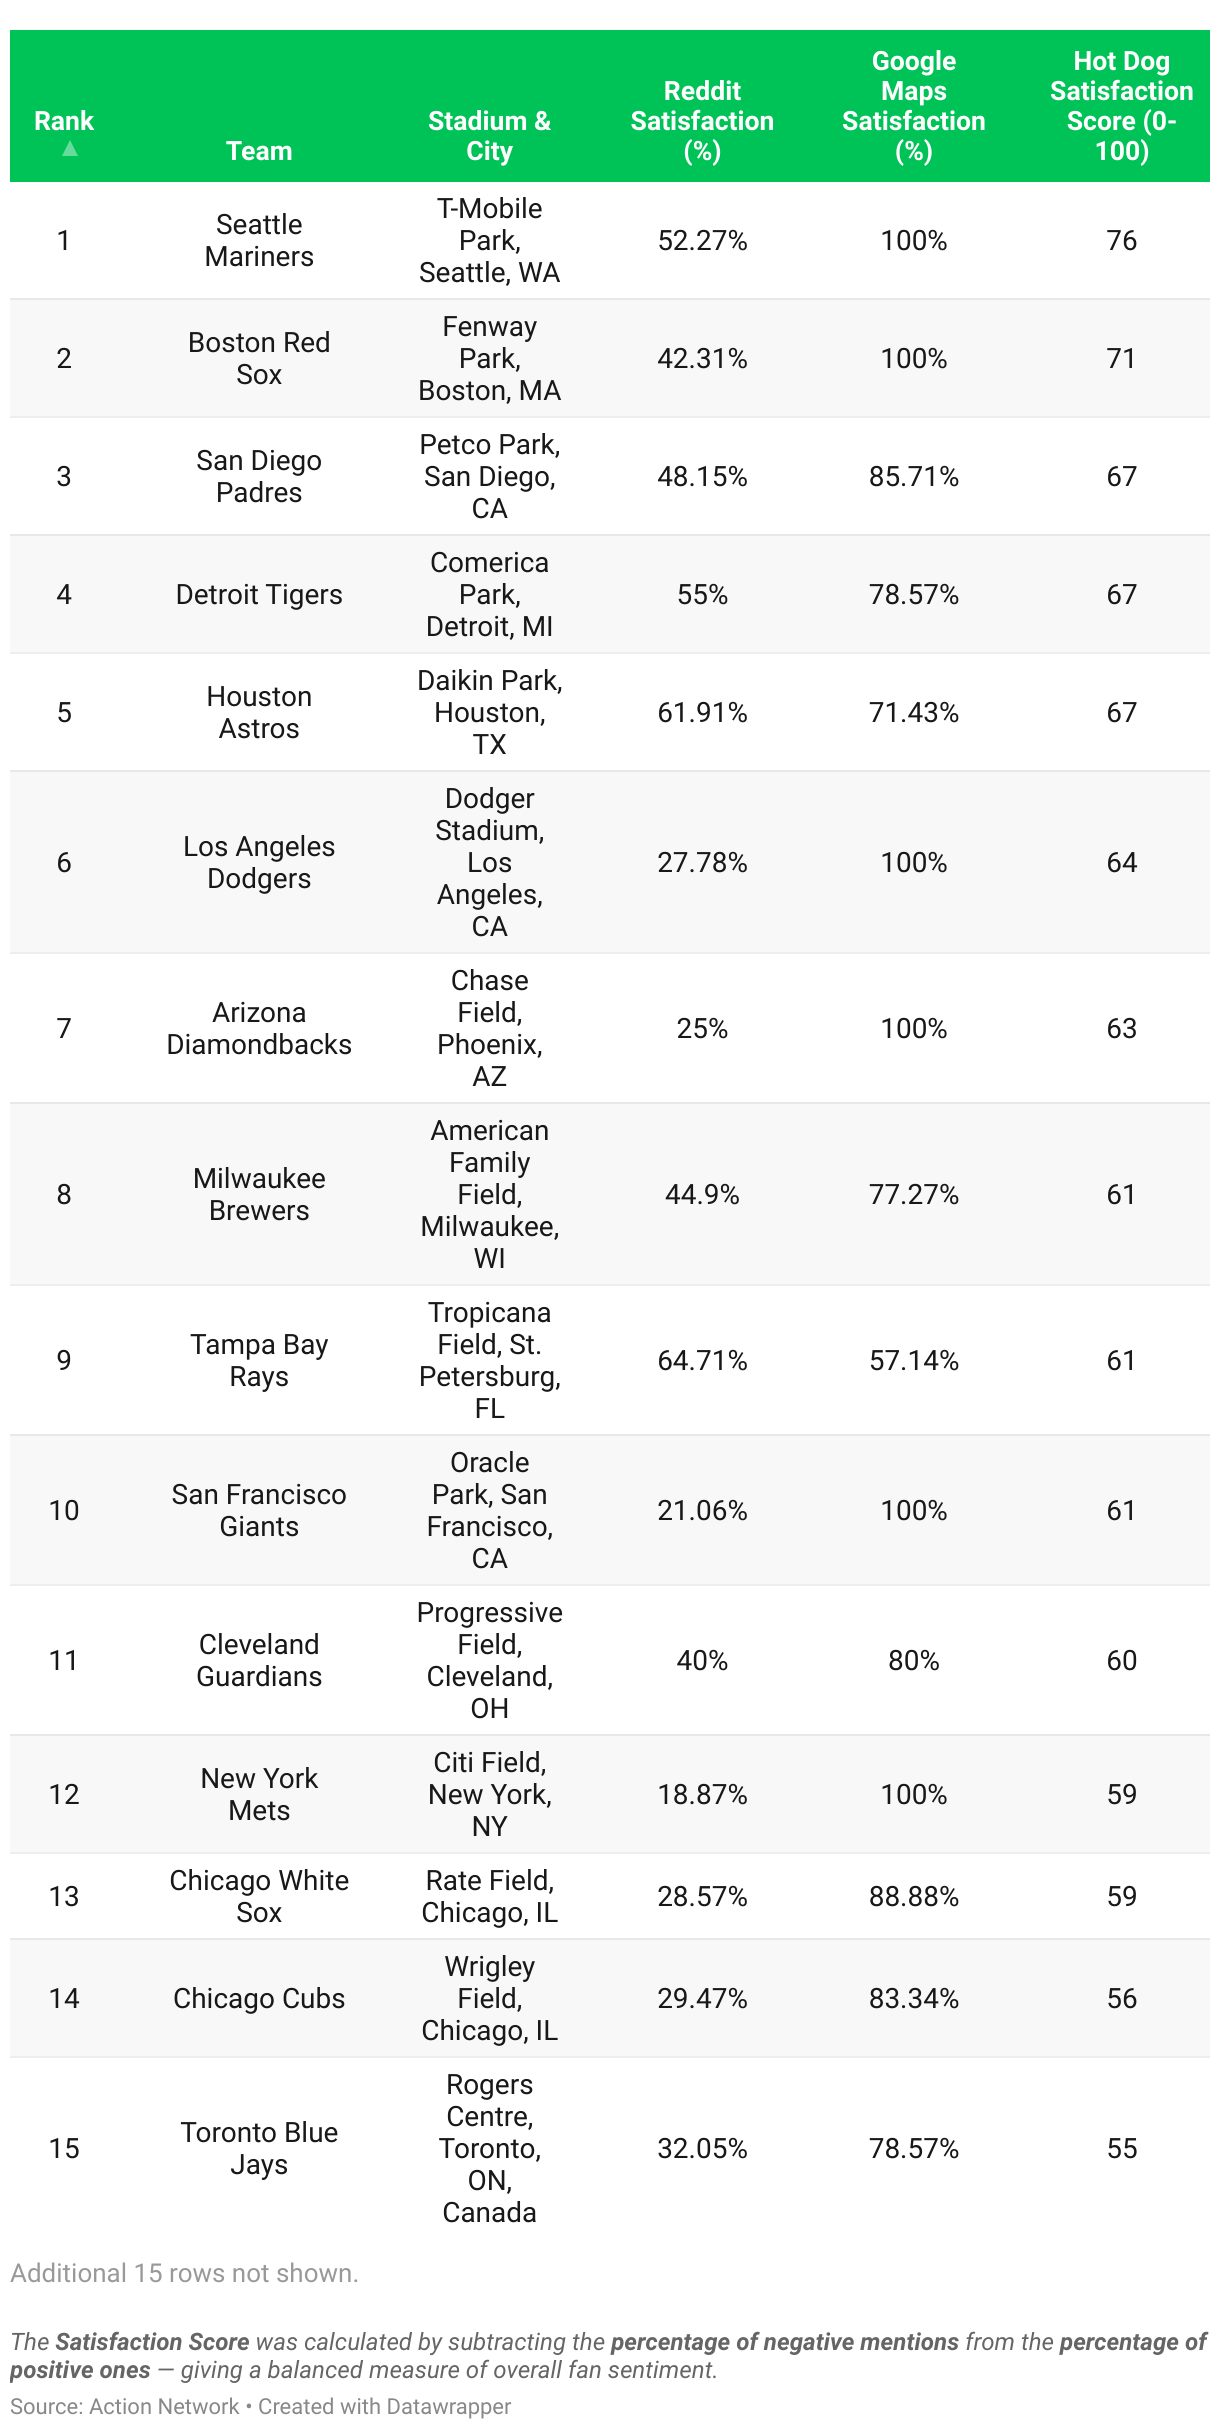
The Seattle Mariners once again take the top spot — this time in the Satisfaction Index — with a score of 76.14 out of 100. Their dogs receive glowing reviews across platforms, including 52.27% positive sentiment on Reddit and a perfect 100% score on Google Maps. Close behind are the Boston Red Sox (71.16) and San Diego Padres (66.93), both benefitting from consistently high praise.
At the bottom, the Atlanta Braves (25.00), Cincinnati Reds (22.56), and Miami Marlins (-4.17) face serious challenges. The Marlins are the only team to earn a negative satisfaction score, driven by a rare –25% rating on Google Maps, suggesting widespread dissatisfaction with their hot dogs among attendees.
Here’s a cleaned, web-optimized version of your MLB Hot Dog Index 2025: Methodology section — formatted for easy adaptation into a WordPress landing page, while keeping all your data and tone intact.
Many of our readers are both MLB fans and bettors, so we create articles like this to entertain, inform, and add a little edge to your next wager. If that sounds like you, don’t miss our latest reviews of the most popular betting offers this season — including the Fanatics Sportsbook Promo, BetMGM Bonus Code, and Caesars Sportsbook Promo Code.
Methodology: How We Built the 2025 MLB Hot Dog Index
This study ranks all 30 Major League Baseball teams based on the quality of their stadium hot dog experience, using a data-led scoring model. Four key factors were considered: Affordability, Consumption, Popularity, and Fan Satisfaction. Each metric was normalized on a 0–100 scale, then combined using a weighted average to produce the final Hot Dog Index score.
1. Affordability Score (35%) — Higher = More Affordable
This score reflects how budget-friendly a stadium hot dog is — adjusted for the local cost of living.
What We Measured:
- Hot Dog Price (2024) – Source: Statista
Prices for all 30 MLB stadiums were collected and normalized (lowest price = highest score). - Local Purchasing Power Index – Source: Numbeo
This index reflects how far a dollar stretches in each city. Cities with stronger purchasing power were scored higher (normalized from lowest to highest).
Final Score:
We averaged the normalized price and purchasing power scores to calculate the final Affordability Score. A higher score = better value due to cheaper prices, stronger local economies, or both.
2. Consumption Score (10%) — Higher = More Estimated Hot Dogs Eaten per Game
This score estimates how many hot dogs are consumed at each stadium during a typical home game.
What We Measured:
- Average Hot Dog Consumption Rate – Source: National Hot Dog and Sausage Council
Based on 19.1 million hot dogs sold league-wide in 2022, we estimated 7,860 hot dogs per game as the average. - Stadium Attendance – Source: ESPN (2024 MLB season)
We used average home game attendance per team to scale estimated consumption.
Formula Used: (Stadium Attendance ÷ League Average Attendance) × 7,860
With league average attendance = 29,361.
Final Score: Consumption figures were normalized on a 0–100 scale. A higher score = more hot dogs likely consumed per game.
Note: These figures are estimates based on publicly available data and do not reflect actual reported consumption.
3. Popularity Score (15%) — Higher = More Online Buzz About Stadium Hot Dogs
This score captures how often hot dogs are mentioned online — regardless of sentiment — to reflect visibility and fan interest.
What We Measured:
- Reddit Mentions
% of hot dog mentions in each team’s official subreddit (relative to subreddit size). - Google Maps Reviews
% of hot dog mentions in public reviews of each team’s stadium.
We combined both sources to balance hardcore fans (Reddit) and casual visitors (Google Maps).
Final Score: Normalized percentage mentions from both platforms were averaged. A higher score = more total discussion around hot dogs at that stadium — positive or negative.
4. Satisfaction Score (40%) — Higher = More Positive Sentiment About Stadium Hot Dogs
This is the most heavily weighted metric, designed to reflect how much fans genuinely enjoy the hot dogs at each stadium.
What We Measured:
- We collected Reddit comments and Google Maps reviews that mentioned hot dogs at each MLB stadium.
- Each mention was classified as positive, neutral, or negative using sentiment analysis.
- Instead of relying solely on positive mentions, we calculated the net sentiment by subtracting the share of negative mentions from the positive share — providing a more balanced measure of overall satisfaction.
Final Score: Normalized based on net sentiment (positive minus negative). A higher score = more fans praising hot dogs, with fewer critics.
Note: By focusing on net sentiment rather than just positive feedback, we aimed to capture a fuller picture of fan satisfaction.
Final Calculation: Hot Dog Index Score (Out of 100)
To get the overall Hot Dog Index for each MLB team, we combined all four metrics using the following weights:
| Metric | Weight | Why It Matters |
| Affordability | 35% | Value is key. Fans want reasonably priced hot dogs based on local cost of living. |
| Satisfaction | 40% | Taste rules. The biggest factor is how much people actually enjoy the hot dogs. |
| Popularity | 15% | Online buzz reflects cultural relevance — if people are talking, it matters. |
| Consumption | 10% | While estimated, this indicates fan demand and tradition at live games. |
We prioritized the factors that matter most to fans — satisfaction and affordability — which is why they received higher weights compared to online buzz and estimated in-game demand.
Formula: Hot Dog Index = (Affordability × 0.35) + (Satisfaction × 0.40) + (Popularity × 0.15) + (Consumption × 0.10)
The final score reflects a balanced, data-driven ranking of each MLB stadium’s hot dog experience — combining cost, taste, visibility, and demand.


