


Squares pools in football cluster around certain numbers — 0, 7, 3, 4 — because of how football scoring works.
But in basketball, is one set of numbers better than any other for a March Madness squares pool, which pays out based on the last digit of the winning team's score and the last digit of the losing team's score for every game in the tournament?
I looked at 2,199 NCAA Tournament games since 1991 to find out, plus 144,101 regular-season games since 2000.
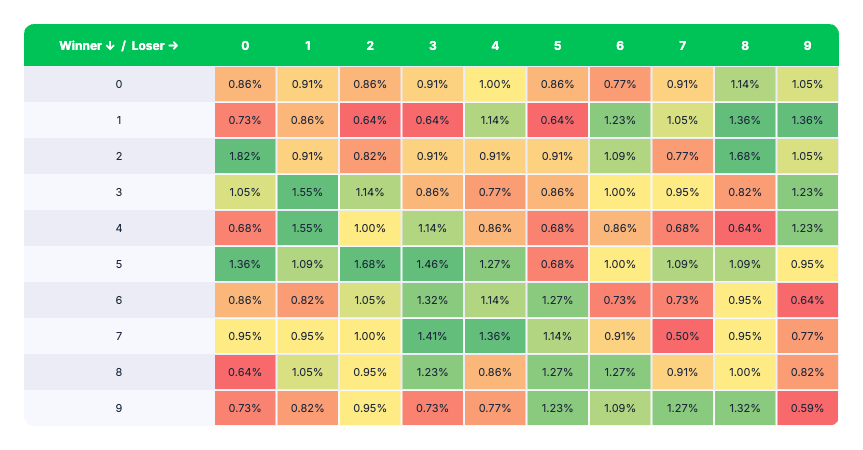
The short answer is yes — some squares do outperform others by small margins. And if you do get a choice of square, you should follow this chart and analysis. The highest occurrence is 1.82% of the games. In football, you'll usually get 12 squares with a 2%+ probability of being the final score.
If you're trying to see squares results for every game in 2026, we're tracking them here.
NCAA Tournament Squares Outcomes Since 1991
In a sport like basketball, why do some squares outperform others?
It's all about the margin of victory. The best squares are the ones in which the most likely outcome is a close game in which the winning team's final scoring digit is 2-4 points higher than the losing team's, because 2-4 are the most common margins of victory in college basketball and in the NCAA Tournament. So think 75-72 (making 5-2 strong), but also 70-68 (making 0-8 strong).
That's why the best squares are all within those margins:
- Winner 2, Loser 0: 1.8%
- Winner 5, Loser 2: 1.7%
- Winner 2, Loser 8: 1.7%
- Winner 3, Loser 1: 1.5%
- Winner 4, Loser 2: 1.5%
- Winner 5, Loser 3: 1.5%
In 2-0, for example, you're getting 62-60 and 72-70, but you're also getting longtail outcomes like 72-60 or 82-70.
The worst squares are doubles and ones where the loser's score is higher than the winner's score, because you're not getting the tight margin games. For Winner 1, Loser 2, you're only getting 71-62, 81-62, etc., and nine-point and 19-point margins happen far less often than 2-4 point margins.
- Winner 7, Loser 7: 0.5%
- Winner 9, Loser 9: 0.6%
- Winner 6, Loser 9: 0.6%
- Winner 8, Loser 0: 0.6%
- Winner 1, Loser 2: 0.6%
- Winner 1, Loser 3: 0.6%
Why do 1-point margins underperform?
A 1-point margin of victory is the ninth most common in the NCAA Tournament — more games have been won by 12 points over the last 25 years than by one point.
This is likely due to scoring and possession strategy late in games. Because teams often hold for the last shot in tie games with 30 seconds left or fewer, you don't get as many games ending on 1-point margins. The team is either winning by 2+ if the shot goes in, or going to overtime.
What if you look at all college basketball games, not just the NCAA Tournament?
The advantage of looking at all games is that you get a massive sample size. I pulled 144,101 games since 2000.
The disadvantage is that you're getting more games with huge point spreads, which will lead to different margins of victory. Next year, I'll probably try to normalize for point spreads a bit.
The general themes persist when looking at all 144,101 games, though the spreads tighten quite a bit. The worst numbers are pairs (8/8, 6/6, etc.), and the best numbers are still in those 2-5 point margins.
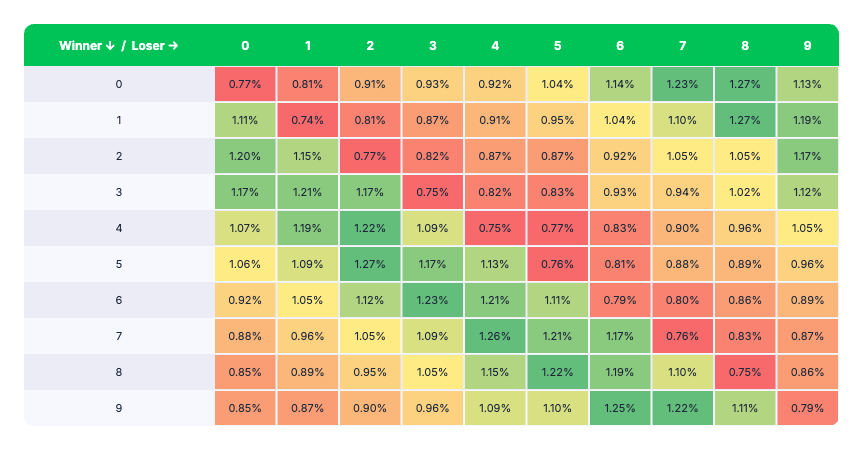
Is there a best row/column?
When looking at all college basketball games, there are a few rows that have very small cumulative probabilities over the others:
- Best loser number: 2 (10.17%)
- Worst loser number: 5 (9.86%)
- Best winner number: 0 (10.15%)
- Worst winner number: 4 (9.83%)


