


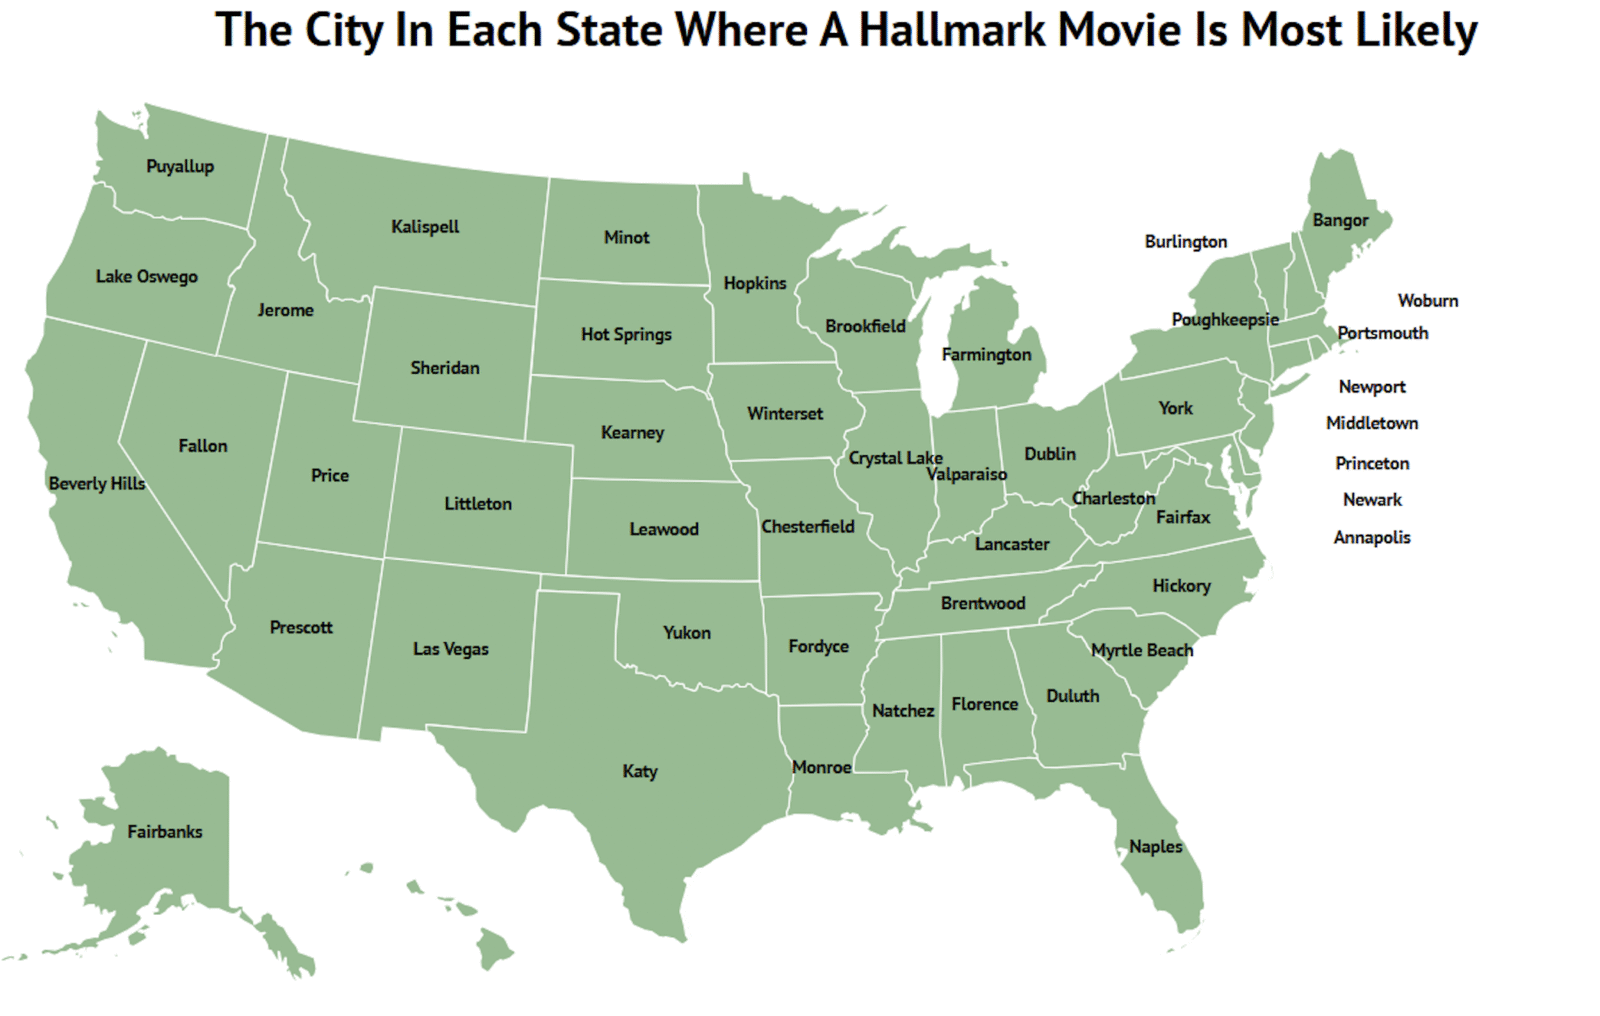
Every year, Hallmark holiday movies drop us into snow-dusted towns full of glowing storefronts, festive markets, and built-in nostalgia. The question is which real U.S. towns actually feel that way. To answer that, we pulled data on more than 3,000 towns, looking at small business count, historic sites, and December snowfall. From there, we found the city in each state where a Hallmark-style story is most likely by the numbers.
Now we can’t promise a big-city professional is falling for a plaid-wearing tree farmer in these places, but they all grade out pretty well for it.
Key Findings
- Puyallup, Washington comes out on top, with a 5.4% chance of a Hallmark-style movie happening in real life.
- Washington cities in general rate well thanks to a mix of snowfall and strong small-business numbers.
- Farmington, Michigan (5.0%) is second on the list, with Poughkeepsie, New York (4.6%) in third.
- Price, Utah has 42 historic buildings per 1,000 residents, more than any other city in the study, which helps it win fourth place and a 4.4% probability of Hallmark magic.
- Naples, Florida, Christmas-at-the-beach and all, leads the country in business count, which gives it serious Main Street energy.
- Even a sleepier suburb like Chesterfield, Missouri shows a little holiday spark, with 0.9% Hallmark odds.
10 Top Cities Where A Hallmark Movie Is Most Likely
| Rank | City | Implied Probability | Population | December Snow Avg. (In) | Historic Places/Per 1000 Population | Small Businesses |
| 1 | Puyallup, Washington | 5.4% | 42,610 | 21 | 0.12 | 13,695 |
| 2 | Farmington, Michigan | 5.0% | 11,486 | 19 | 0.26 | 13,257 |
| 3 | Poughkeepsie, New York | 4.6% | 31,717 | 18 | 2.93 | 9,044 |
| 4 | Price, Utah | 4.4% | 8,174 | 0 | 42.08 | 1,481 |
| 5 | Naples, Florida | 4.3% | 19,315 | 0 | 0.26 | 51,977 |
| 6 | Bangor, Maine | 3.8% | 31,705 | 15 | 1.23 | 7,447 |
| 7 | Burlington, Vermont | 3.6% | 44,646 | 15 | 1.28 | 5,703 |
| 8 | Fairbanks, Alaska | 3.6% | 32,496 | 14 | 0.95 | 8,210 |
| 9 | Littleton, Colorado | 3.3% | 45,531 | 1 | 0.22 | 36,307 |
| 10 | York, Pennsylvania | 3.1% | 44,782 | 8 | 0.45 | 16,695 |
These odds are for entertainment purposes only. If you want to put real money behind entertainment markets, you can trade on them with the Kalshi Referral Code. And if you are looking for action on actual games, check out thisBetMGM Bonus Code.
1. Puyallup, Washington: The Evergreen Classic
Puyallup is Washington’s Hallmark standout and the top city overall. With more than 13,600 businesses and about 21 inches of December snow, it has plenty of glowing shop windows and wintry sidewalks for chance encounters and holiday parades.
Its historic-place count is modest, but the snow and small-business depth are enough to push it to the top of the Hallmark Likelihood Index. Picture wreaths on every storefront, a farmers market that changes to a holiday market, and a town where everyone actually shows up for the tree lighting.
2. Farmington, Michigan: Storybook Streets in the Snow
Farmington is Michigan’s most Hallmark-coded city, with a strong mix of historic charm and small-town scale. Just over 11,000 people live here, so it feels close-knit, and its historic-places rate (about 0.26 per 1,000 residents) gives the streets some age and character.
Layer in Michigan’s December snow and a healthy 13,257 businesses, and you get the classic setup: independent shops, warm-lit windows, and a town square that looks built for a holiday festival.
3. Poughkeepsie, New York: Hudson Valley Holiday Glow
Poughkeepsie leads New York thanks to a combination of historic depth and a busy local economy. Its historic-place count is notably high, and more than 9,000 businesses keep the downtown corridor humming. Add in New York’s December snowfall and you get an easy holiday movie setting along the Hudson. Think train station reunions, lit-up river views, and strings of lights over brick-lined streets.
4. Price, Utah: Western Main Street With A Vintage Soul
Price is Utah’s surprise climber near the top of the list. Its historic-places count is off the charts, with a lot of listed properties squeezed into a town of about 8,100 people, so it ends up feeling like a ready-made period set. Brick storefronts, old theaters, and a winter backdrop with history front and center do most of the work for you.
In a Hallmark script, the main character doesn't have to look far to find the aging clocktower she is supposed to save while she sorts out Christmas and her love life.
5. Naples, Florida: Sunshine, Palms, And Twinkle Lights
No snow, still plenty of Hallmark potential. Naples is Florida’s most Hallmark-like city thanks to a huge small-business count for its size, which gives it some of the strongest Main Street-style stats in the country.
Historic spots add a bit of texture, even with zero December snow on the books. This is the “holiday in a warm climate” script: palm trees wrapped in lights, seaside walks instead of icy sidewalks, and a packed downtown where the big shopping montage happens in short sleeves.
6. Bangor, Maine: Snowy New England Postcard
Bangor is as Hallmark as Maine gets. Steady December snow, historic bones, and more than 7,400 businesses give those winter streets plenty of life. Think crisp air, brick buildings dusted in white, and a walkable downtown where you can hit a bookshop, grab a coffee, then head to a holiday concert without moving your car.
7. Burlington, Vermont: College Town with Cozy Charm
Burlington tops Vermont thanks to a clean mix of all three metrics: a solid historic-place count, more than 5,700 businesses, and dependable December snow. It reads like a college town that never lost its small-city feel. Busy enough for markets, live music, and quirky shops, but still small enough (at about 44,600 people) that it feels like everyone ends up at the same cocoa stand once the tree is lit.
8. Fairbanks, Alaska: Northern Lights & Neighborhood Lights
Fairbanks is Alaska’s Hallmark pick, and the numbers make it tough to argue. Heavy December snow plus a busy local business base means you get both deep-winter atmosphere and everyday convenience. It's easy to picture the cuts here: a cozy café window, breath on the glass, then a jump outside to auroras sliding over snowy rooftops.
9. Littleton, Colorado: Rocky Mountain Holiday Main Street
Littleton is Colorado’s most Hallmark-like city thanks to a deep small-business bench and a population right in the sweet spot, around 45,000, just under our cutoff.
It's big enough for a real downtown and for a few new faces at the tree lighting, small enough to keep the “everyone knows everyone” feeling in play. Main Street lit up against the Rockies pretty much sells itself.
10. York, Pennsylvania: Brick, Bells, and Boutique Windows
York leads Pennsylvania’s list with strong numbers across the board. Lots of historic buildings and plenty of small businesses mean old brick, church steeples, and busy storefronts made for holiday window-shopping.
With 8.47 inches of average December snow, it's not hard to see downtown York under a fresh layer of white, bells carrying down the street, and a last-scene kiss under a lamppost.
How America’s Towns Capture That Hallmark Glow
Look across the map and a pattern shows up fast: snow-covered main streets, downtowns packed with small businesses instead of chains, and older buildings that give everything a little texture. Put those together and you get places that already feel like a movie set.
Whether you're thinking about a December trip or just killing time between games and looking at pretty winter towns, these spots are where a Hallmark-style story actually feels like it could happen.
Methodology
Here's what went into the Hallmark Likelihood Index. Action Network pulled data on more than 3,000 U.S. towns and scored them on four factors:
- Population size
- Small-business density
- Historic places per 1,000 residents
- December snowfall
We limited the field to incorporated cities between 3,000 and 50,000 people. Big enough for a real Main Street and a few romantic prospects, small enough to still feel neighborly and a little cinematic. Also, because Hallmark towns lean hard on independent bakeries, bookstores, gift shops, cafés, craft stores, and tree farms, we looked closely at small-business density. More small businesses = stronger Main Street energy.
We also weighed historic landmarks against population, meaning cities with no historic places were out. Charm is the whole point, and it's tough for the lead to walk away from a high-powered city job to rehab a historic inn if there's no inn. For winter weather, each city was assigned its state’s average December snowfall. Snow is basically a character in Hallmark movies, so more of it nudged a town’s odds up.
All four metrics were normalized, combined into a single Hallmark Likelihood Index, and used to rank every eligible city. The top-ranked city in each state became that state’s “most Hallmark-like” location. Hawaii did not make the list because of limited data.
You can see the full dataset here.
Sources
- U.S. Census Bureau, American Community Survey (ACS) 5-Year Estimates, 2022: Population & geographic filtering
- Open-Meteo API, December 2024 snowfall totals: State-level snow data
- U.S. Census Bureau, County Business Patterns (CBP 2023): Business counts
- National Park Service, National Register of Historic Places: Historic place counts
City In Each State Where A Hallmark Movie Is Most Likely, Full Chart In Alphabetical Order
| State | City | Implied Probability | Population | December Snow Avg. (In) | Historic Places/Per 1000 | Businesses |
| Alabama | Florence | 0.6% | 40,781 | 0 | 0.91 | 6,540 |
| Alaska | Fairbanks | 3.6% | 32,496 | 14 | 0.95 | 8,210 |
| Arizona | Prescott | 1.0% | 46,054 | 0 | 1.61 | 9,707 |
| Arkansas | Fordyce | 0.7% | 3,386 | 0 | 6.79 | 496 |
| California | Beverly Hills | 2.4% | 32,406 | 0 | 0.28 | 27,315 |
| Colorado | Littleton | 3.3% | 45,531 | 1 | 0.22 | 36,307 |
| Connecticut | Middletown | 1.6% | 48,152 | 6 | 0.73 | 4,324 |
| Delaware | Newark | 1.6% | 30,655 | 1 | 2.71 | 14,191 |
| Florida | Naples | 4.3% | 19,315 | 0 | 0.26 | 51,977 |
| Georgia | Duluth | 1.9% | 31,742 | 0 | 0.03 | 23,059 |
| Idaho | Jerome | 2.7% | 12,482 | 10 | 4.49 | 2,259 |
| Illinois | Crystal Lake | 0.9% | 40,463 | 1 | 0.02 | 7,817 |
| Indiana | Valparaiso | 0.9% | 33,991 | 1 | 0.50 | 8,009 |
| Iowa | Winterset | 1.8% | 5,366 | 5 | 6.90 | 1,059 |
| Kansas | Leawood | 0.7% | 33,784 | 0 | 0.03 | 8,187 |
| Kentucky | Lancaster | 1.6% | 3,943 | 1 | 13.44 | 864 |
| Louisiana | Monroe | 0.8% | 47,631 | 0 | 0.57 | 9,569 |
| Maine | Bangor | 3.8% | 31,705 | 15 | 1.23 | 7,447 |
| Maryland | Annapolis | 1.4% | 40,719 | 0 | 0.79 | 15,330 |
| Massachusetts | Woburn | 2.8% | 40,992 | 10 | 0.22 | 8,673 |
| Michigan | Farmington | 5.0% | 11,486 | 19 | 0.26 | 13,257 |
| Minnesota | Hopkins | 1.1% | 18,752 | 2 | 0.05 | 8,130 |
| Mississippi | Natchez | 1.1% | 14,380 | 0 | 8.28 | 2,727 |
| Missouri | Chesterfield | 0.9% | 49,645 | 0 | 0.12 | 10,900 |
| Montana | Kalispell | 1.4% | 25,473 | 1 | 2.51 | 11,235 |
| Nebraska | Kearney | 0.8% | 33,809 | 1 | 0.50 | 5,752 |
| Nevada | Fallon | 0.8% | 9,243 | 2 | 1.84 | 1,861 |
| New Hampshire | Portsmouth | 2.9% | 22,138 | 10 | 1.90 | 7,826 |
| New Jersey | Princeton | 1.7% | 30,450 | 4 | 0.69 | 10,231 |
| New Mexico | Las Vegas | 0.8% | 13,194 | 0 | 6.75 | 1,297 |
| New York | Poughkeepsie | 4.6% | 31,717 | 18 | 2.93 | 9,044 |
| North Carolina | Hickory | 1.0% | 43,352 | 0 | 0.62 | 10,745 |
| North Dakota | Minot | 2.5% | 48,038 | 9 | 0.27 | 7,060 |
| Ohio | Dublin | 1.4% | 48,893 | 2 | 1.02 | 11,112 |
| Oklahoma | Yukon | 0.5% | 24,198 | 0 | 0.21 | 5,888 |
| Oregon | Lake Oswego | 2.0% | 40,457 | 6 | 0.42 | 8,983 |
| Pennsylvania | York | 3.1% | 44,782 | 8 | 0.45 | 16,695 |
| Rhode Island | Newport | 2.0% | 25,087 | 7 | 2.71 | 4,131 |
| South Carolina | Myrtle Beach | 2.0% | 36,064 | 0 | 0.22 | 24,229 |
| South Dakota | Hot Springs | 1.0% | 3,465 | 2 | 6.06 | 678 |
| Tennessee | Brentwood | 1.2% | 44,830 | 1 | 0.51 | 11,665 |
| Texas | Katy | 2.5% | 22,826 | 0 | 0.09 | 30,020 |
| Utah | Price | 4.4% | 8,174 | 0 | 42.08 | 1,481 |
| Vermont | Burlington | 3.6% | 44,646 | 15 | 1.28 | 5,703 |
| Virginia | Fairfax | 1.9% | 24,242 | 0 | 0.08 | 22,855 |
| Washington | Puyallup | 5.4% | 42,610 | 21 | 0.12 | 13,695 |
| West Virginia | Charleston | 2.6% | 48,415 | 8 | 1.22 | 10,029 |
| Wisconsin | Brookfield | 1.4% | 41,342 | 3 | 0.07 | 9,479 |
| Wyoming | Sheridan | 2.1% | 18,807 | 6 | 0.85 | 10,098 |


