


Feeling lucky today? Some states seem to hit the literal jackpot, with more lottery winners and higher credit scores. Others face tougher odds, from natural disasters to financial stress.
Luck is not just about scratch-offs. It's also shaped by financial stability, personal safety, and day-to-day quality of life. To find the luckiest states, we looked at dozens of data points, from credit scores and workplace accidents to literal lightning strikes, to see where life tends to break your way and where the odds are tougher.
That gave us a list of the luckiest, and unluckiest, states for St. Patrick’s Day. Keep reading to see whether your state is on a roll or on a losing streak.
Key Findings
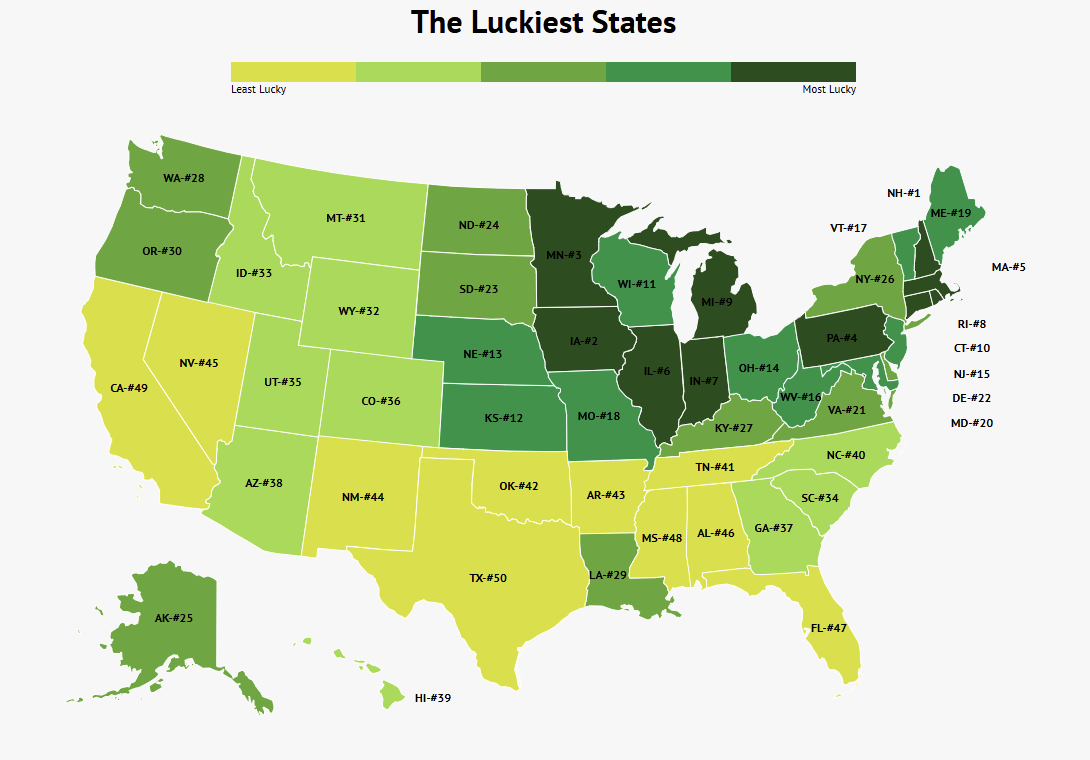
- The luckiest state is New Hampshire, earning the highest overall score thanks to strong financial indicators, low accident rates, and standout pure luck factors like lottery wins and lightning strike frequency.
- Iowa (#2) and Minnesota (#3) round out the top three.
- The least lucky state in the country is Texas, ranking last overall because of frequent natural disasters and weaker lifestyle and safety metrics.
- California and Mississippi also rank near the bottom, but for very different reasons. California struggles with affordability, while Mississippi continues to face health and safety challenges.
- The Midwest dominates the top 15, driven by strong credit scores, affordable housing, and moderate safety risks.
- The South fares worse, particularly in accident deaths, disaster frequency, and divorce rates.
The 10 Luckiest States
| Rank | State | Luck Score(0-100) | Lottery Wins | Average Credit Score | Accidents Deaths per 100k | Irish Population % |
| 1 | New Hampshire | 71.33 | 12 | 727 | 9 | 20 |
| 2 | Iowa | 69.98 | 9 | 719 | 11 | 13 |
| 3 | Minnesota | 68.41 | 23 | 730 | 9 | 10 |
| 4 | Pennsylvania | 67.99 | 22 | 713 | 10 | 15 |
| 5 | Massachusetts | 66.68 | 8 | 723 | 6 | 18. |
| 6 | Illinois | 66.44 | 11 | 712 | 11 | 10 |
| 7 | Indiana | 66.11 | 40 | 704 | 14 | 10 |
| 8 | Rhode Island | 65.58 | 8 | 713 | 6 | 16 |
| 9 | Michigan | 65.54 | 11 | 710 | 11 | 10 |
| 10 | Connecticut | 65.32 | 9 | 717 | 8 | 14 |
*The table above highlights 4 of the 11 factors used to calculate each state’s luck score.
1. New Hampshire – Luck Score: 71.33
- Lottery wins: 12
- Lottery payout per capita: $367
- Average credit score: 727
- Car accident deaths: 9 per 100,000 residents
New Hampshire tops the list as the luckiest state in America, thanks to a rare mix of financial stability, personal safety, and plain old good fortune.
The Granite State has one of the highest average credit scores in the country (727) and a relatively low car accident death rate, helping it score well in both the lifestyle and financial categories. It also recorded 12 major lottery wins and no lightning strike incidents in the data, which gave its "pure luck" score another boost.
New Hampshire also has the highest Irish population share in the U.S. (20%), which fits this St. Patrick's Day ranking pretty well.
2. Iowa – Luck Score: 69.98
- Lottery wins: 9
- Lottery payout per capita: $140
- Average credit score: 719
- Car accident deaths: 11 per 100,000 residents
Iowa's strong finish comes mostly from financial stability and affordability.
The state pairs excellent housing affordability (0.92) with a high average credit score (719), which points to a pretty solid financial foundation overall. Iowa also has low accident death rates and relatively few natural disasters, helping it score well on the safety side.
With nine major lottery wins on record, Iowa shows that quieter Midwestern states can still catch a few breaks.
3. Minnesota – Luck Score: 68.41
- Lottery wins: 23
- Lottery payout per capita: $128
- Average credit score: 730
- Car accident deaths: 9 per 100,000 residents
The state has the highest average credit score in the country (730) and one of the lowest accident death rates (9 per 100,000 residents). On the pure luck side, Minnesota also has 23 major lottery wins, one of the higher totals in the country.
That mix of strong financial habits and solid safety numbers gives the North Star State one of the most balanced luck profiles in the rankings.
4. Pennsylvania – Luck Score: 67.99
- Lottery wins: 22
- Lottery payout per capita: $354
- Average credit score: 713
- Car accident deaths: 10 per 100,000 residents
Pennsylvania benefits from a mix of financial stability and strong lottery results.
The Keystone State has logged 22 major lottery wins and maintains solid housing affordability (0.82) relative to income. It also performs well in lifestyle and safety metrics, including a relatively low car accident death rate of 10 per 100,000 residents.
Add in a large Irish American population (15%), and Pennsylvania lands comfortably among the country's luckiest places to live.
5. Massachusetts – Luck Score: 66.68
- Lottery wins: 8
- Lottery payout per capita: $867
- Average credit score: 723
- Car accident deaths: 6 per 100,000 residents
Massachusetts stands out mostly because of its lottery payouts.
Residents receive the highest lottery payout per capita in the country ($867), more than double what you see in most states. Paired with strong credit scores (723) and excellent safety metrics, that helps make up for the state's high cost of living.
So yes, life in Massachusetts can be expensive, but the numbers suggest residents get more lucky breaks than most.
6. Illinois – Luck Score: 66.44
- Lottery wins: 11
- Lottery payout per capita: $285
- Average credit score: 712
- Car accident deaths: 11 per 100,000 residents
Illinois ranks well because it balances strong financial indicators with solid safety numbers.
The state has 11 major lottery wins, affordable housing levels (0.86), and a relatively low accident death rate of 11 per 100,000 residents.
That combination keeps Illinois among the more steady performers in the national luck rankings.
7. Indiana – Luck Score: 66.11
- Lottery wins: 40
- Lottery payout per capita: $237
- Average credit score: 704
- Car accident deaths: 14 per 100,000 residents
Indiana stands out for one big reason: lottery winners.
The Hoosier State has recorded 40 major lottery wins, one of the highest totals in the country. It also has very strong housing affordability (0.87), which means those winnings could go a bit further here than in a lot of other states.
Its safety metrics are more middle of the pack, but the mix of affordability and frequent lottery success is enough to push Indiana into the top 10.
8. Rhode Island – Luck Score: 65.58
- Lottery wins: 8
- Lottery payout per capita: $543
- Average credit score: 713
- Car accident deaths: 6 per 100,000 residents
Rhode Island is small, but it scores well here.
The Ocean State posts one of the highest lottery payouts per capita ($543) and an extremely low car accident death rate of six per 100,000 residents, one of the lowest marks in the country.
Those numbers help Rhode Island perform especially well in both the financial and safety categories.
9. Michigan – Luck Score: 65.54
- Lottery wins: 11
- Lottery payout per capita: $443
- Average credit score: 710
- Car accident deaths: 11 per 100,000 residents
Michigan earns its spot with a strong mix of affordability and financial health.
The state has affordable housing levels (0.86) and a solid average credit score (710), both of which help drive its financial luck score. Michigan has also recorded 11 major lottery wins and keeps accident death rates relatively moderate.
Put it together, and Michigan looks like a state where a stable financial base helps tilt the odds a bit in your favor.
10. Connecticut – Luck Score: 65.32
- Lottery wins: 9
- Lottery payout per capita: $445
- Average credit score: 717
- Car accident deaths: 8 per 100,000 residents
Connecticut rounds out the top 10 thanks to strong financial indicators and low accident risk.
Residents have high credit scores (717) and a relatively low accident death rate of eight per 100,000 residents, which helps the state score well in the lifestyle category. Connecticut has also recorded nine major lottery wins, reinforcing its place as a state where people do occasionally beat the odds.
The 10 Unluckiest States in America
You've seen the luckiest states. Now here's a look at the states where fortune doesn't seem to be on their side.
1. Texas – Luck Score: 31.35
Texas ranks as the unluckiest state in the country, with high workplace accident rates, high divorce rates, and other poor marks dragging down its overall score.
2. California – Luck Score: 38.69
California's high cost of living and weak housing affordability weigh heavily on its score. Money is not everything, but it's harder to feel lucky when basic living costs eat up so much of your budget.
3. Mississippi – Luck Score: 41.11
The Magnolia State ranks as the third unluckiest state overall. Low financial stability and very few lottery wins both contribute to its position near the bottom.
4. Florida – Luck Score: 41.34
Florida may be sunny and popular with retirees, but the numbers are rough here. The state is more exposed to natural disasters, high accident rates, and broader lifestyle risks.
5. Alabama – Luck Score: 44.23
Lifestyle challenges and middling financial scores pull Alabama down in the rankings. Residents also don't have a state lottery, which removes one more path to a lucky break.
What Actually Makes a State “Lucky”?
Luck isn't just about scratch-offs and jackpots, even if those are the first things most people think of. It also shows up in financial stability, personal safety, and environmental risk.
No state can control lightning strikes or natural disasters, but some deal with those risks far more often than others. Affordability, credit health, and accident rates also shape the bigger picture. Of course, your own luck may not line up perfectly with your state's score. Still, if you're looking to hedge your bets geographically, New Hampshire looks like a pretty good place to start.
If you want to see how lucky you are, online prediction markets offer another way to test your instincts on real-world events. A few places to start:
- Kalshi Referral Code: Trade on real-world events and see if your instincts pay off.
- Best Prediction Market Apps: Compare the top platforms for trading event outcomes.
So whether you're tracking lottery trends, watching natural disaster patterns, or just leaning into the St. Patrick's Day angle, these tools give you another way to take your shot.
Methodology
To find the luckiest states, we grouped luck into three categories: pure luck, lifestyle and safety, and finances, then measured each state across 11 factors.
Pure Luck
- Lottery wins
- Lottery payout per capita
- Lightning strikes
- Irish population percentage
Financial Luck
- Cost of living
- Housing affordability
- Average credit score
Lifestyle & Safety Luck
- Car accident deaths per 100,000 residents
- Natural disasters
- Workplace accidents
- Divorce rates
Each state received a Financial Luck Index, Lifestyle Index, and Pure Luck Index. Those scores were then averaged into a Final Luck Score to determine the overall rankings. You can see the full dataset here.
Sources
Data for the State Luck Index was compiled from a range of public datasets, government agencies, and research organizations.
- Powerball Jackpot History (Winners since 2002)
- Mega Millions Jackpot History (Winners since 1992)
- The Motley Fool Lottery Statistics Research (Lottery Payout Data, Since 2023)
- Lightning strike data from the Centers for Disease Control and Prevention (CDC)
- Natural disaster frequency estimates from World Population Review
- Car accident fatality rates from the National Highway Traffic Safety Administration (NHTSA)
- Workplace fatal injury statistics from the U.S. Bureau of Labor Statistics
- Divorce rates from the CDC National Center for Health Statistics>
- Irish population percentages by state from World Population Review
- Cost of Living Index from World Population Review
- Housing affordability data compiled by Visual Capitalist
- Average credit score data from Equifax
The Luckiest (And Unluckiest) States, All 50 States Ranked From Luckiest To Least
| Rank | State | Luck Score (0–100) | Lottery Wins | Average Credit Score | Accident Deaths per 100k | Irish Population % |
| 1 | New Hampshire | 71.33 | 12 | 727 | 9 | 20 |
| 2 | Iowa | 69.98 | 9 | 719 | 11 | 13 |
| 3 | Minnesota | 68.41 | 23 | 730 | 9 | 10 |
| 4 | Pennsylvania | 67.99 | 22 | 713 | 10 | 15 |
| 5 | Massachusetts | 66.68 | 8 | 723 | 6 | 18 |
| 6 | Illinois | 66.44 | 11 | 712 | 11 | 11 |
| 7 | Indiana | 66.11 | 40 | 704 | 14 | 10 |
| 8 | Rhode Island | 65.58 | 8 | 713 | 6 | 16 |
| 9 | Michigan | 65.54 | 11 | 710 | 11 | 10 |
| 10 | Connecticut | 65.32 | 9 | 717 | 8 | 14 |
| 11 | Wisconsin | 63.94 | 20 | 727 | 11 | 10 |
| 12 | Kansas | 63.82 | 14 | 712 | 14 | 11 |
| 13 | Nebraska | 63.72 | 10 | 720 | 11 | 11 |
| 14 | Ohio | 63.58 | 10 | 706 | 12 | 12 |
| 15 | New Jersey | 62.96 | 23 | 717 | 8 | 12 |
| 16 | West Virginia | 62.90 | 9 | 693 | 16 | 12 |
| 17 | Vermont | 62.85 | 1 | 726 | 11 | 17 |
| 18 | Missouri | 61.69 | 33 | 705 | 17 | 12 |
| 19 | Maine | 61.53 | 1 | 720 | 11 | 16 |
| 20 | Maryland | 61.43 | 5 | 706 | 9 | 9 |
| 21 | Virginia | 61.09 | 5 | 712 | 11 | 9 |
| 22 | Delaware | 59.10 | 10 | 705 | 14 | 14 |
| 23 | South Dakota | 58.82 | 4 | 722 | 17 | 10 |
| 24 | North Dakota | 58.19 | 0 | 720 | 13 | 7 |
| 25 | Alaska | 57.78 | 0 | 709 | 9 | 9 |
| 26 | New York | 57.78 | 29 | 713 | 6 | 10 |
| 27 | Kentucky | 56.67 | 19 | 695 | 18 | 11 |
| 28 | Washington | 53.35 | 4 | 722 | 9 | 9 |
| 29 | Louisiana | 53.14 | 17 | 680 | 21 | 7 |
| 30 | Oregon | 52.32 | 7 | 717 | 14 | 11 |
| 31 | Montana | 51.32 | 4 | 720 | 22 | 13 |
| 32 | Wyoming | 51.21 | 0 | 713 | 19 | 12 |
| 33 | Idaho | 51.11 | 5 | 718 | 14 | 9 |
| 34 | South Carolina | 51.10 | 8 | 692 | 23 | 9 |
| 35 | Utah | 50.83 | 0 | 719 | 10 | 6 |
| 36 | Colorado | 50.76 | 3 | 720 | 12 | 11 |
| 37 | Georgia | 49.02 | 11 | 686 | 17 | 7 |
| 38 | Arizona | 47.73 | 17 | 703 | 16 | 8 |
| 39 | Hawaii | 47.39 | 0 | 719 | 7 | 5 |
| 40 | North Carolina | 47.20 | 6 | 699 | 16 | 8 |
| 41 | Tennessee | 47.18 | 9 | 697 | 19 | 9 |
| 42 | Oklahoma | 46.72 | 4 | 687 | 19 | 10 |
| 43 | Arkansas | 46.41 | 2 | 688 | 23 | 9 |
| 44 | New Mexico | 45.62 | 5 | 695 | 23 | 7 |
| 45 | Nevada | 44.78 | 0 | 691 | 12 | 8 |
| 46 | Alabama | 44.23 | 0 | 685 | 20 | 8 |
| 47 | Florida | 41.34 | 21 | 698 | 17 | 8 |
| 48 | Mississippi | 41.11 | 1 | 675 | 26 | 7 |
| 49 | California | 38.69 | 35 | 712 | 11 | 6 |
| 50 | Texas | 31.35 | 9 | 686 | 15 | 6 |


