


As the Fourth of July approaches, millions of Americans are prepping for a legendary evening of charred burgers, cold drinks, and backyard pyrotechnics. This year, families across the country will light up the night with small (or big) explosions to celebrate. However, not all neighborhood skies are created equal.
While a professional municipal show carries minimal threat to you in your lawn chair, amateur backyard displays are a different story. With consumer firework volume doubling over the last two decades, so too have backyard firework injuries. Some states are cultural hotbeds for heavy consumer mortar shells, while others restrict celebrations and are far more restrained.
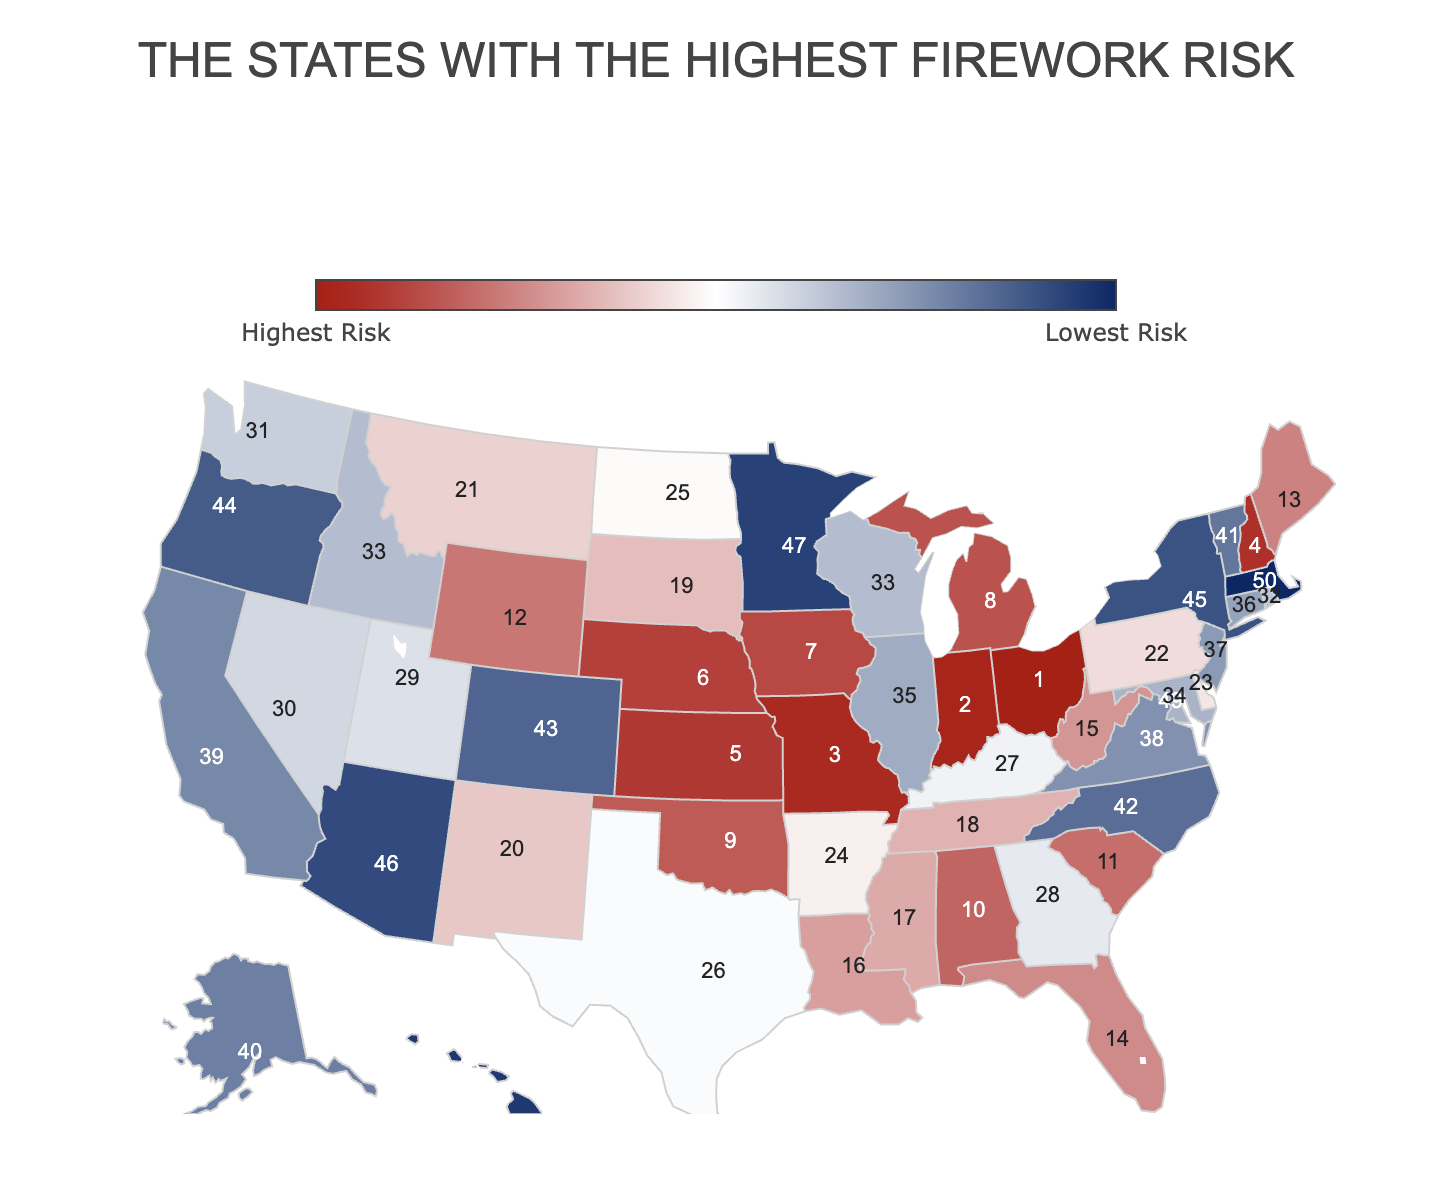
We blended the latest trade shipment numbers, real-time consumer intent trends, and state-level legal restrictions to reveal which states host the highest-risk backyard celebrations.
Key Findings
- The highest-risk state in the nation is Ohio, where an active backyard participant faces a modeled 3.54% chance of a holiday mishap or property flare-up.
- The Midwest dominates the extreme danger zone, with Indiana (#2), Missouri (#3), and Kansas (#5) all landing in the top five due to massive seasonal import footprints.
- The state with the lowest overall firework risk is Massachusetts, with a low risk of 0.02% (1-in-5,000) due to strict, actively enforced consumer bans.
- While federal data highlights roughly 13,004 to 14,700 emergency room visits nationwide annually, epidemiologists estimate that the actual "backyard footprint" of minor, home-treated burns and property flare-ups is 4 to 10 times higher.
- Across the nation, Americans consume a staggering 322.4 million pounds of fireworks annually, transforming local neighborhoods into intense, concentrated risk zones on July 4th night.
The Top 10 Highest Risk States for Backyard Fireworks
| Rank | State / Territory | Legal Category | Implied Probability | Odds (1-in-x) |
| 1 | Ohio | Tier 1: Full Consumer | 3.54% | 1-in-28 |
| 2 | Indiana | Tier 1: Full Consumer | 2.93% | 1-in-34 |
| 3 | Missouri | Tier 1: Full Consumer | 2.76% | 1-in-36 |
| 4 | New Hampshire | Tier 1: Full Consumer | 2.58% | 1-in-39 |
| 5 | Kansas | Tier 1: Full Consumer | 2.49% | 1-in-40 |
| 6 | Nebraska | Tier 1: Full Consumer | 2.40% | 1-in-42 |
| 7 | Iowa | Tier 1: Full Consumer | 2.13% | 1-in-47 |
| 8 | Michigan | Tier 1: Full Consumer | 2.01% | 1-in-50 |
| 9 | Oklahoma | Tier 1: Full Consumer | 1.95% | 1-in-51 |
| 10 | Alabama | Tier 1: Full Consumer | 1.86% | 1-in-54 |
*Note on Probability Framework:The percentages and odds displayed represent a predictive exposure model calculated by weighting state-level trade volume against active consumer search intent and regional legal categories. These figures represent comparative statistical volatility during peak holiday windows and are intended for analytical and illustrative indexing rather than localized real-world accident forecasting.
1. Ohio
- Implied Probability: 3.54%
- Odds: 1-in-28
Ohio combines a massive international import footprint ($3.50 per person) with a near-maximum consumer interest score of 93. Because full aerial cakes and reloadable mortar shells are legal, large multi-family block parties in the Buckeye State carry the highest statistical chance of a backyard mishap or property flare-up in the nation.
2. Indiana
- Implied Probability: 2.93%
- Odds: 1-in-34
Indiana is an absolute juggernaut for fireworks, importing a massive $3.89 per capita. It also acts as a primary "border-hopping" pipeline for residents traveling from neighboring Illinois, where aerial items are banned. This economic concentration builds an incredibly dense hazard profile for local hoosier gatherings.
3. Missouri
- Implied Probability: 2.76%
- Odds: 1-in-36
Missouri is the undisputed corporate distribution capital of the fireworks industry, clearing a hefty $85.7 million in direct imports ($13.84 per capita). While the "hub effect" means many of these boxes are trucked out of state, the local cultural enthusiasm (76 interest score) ensures a highly explosive environment on July 4th night.
4. New Hampshire
- Implied Probability: 2.58%
- Odds: 1-in-39
New Hampshire serves as New England’s premier pyrotechnic escape valve. Flaunting an incredibly high consumer interest score of 94, Granite State retailers supply an immense wave of local and out-of-state buyers, driving the localized probability of a backyard holiday mishap into the extreme hazard zone.
5. Kansas
- Implied Probability: 2.49%
- Odds: 1-in-40
With massive open fields and a hefty $8.79 per capita import footprint, Kansas residents face high localized probabilities. The widespread availability of heavy consumer mortar tubes sets a high statistical ceiling for potential property and physical accidents.
6. Nebraska
- Implied Probability: 2.40%
- Odds: 1-in-42
Nebraska ranks right alongside its Midwestern neighbors, maintaining an intense import footprint ($7.02 per person) and a strong 80 score for consumer intent, locking its backyard celebrations into the top tier of national holiday risk.
7. Iowa
- Implied Probability: 2.13%
- Odds: 1-in-47
Iowa’s consumer interest spikes to an impressive 81 during the summer season. Combined with a healthy local supply chain, an active backyard street display in Iowa pushes past the 2% probability threshold for a localized holiday mishap.
8. Michigan
- Implied Probability: 2.01%
- Odds: 1-in-50
Michigan rounds out the extreme hazard tier, squeezing right into a 1-in-50 probability window. Its liberal consumer laws allow full access to large, multi-shot aerial displays that keep local fire departments on high alert.
9. Oklahoma
- Implied Probability: 1.95%
- Adjusted Backyard Odds: 1-in-51
Oklahoma's combination of dry mid-summer vegetation and a high density of consumer aerial purchases creates an elevated blend of physical trauma risk and localized property fire potential.
10. Alabama
- Implied Probability: 1.86%
- Odds: 1-in-54
Leading the deep South, Alabama pairs a massive $6.13 per capita import value with steady seasonal demand, securing the final slot in the nation's top ten highest-risk backyard environments.
Hedging Your Backyard Bets
Amateur pyrotechnics are an undeniable cornerstone of American summer culture. But, whether it comes down to culture or access, some states are far more reckless than others.
Yet, no one can perfectly predict a faulty fuse, a sudden gust of wind, or an erratic mortar shell. So regardless of where you light your fuses, keeping a bucket of water nearby and increasing your safety radius might be a good idea.
Just like tracking holiday hazard maps, calculating the odds of real-world outcomes is a skill that translates directly to the forecasting space. If you want to put your analytical instincts to the test on everything from climate patterns to economic events, checking out the broader market landscapes can be a compelling next step:
- Polymarket promo code: Take a position on real-world event frequencies and trade on your data insights.
- How to "bet" on Polymarket: Learn the ins-and-outs of using Polymarket
Whether you are analyzing seasonal distribution data, adjusting for legal restrictions, or simply trying to keep your lawn intact this July 4th, understanding the underlying numbers is the ultimate way to tilt the odds back in your favor.
Each State's Firework Risk, Ranked From Most To Least
| Rank | State / Territory | Legal Category | Peak Implied Probability | Peak Adjusted Odds (1-in-x) | Backyard Hazard Level |
| 1 | Ohio | Tier 1: Full Consumer | 3.54% | 1-in-28 | 🛑 Extreme Peak Hazard |
| 2 | Indiana | Tier 1: Full Consumer | 2.93% | 1-in-34 | 🛑 Extreme Peak Hazard |
| 3 | Missouri | Tier 1: Full Consumer | 2.76% | 1-in-36 | 🛑 Extreme Peak Hazard |
| 4 | New Hampshire | Tier 1: Full Consumer | 2.58% | 1-in-39 | 🛑 Extreme Peak Hazard |
| 5 | Kansas | Tier 1: Full Consumer | 2.49% | 1-in-40 | 🛑 Extreme Peak Hazard |
| 6 | Nebraska | Tier 1: Full Consumer | 2.40% | 1-in-42 | 🛑 Extreme Peak Hazard |
| 7 | Iowa | Tier 1: Full Consumer | 2.13% | 1-in-47 | 🛑 Extreme Peak Hazard |
| 8 | Michigan | Tier 1: Full Consumer | 2.01% | 1-in-50 | 🛑 Extreme Peak Hazard |
| 9 | Oklahoma | Tier 1: Full Consumer | 1.95% | 1-in-51 | 🛑 Extreme Peak Hazard |
| 10 | Alabama | Tier 1: Full Consumer | 1.86% | 1-in-54 | 🛑 Extreme Peak Hazard |
| 11 | South Carolina | Tier 1: Full Consumer | 1.63% | 1-in-61 | 🔴 High Peak Hazard |
| 12 | Wyoming | Tier 1: Full Consumer | 1.59% | 1-in-63 | 🔴 High Peak Hazard |
| 13 | Maine | Tier 1: Full Consumer | 1.41% | 1-in-71 | 🔴 High Peak Hazard |
| 14 | Florida | Tier 1: Full Consumer | 1.26% | 1-in-79 | 🔴 High Peak Hazard |
| 15 | West Virginia | Tier 1: Full Consumer | 1.23% | 1-in-81 | 🔴 High Peak Hazard |
| 16 | Louisiana | Tier 1: Full Consumer | 1.19% | 1-in-84 | 🔴 High Peak Hazard |
| 17 | Mississippi | Tier 1: Full Consumer | 1.17% | 1-in-85 | 🔴 High Peak Hazard |
| 18 | Tennessee | Tier 1: Full Consumer | 1.14% | 1-in-88 | 🔴 High Peak Hazard |
| 19 | South Dakota | Tier 1: Full Consumer | 1.08% | 1-in-93 | 🔴 High Peak Hazard |
| 20 | New Mexico | Tier 1: Full Consumer | 1.05% | 1-in-95 | 🔴 High Peak Hazard |
| 21 | Montana | Tier 1: Full Consumer | 0.99% | 1-in-101 | 🟡 Moderate Peak Hazard |
| 22 | Pennsylvania | Tier 1: Full Consumer | 0.98% | 1-in-102 | 🟡 Moderate Peak Hazard |
| 23 | Delaware | Tier 1: Full Consumer | 0.96% | 1-in-104 | 🟡 Moderate Peak Hazard |
| 24 | Arkansas | Tier 1: Full Consumer | 0.92% | 1-in-109 | 🟡 Moderate Peak Hazard |
| 25 | North Dakota | Tier 1: Full Consumer | 0.89% | 1-in-112 | 🟡 Moderate Peak Hazard |
| 26 | Texas | Tier 1: Full Consumer | 0.85% | 1-in-118 | 🟡 Moderate Peak Hazard |
| 27 | Kentucky | Tier 1: Full Consumer | 0.82% | 1-in-122 | 🟡 Moderate Peak Hazard |
| 28 | Georgia | Tier 1: Full Consumer | 0.79% | 1-in-126 | 🟡 Moderate Peak Hazard |
| 29 | Utah | Tier 1: Full Consumer | 0.77% | 1-in-130 | 🟡 Moderate Peak Hazard |
| 30 | Nevada | Tier 1: Full Consumer | 0.76% | 1-in-132 | 🟡 Moderate Peak Hazard |
| 31 | Washington | Tier 1: Full Consumer | 0.70% | 1-in-143 | 🟡 Moderate Peak Hazard |
| 32 | Rhode Island | Tier 2: Safe & Sane | 0.60% | 1-in-166 | 🟡 Moderate Peak Hazard |
| 33 | Idaho | Tier 2: Safe & Sane | 0.58% | 1-in-172 | 🟡 Moderate Peak Hazard |
| 34 | Wisconsin | Tier 2: Safe & Sane | 0.49% | 1-in-204 | 🟢 Low Peak Hazard |
| 35 | Maryland | Tier 2: Safe & Sane | 0.48% | 1-in-208 | 🟢 Low Peak Hazard |
| 36 | Illinois | Tier 2: Safe & Sane | 0.38% | 1-in-263 | 🟢 Low Peak Hazard |
| 37 | Connecticut | Tier 2: Safe & Sane | 0.37% | 1-in-270 | 🟢 Low Peak Hazard |
| 38 | New Jersey | Tier 2: Safe & Sane | 0.35% | 1-in-285 | 🟢 Low Peak Hazard |
| 39 | Virginia | Tier 2: Safe & Sane | 0.33% | 1-in-303 | 🟢 Low Peak Hazard |
| 40 | California | Tier 2: Safe & Sane | 0.32% | 1-in-315 | 🟢 Low Peak Hazard |
| 41 | Alaska | Tier 1: Full Consumer | 0.32% | 1-in-312 | 🟢 Low Peak Hazard |
| 42 | Vermont | Tier 2: Safe & Sane | 0.23% | 1-in-435 | 🟢 Low Peak Hazard |
| 43 | North Carolina | Tier 2: Safe & Sane | 0.18% | 1-in-555 | 🟢 Low Peak Hazard |
| 44 | Colorado | Tier 2: Safe & Sane | 0.17% | 1-in-588 | 🟢 Low Peak Hazard |
| 45 | Oregon | Tier 2: Safe & Sane | 0.16% | 1-in-625 | 🟢 Low Peak Hazard |
| 46 | New York | Tier 2: Safe & Sane | 0.13% | 1-in-769 | 🟢 Low Peak Hazard |
| 47 | Arizona | Tier 2: Safe & Sane | 0.13% | 1-in-769 | 🟢 Low Peak Hazard |
| 48 | Minnesota | Tier 2: Safe & Sane | 0.11% | 1-in-909 | 🟢 Low Peak Hazard |
| 49 | Hawaii | Tier 2: Safe & Sane | 0.10% | 1-in-1,000 | 🟢 Low Peak Hazard |
| 50 | District of Columbia | Tier 2: Safe & Sane | 0.03% | 1-in-3,333 | 🟢 Low Peak Hazard |
| 51 | Massachusetts | Tier 3: Absolute Ban | 0.02% | 1-in-5,000 | 🟢 Low Peak Hazard |
*Note on Probability Framework:The percentages and odds displayed represent a predictive exposure model calculated by weighting state-level trade volume against active consumer search intent and regional legal categories. These figures represent comparative statistical volatility during peak holiday windows and are intended for analytical and illustrative indexing rather than localized real-world accident forecasting.
Methodology
To calculate a truly realistic "backyard hazard probability" rather than an abstract population average, our data model filters out non-participants and isolates the exact environments where accidents happen. The Fireworks Exposure Index relies on three distinct pillars:
- Supply Footprint (U.S. Census Bureau USA Trade Online): We pulled the most recent 2024–2026 data tracking the value of imported fireworks by State of Destination. Adjusting this by total population yields a "Per Capita Import Value," identifying where heavy consumer explosive supply lines are concentrated.
- Behavioral Intent (Regional Google Search Trends): We tracked localized search volume for consumer fireworks during the peak operational window (late June through mid-July). This captures consumer enthusiasm and immediate demand.
- Legal Severity Modifiers (American Pyrotechnics Association): We weighted each state by its baseline restrictions. Tier 1 states (full aerials/mortars legal) carry no reduction in risk. Tier 2 states ("Safe and Sane" novelty laws) receive a 50% risk reduction for severe blast injuries, as items like heavy aerial shells are restricted. Tier 3 states (absolute consumer bans) receive a 90% reduction due to minimal legal backyard exposure.
- The "Iceberg" Multiplier: Recognizing that federal hospital registries (NEISS) ignore minor, home-treated incidents, we applied a conservative 5x epidemiological multiplier to baseline emergency data to account for localized first-degree burns, singed hair, and minor property brush fires. This is an operational assumption based on published public health epidemiological frameworks, which consistently demonstrate that the vast majority of minor first-degree burns, singed hair incidents, and minor property brush flares are managed safely at home or by local first responders without generating a formal hospital admission log.
Finally, we modeled a Peak High-Risk Scenario- isolating the two-hour window on July 4th night when alcohol consumption spikes, lighting fuses accelerates, and heavy aerial devices are deployed.
You can see the full data here.


