


I’m dreaming of a …. White Thanksgiving?
It might not have the same ring as a white Christmas, but some parts of the U.S. actually have decent odds of seeing snow on Thanksgiving.
Action Network analyzed more than five decades of Thanksgiving weather data from NOAA climate stations nationwide to calculate the likelihood of a White Thanksgiving in cities across the country. To qualify, a city must have at least 1 inch of snow on the ground on Thanksgiving Day or receive at least 0.1 inches of new snowfall that day—the same criteria the National Weather Service uses for a White Christmas.
Some cold-weather heavyweights underperform, while a few surprising cities quietly deliver better odds than their reputations suggest. And yes—even places where people spend November in T-shirts have a small shot at holiday flakes (emphasis on small).
Keep reading to see your city’s chances of a White Thanksgiving—and where turkey day looks the most like a Christmas postcard.
Key findings
- Anchorage (64.5%) is the only major U.S. city where a White Thanksgiving is more likely than not.
- Fargo (43.9%) and Minneapolis (43.6%) top the Lower 48, but even these winter giants fall short of a coin-flip.
- Syracuse (38.6%), Rochester (33.3%), and Buffalo (31.6%) are the most reliable Thanksgiving snow cities east of Minnesota.
- Several “Sleeper” Cities Beat Famous Winter Hubs:Boise (14%), Pittsburgh (17.5%), Cedar Rapids (17.9%), and Connecticut’s coastal cities (14%) all show higher odds than Boston and Chicago.
- Salt Lake City lands at 33.3%, while Spokane reaches 32.7%; These cities beat Chicago, Boston, Detroit, and nearly every major Midwestern metro, despite being rarely included in “snowiest city” conversations.
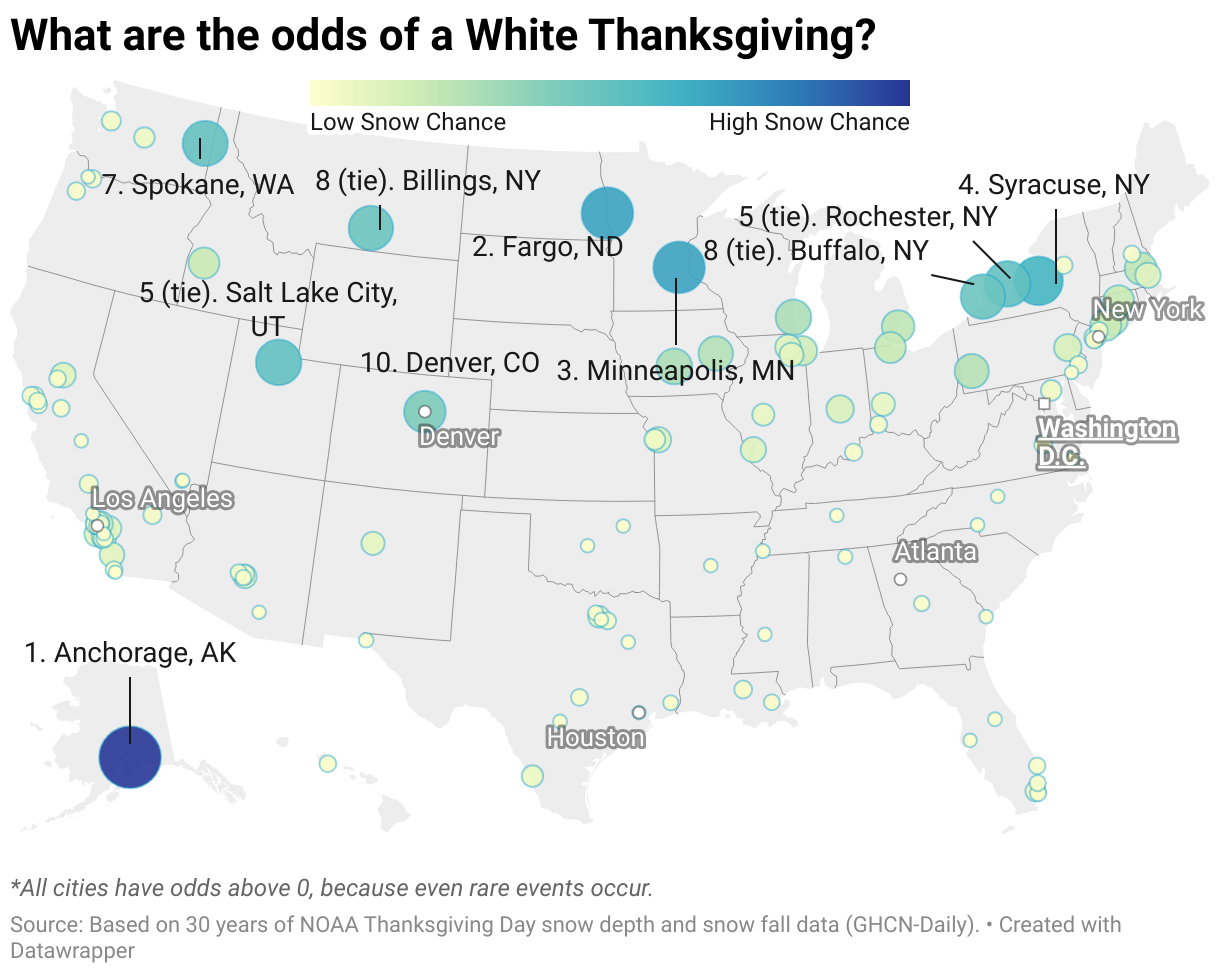
Cities Most Likely To Have A White Thanksgiving
The table below shows each city’s rank, its implied probability, and American odds of a White Thanksgiving, along with average and record Thanksgiving snowfall.
| Rank | City | Chance of White Thanksgiving | Avg Snow on Thanksgiving | Record Thanksgiving Snow | American Odds |
| 1 | Anchorage, AK | 64.5% | 5" | 22" | -181 |
| 2 | Fargo, ND | 43.9% | 2" | 16" | +128 |
| 3 | Minneapolis, MN | 43.6% | 2" | 10" | +129 |
| 4 | Syracuse, NY | 38.6% | 1" | 9" | +159 |
| 5 (tie) | Rochester, NY | 33.3% | 1" | 8" | +200 |
| 5 (tie) | Salt Lake City, UT | 33.3% | 1" | 7" | +200 |
| 7 | Spokane, WA | 32.7% | 1" | 11" | +206 |
| 8 (tie) | Buffalo, NY | 31.6% | 1" | 20" | +217 |
| 8 (tie) | Billings, MT | 31.6% | 2" | 15" | +217 |
| 10 | Denver, CO | 27.3% | 1" | 7" | +267 |
These odds are for entertainment purposes only. Interested in other odds? Check out this Caesars Sportsbook Promo Code. If you are more interested in real-life outcomes (like weather), you can use this Kalshi referral code.
1. Anchorage, Alaska — 64.5%
America’s icy outlier. Anchorage, Alaska, is the only major U.S. city with better-than-even odds—nearly two-thirds of Thanksgivings are white. Deep early-season snowpack and cold November temperatures make it the hands-down champion.
- Largest Thanksgiving Snow Depth: 22.0"
- Average Thanksgiving Snowfall: 0.62"
2. Fargo, North Dakota — 43.9%
The Northern Plains heavyweight. Fargo’s long, harsh winters kick in early, giving it almost a 50/50 shot at waking up to snow on Thanksgiving.
- Largest Thanksgiving Snow Depth: 16.0"
- Average Thanksgiving Snowfall: 0.29"
3. Minneapolis, Minnesota — 43.6%
There's Minnesota Nice… and then there's Minnesota Icy. Minneapolis narrowly trails Fargo, thanks to consistently cold Novembers and frequent early storms.
- Largest Thanksgiving Snow Depth: 10.0"
- Average Thanksgiving Snowfall: 0.43"
4. Syracuse, New York — 38.6%
Lake-Effect Country flexes hard. Syracuse gets blasted early and often, giving it the highest odds east of the Mississippi.
- Largest Thanksgiving Snow Depth: 9.1"
- Average Thanksgiving Snowfall: 0.50"
5. Rochester, New York — 33.3%
Another Great Lakes specialist. Rochester frequently sees early-season snow bands, pushing its Thanksgiving odds to a solid one-in-three.
- Largest Thanksgiving Snow Depth: 8.0"
- Average Thanksgiving Snowfall: 0.27"
5. Salt Lake City, Utah — 33.3%
Mountain weather delivers. Cold early-season fronts plus Wasatch snow influence give SLC surprisingly strong odds—even higher than many Midwest metros.
- Largest Thanksgiving Snow Depth: 7.0"
- Average Thanksgiving Snowfall: 0.18"
7. Spokane, Washington — 32.7%
The snowy side of Washington. Inland Northwest cold snaps make Spokane a quiet powerhouse for early winter weather.
- Largest Thanksgiving Snow Depth: 11.0"
- Average Thanksgiving Snowfall: 0.24"
8 (tie). Buffalo, New York — 31.6%
America’s most snow-famous city doesn’t disappoint. Lake Erie regularly fires up early-season lake-effect snow, giving Buffalo a 1-in-3 likelihood of a white holiday.
- Largest Thanksgiving Snow Depth: 20.0"
- Average Thanksgiving Snowfall: 0.33"
8 (tie). Billings, Montana — 31.6%
A sneaky snow performer. Billings benefits from early-season cold, upslope storms, and occasional Arctic fronts rolling down the Rockies.
- Largest Thanksgiving Snow Depth: 15"
- Average Thanksgiving Snowfall: 0.13"
10. Denver, Colorado — 27.3%
Mile-High, but not a slam dunk. Denver still has solid odds for a White Thanksgiving, but its snowfall is highly volatile—big years are mixed with many dry ones, keeping it below the true snow kings like Fargo, Syracuse, and Buffalo.
- Largest Thanksgiving Snow Depth: 7.0"
- Average Thanksgiving Snowfall: 0.06"
Biggest Over Performers (Snowier Than People Think)
These cities quietly punch above their weight — places the average American would never guess have solid White Thanksgiving odds.
- Cedar Rapids, Iowa — 17.9%
- Pittsburgh, Pennsylvania — 17.5%
- Boise, Idaho — 14.0%
- Bridgeport, Hartford & Stamford, Connecticut— 14.0%
- Kansas City, Missouri — 5.5%
Methodology
We analyzed Thanksgiving Day weather observations from NOAA climate stations between 1970 and 2024 for 115 cities. A “White Thanksgiving” was counted if:
- Snow depth (SNWD) was ≥ 1.0 inch, or
- New snowfall (SNOW) was ≥ 0.1 inch on Thanksgiving Day.
Cities with fewer than 10 years of valid data were excluded.
To avoid extreme results in cities with limited snowfall history, we applied Bayesian smoothing and modeled Thanksgiving snow depth using a simple exponential distribution based on each station’s average snow depth. We used an exponential distribution because most Thanksgiving snow years have little or no snow, while only a few years see unusually large amounts. No city has 0% odds. This is to reflect that rare events (while unlikely) do happen.
Each city uses its primary, most complete station (usually the main airport or long-term climate site). A few cities share a station due to proximity.
You can see the full data here.
Source: NOAA daily station data (GHCN-Daily / related NCEI feeds), one station per city, 1970–2024
Snowflakes Are Not on the Menu Everywhere This Thanksgiving
Crunching the numbers shows just how elusive a snowy Thanksgiving really is. Among more than 150 cities, only one has a better-than-even chance, only 9 get above 30%, and most Americans fall squarely in the 3–15% zone. Dozens barely have a 5% shot.
Which means that if your mashed potatoes come with snowflakes this year, savor it—it’s one of the rarest holiday treats of all. A White Thanksgiving isn’t guaranteed anywhere, even in Anchorage… except maybe on TV.
Each City’s Odds Of A White Thanksgiving
| Rank | City | Chance of White Thanksgiving |
| 1 | Anchorage, AK | 64.5% |
| 2 | Fargo, ND | 43.9% |
| 3 | Minneapolis, MN | 43.6% |
| 4 | Syracuse, NY | 38.6% |
| 5 (tie) | Rochester, NY | 33.3% |
| 5 (tie) | Salt Lake City, UT | 33.3% |
| 7 | Spokane, WA | 32.7% |
| 8 (tie) | Buffalo, NY | 31.6% |
| 8 (tie) | Billings, MT | 31.6% |
| 10 | Denver, CO | 27.3% |
| 11 (tie) | Milwaukee, WI | 19.3% |
| 11 (tie) | Des Moines, IA | 19.3% |
| 13 | Cedar Rapids, IA | 17.9% |
| 14 | Pittsburgh, PA | 17.5% |
| 15 | Detroit, MI | 15.8% |
| 16 | Lowell, MA | 15.2% |
| 17 | Boise, ID | 14.0% |
| 18 (tie) | Toledo, OH | 14.0% |
| 18 (tie) | Bridgeport, CT | 14.0% |
| 18 (tie) | Hartford, CT | 14.0% |
| 18 (tie) | Stamford, CT | 14.0% |
| 22 | Chicago, IL | 12.5% |
| 23 (tie) | Indianapolis, IN | 10.5% |
| 23 (tie) | Allentown, PA | 10.5% |
| 25 | Elgin, IL | 8.9% |
| 26 (tie) | Boston, MA | 8.8% |
| 26 (tie) | St. Louis, MO | 8.8% |
| 26 (tie) | Independence, MO | 8.8% |
| 29 (tie) | Long Beach, CA | 8.3% |
| 29 (tie) | Santa Ana, CA | 8.3% |
| 29 (tie) | Ontario, CA | 8.3% |
| 29 (tie) | Oceanside, CA | 8.3% |
| 29 (tie) | Pomona, CA | 8.3% |
| 29 (tie) | Pasadena, CA | 8.3% |
| 29 (tie) | Roseville, CA | 8.3% |
| 36 | Naperville, IL | 7.7% |
| 37 (tie) | Albuquerque, NM | 7.1% |
| 37 (tie) | Dayton, OH | 7.1% |
| 37 (tie) | Glendale, AZ | 7.1% |
| 37 (tie) | Gilbert, AZ | 7.1% |
| 41 | Springfield, MO | 6.3% |
| 42 (tie) | Laredo, TX | 5.9% |
| 42 (tie) | Lewisville, TX | 5.9% |
| 44 | Kansas City, MO | 5.5% |
| 45 (tie) | Washington, DC | 5.3% |
| 45 (tie) | Baltimore, MD | 5.3% |
| 45 (tie) | Newark, NJ | 5.3% |
| 48 (tie) | Mesa, AZ | 5.0% |
| 48 (tie) | Hialeah, FL | 5.0% |
| 48 (tie) | Hollywood, FL | 5.0% |
| 51 | Seattle, WA | 4.4% |
| 52 (tie) | Oakland, CA | 4.0% |
| 52 (tie) | Bakersfield, CA | 4.0% |
| 52 (tie) | San Bernardino, CA | 4.0% |
| 52 (tie) | Costa Mesa, CA | 4.0% |
| 56 | Richmond, VA | 3.8% |
| 57 | Baton Rouge, LA | 3.7% |
| 58 (tie) | San Francisco, CA | 3.6% |
| 58 (tie) | Salem, OR | 3.6% |
| 58 (tie) | Gresham, OR | 3.6% |
| 61 (tie) | New York, NY | 3.5% |
| 61 (tie) | Philadelphia, PA | 3.5% |
| 61 (tie) | Louisville, KY | 3.5% |
| 61 (tie) | Jersey City, NJ | 3.5% |
| 61 (tie) | Yonkers, NY | 3.5% |
| 61 (tie) | Elizabeth, NJ | 3.5% |
| 67 | Cincinnati, OH | 3.4% |
| 68 (tie) | Los Angeles, CA | 3.2% |
| 68 (tie) | San Diego, CA | 3.2% |
| 68 (tie) | Austin, TX | 3.2% |
| 68 (tie) | Sacramento, CA | 3.2% |
| 68 (tie) | Honolulu, HI | 3.2% |
| 68 (tie) | Irvine, CA | 3.2% |
| 68 (tie) | Garland, TX | 3.2% |
| 68 (tie) | Fremont, CA | 3.2% |
| 68 (tie) | Modesto, CA | 3.2% |
| 68 (tie) | Pasadena, TX | 3.2% |
| 68 (tie) | Hayward, CA | 3.2% |
| 68 (tie) | Concord, CA | 3.2% |
| 80 | West Palm Beach, FL | 3.1% |
| 81 | Phoenix, AZ | 3.0% |
| 82 (tie) | Miami, FL | 2.9% |
| 82 (tie) | Fort Lauderdale, FL | 2.9% |
| 84 (tie) | New Orleans, LA | 2.7% |
| 84 (tie) | Chandler, AZ | 2.7% |
| 86 | Macon, GA | 2.6% |
| 87 (tie) | Denton, TX | 2.4% |
| 87 (tie) | Beaumont, TX | 2.4% |
| 89 | El Paso, TX | 2.2% |
| 90 | Huntsville, AL | 2.1% |
| 91 | Memphis, TN | 2.0% |
| 92 | Norfolk, VA | 1.9% |
| 93 (tie) | San Antonio, TX | 1.9% |
| 93 (tie) | Carrollton, TX | 1.9% |
| 95 | Orlando, FL | 1.9% |
| 96 (tie) | Nashville, TN | 1.8% |
| 96 (tie) | Little Rock, AR | 1.8% |
| 98 | Tucson, AZ | 1.8% |
| 99 (tie) | Houston, TX | 1.8% |
| 99 (tie) | Charlotte, NC | 1.8% |
| 99 (tie) | Oklahoma City, OK | 1.8% |
| 99 (tie) | Portland, OR | 1.8% |
| 99 (tie) | Las Vegas, NV | 1.8% |
| 99 (tie) | Fresno, CA | 1.8% |
| 99 (tie) | Tulsa, OK | 1.8% |
| 99 (tie) | Tampa, FL | 1.8% |
| 99 (tie) | Anaheim, CA | 1.8% |
| 99 (tie) | Henderson, NV | 1.8% |
| 99 (tie) | Greensboro, NC | 1.8% |
| 99 (tie) | Chula Vista, CA | 1.8% |
| 99 (tie) | North Las Vegas, NV | 1.8% |
| 99 (tie) | Santa Clarita, CA | 1.8% |
| 99 (tie) | Jackson, MS | 1.8% |
| 99 (tie) | Savannah, GA | 1.8% |
| 99 (tie) | Wilmington, NC | 1.8% |


