


Thanksgiving week is shaping up to be one of the busiest travel periods on record. This year, the American Automobile Association (AAA) expects 81.8 million Americans to hit the road between November 25 and December 1—a surge that places even more pressure on cities already known for heavy traffic, unpredictable weather, or frequent roadway slowdowns.
Whether you’re driving across town or several states away, your experience can vary dramatically depending on where you live or where you’re traveling. Some metros are primed for smooth travel. Others all but guarantee delays before you’ve even merged onto the highway.
To understand where drivers are most likely to experience holiday slowdowns, Action Network built the Thanksgiving Road Disruption Index 2025, a 110-city model that measures the likelihood of encountering traffic, weather-related delays, and accident-driven bottlenecks during peak travel week.
Each city receives a final implied probability of road disruption, along with American-style Road Disruption Odds for a clearer comparison. Higher probabilities indicate a greater chance of running into delays.
Key Findings
These patterns set the stage for a clearer look at where travelers should expect the heaviest slowdowns—and where the holiday drive will be much smoother. Below is the full ranking of all 110 cities, ordered by their likelihood of Thanksgiving road disruption.
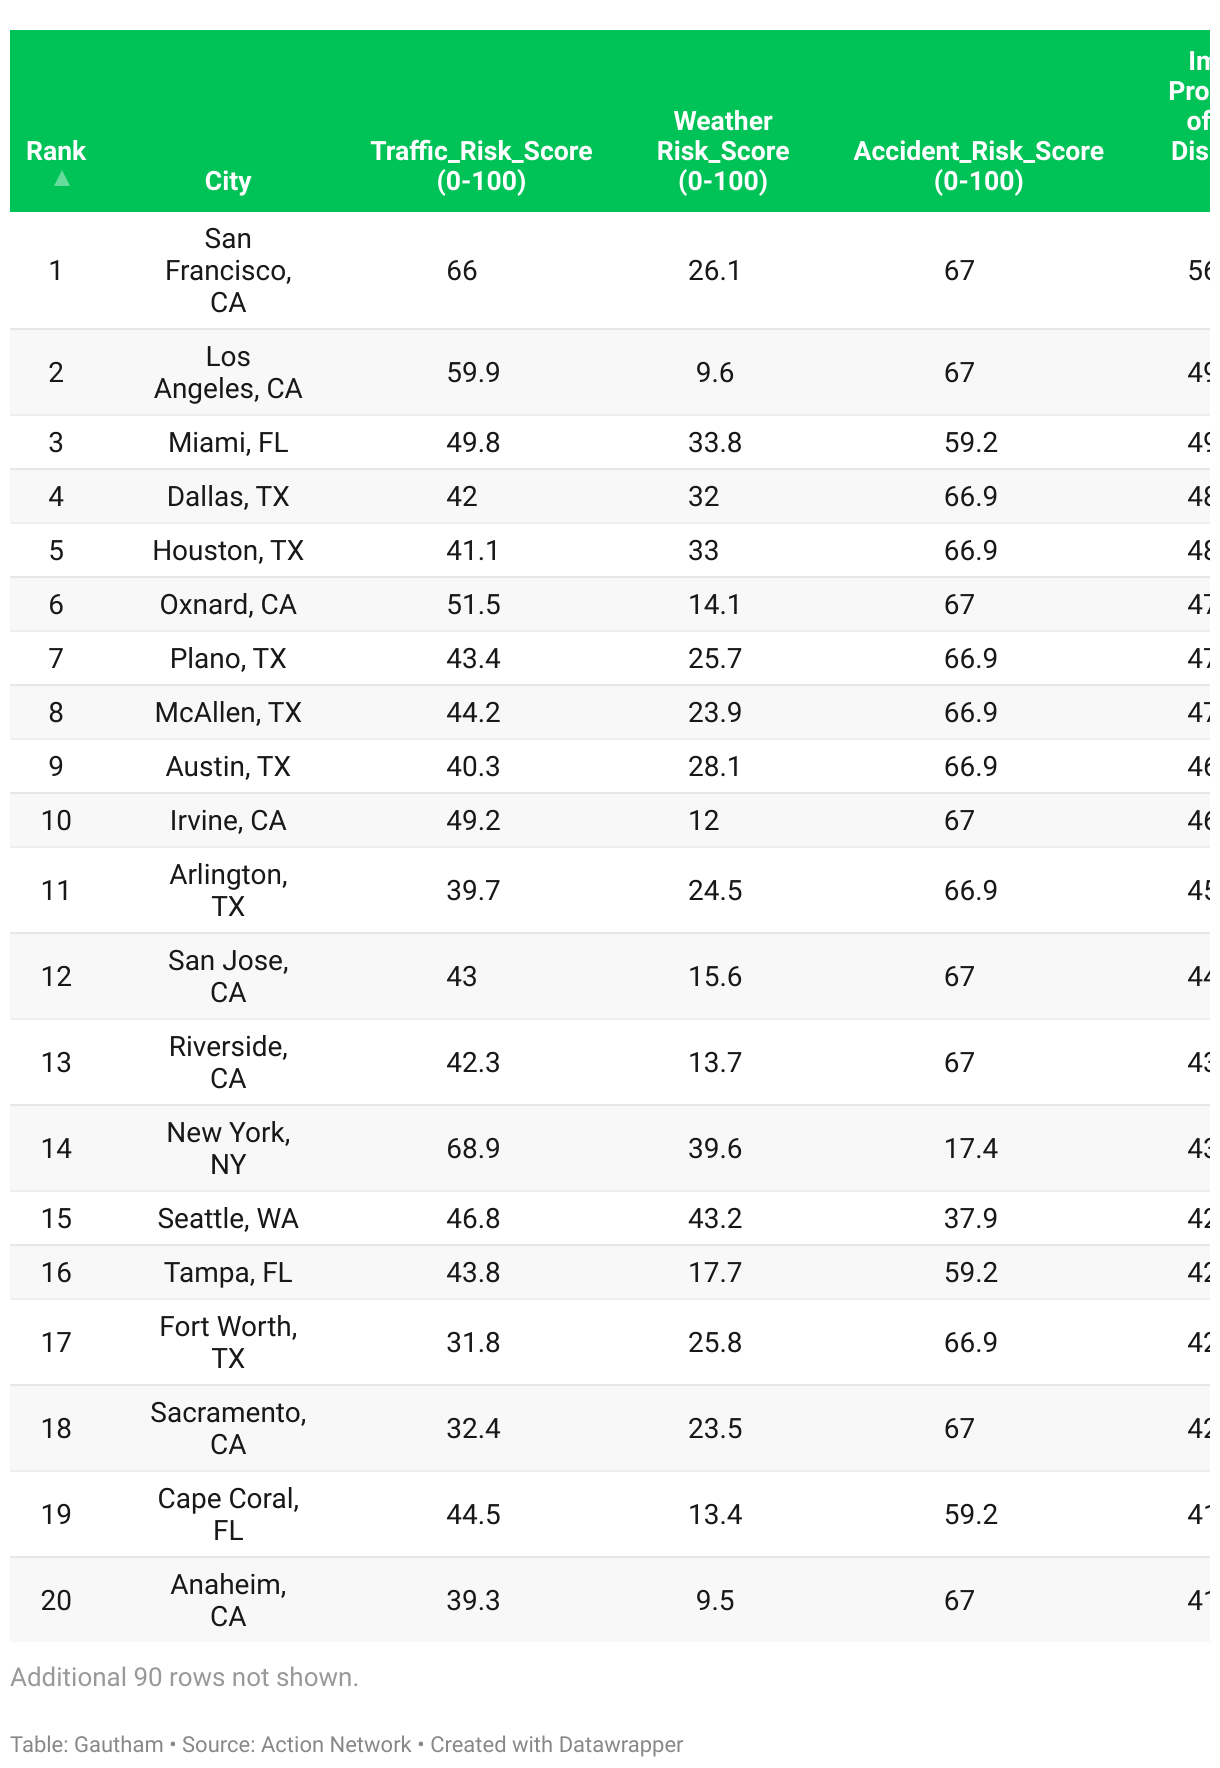
Top 10 Cities Most Likely to Experience Thanksgiving Road Disruption
1. San Francisco, California
San Francisco records the highest congestion among major metros at 32% and one of the slowest travel times in the country at 25 minutes per 6 miles. Elevated accident-related delays further push the city to the top of the disruption list.
- Traffic Risk Score: 66/100
- Weather Risk Score: 26.1/100
- Accident Risk Score: 67/100
- Implied Probability: 56.40%
- Road Disruption Odds: –125
2. Los Angeles, California
Los Angeles posts the nation’s heaviest congestion at 43%. While travel times average a relatively quick 15 minutes per 6 miles, the extreme roadway volume creates major disruption pressure during Thanksgiving week.
- Traffic Risk Score: 59.9/100
- Weather Risk Score: 9.6/100
- Accident Risk Score: 67/100
- Implied Probability: 49.80%
- Road Disruption Odds: +100
3. Miami, Florida
Miami faces 33% congestion and above-average November weather disruptions at 11.4 days. Combined with steady traffic flow, these pressures create a nearly even chance of encountering delays.
- Traffic Risk Score: 49.8/100
- Weather Risk Score: 33.8/100
- Accident Risk Score: 59.2/100
- Implied Probability: 49.10%
- Road Disruption Odds: +105
4. Dallas, Texas
Dallas records 30% congestion with moderate November weather impacts and some of the strongest accident-risk indicators in the dataset, landing it comfortably inside the top tier.
- Traffic Risk Score: 42/100
- Weather Risk Score: 32/100
- Accident Risk Score: 66.9/100
- Implied Probability: 48.20%
- Road Disruption Odds: +105
5. Houston, Texas
Houston posts 31% congestion and steady corridor use, but consistently elevated accident activity makes the city especially prone to holiday slowdowns.
- Traffic Risk Score: 41.1/100
- Weather Risk Score: 33/100
- Accident Risk Score: 66.9/100
- Implied Probability: 48.10%
- Road Disruption Odds: +110
6. Oxnard, California
Oxnard’s 28% congestion and quick travel speeds at 14.5 minutes per 6 miles still lead to a high likelihood of disruptions due to some of the strongest accident-risk values recorded.
- Traffic Risk Score: 51.5/100
- Weather Risk Score: 14.1/100
- Accident Risk Score: 67/100
- Implied Probability: 47.60%
- Road Disruption Odds: +110
7. Plano, Texas
Plano sees 28% congestion with travel times near 13 minutes per 6 miles. Combined with strong accident patterns, the city lands firmly in the top 10.
- Traffic Risk Score: 43.4/100
- Weather Risk Score: 25.7/100
- Accident Risk Score: 66.9/100
- Implied Probability: 47.20%
- Road Disruption Odds: +110
8. McAllen, Texas
McAllen maintains 25% congestion and fast travel speeds, yet increased accident-driven slowdown pushes its Thanksgiving risk upward.
- Traffic Risk Score: 44.2/100
- Weather Risk Score: 23.9/100
- Accident Risk Score: 66.9/100
- Implied Probability: 47.10%
- Road Disruption Odds: +110
9. Austin, Texas
Austin experiences 27% congestion with travel times around 13 minutes per 6 miles. Rapid growth and strong accident-risk scores contribute to its high disruption likelihood.
- Traffic Risk Score: 40.3/100
- Weather Risk Score: 28.1/100
- Accident Risk Score: 66.9/100
- Implied Probability: 46.60%
- Road Disruption Odds: +115
10. Irvine, California
Irvine records 34% congestion and corridor speeds near 13 minutes per 6 miles. Combined with high accident-risk levels, the city rounds out the top 10.
- Traffic Risk Score: 49.2/100
- Weather Risk Score: 12/100
- Accident Risk Score: 67/100
- Implied Probability: 46.10%
- Road Disruption Odds: +115
Top 10 Cities Least Likely to Experience Thanksgiving Road Disruption
1. Omaha, Nebraska
Omaha posts just 12% congestion and some of the fastest travel times in America at 10 minutes per 6 miles, resulting in the lowest disruption probability nationwide.
- Traffic Risk Score: 21.7/100
- Weather Risk Score: 25.6/100
- Accident Risk Score: 2.9/100
- Implied Probability: 16.10%
- Road Disruption Odds: +500
2. Council Bluffs, Iowa
With 11% congestion and fast travel speeds at 9 minutes per 6 miles, Council Bluffs offers some of the smoothest Thanksgiving travel conditions in the country.
- Traffic Risk Score: 20.2/100
- Weather Risk Score: 26.4/100
- Accident Risk Score: 13.5/100
- Implied Probability: 19.40%
- Road Disruption Odds: +400
3. Wichita, Kansas
Wichita maintains 13% congestion and consistently fast travel speeds at 10 minutes per 6 miles, keeping Thanksgiving disruption risk very low.
- Traffic Risk Score: 23.8/100
- Weather Risk Score: 32.7/100
- Accident Risk Score: 5.2/100
- Implied Probability: 19.50%
- Road Disruption Odds: +400
4. Salt Lake City, Utah
Salt Lake City sees 18% congestion with fast travel speeds of 10.5 minutes per 6 miles. Snowy November weather doesn’t overwhelm the city’s efficient roadway network.
- Traffic Risk Score: 26/100
- Weather Risk Score: 29.8/100
- Accident Risk Score: 6.3/100
- Implied Probability: 20.10%
- Road Disruption Odds: +400
5. Hartford, Connecticut
Hartford’s 13% congestion and steady travel speeds at 12 minutes per 6 miles keep the city in the lower-risk tier for Thanksgiving delays.
- Traffic Risk Score: 19.8/100
- Weather Risk Score: 35.3/100
- Accident Risk Score: 11.6/100
- Implied Probability: 20.80%
- Road Disruption Odds: +400
6. Minneapolis, Minnesota
Minneapolis posts 19% congestion and efficient travel speeds near 12 minutes per 6 miles, helping offset its high number of November weather days (26.8).
- Traffic Risk Score: 28.4/100
- Weather Risk Score: 25.1/100
- Accident Risk Score: 9.4/100
- Implied Probability: 20.90%
- Road Disruption Odds: +400
7. St. Paul, Minnesota
St. Paul maintains 15% congestion and travel times under 12 minutes, balancing out a snowy November and keeping disruption risk low.
- Traffic Risk Score: 25.3/100
- Weather Risk Score: 30.9/100
- Accident Risk Score: 9.4/100
- Implied Probability: 21.10%
- Road Disruption Odds: +350
8. Oklahoma City, Oklahoma
Oklahoma City sees 16% congestion and fast corridor speeds of 9.5 minutes per 6 miles, giving it one of the lowest traffic burdens during the holiday week.
- Traffic Risk Score: 24.6/100
- Weather Risk Score: 29.9/100
- Accident Risk Score: 12.1/100
- Implied Probability: 21.60%
- Road Disruption Odds: +350
9. Reno, Nevada
Reno posts 16% congestion and efficient travel speeds near 12 minutes per 6 miles, with limited November weather impacts keeping disruption odds low.
- Traffic Risk Score: 29.3/100
- Weather Risk Score: 17.5/100
- Accident Risk Score: 16.1/100
- Implied Probability: 21.70%
- Road Disruption Odds: +350
10. St. Louis, Missouri
St. Louis, Missouri, records 16% congestion with travel speeds of 11 minutes per 6 miles, creating one of the more predictable Thanksgiving driving environments.
- Traffic Risk Score: 22.3/100
- Weather Risk Score: 30.1/100
- Accident Risk Score: 22.9/100
- Implied Probability: 24.50%
- Road Disruption Odds: +300
What Drives Thanksgiving Road Disruption?
Traffic Pressure: Congestion levels and corridor strain prove to be the strongest predictors of slowdowns.
Weather: Rain, snow, storms, and temperature swings increase the likelihood of delays, especially across northern metros.
Accident Risk: Holiday travel correlates with higher crash rates, contributing to bottlenecks and extended travel times.
What These Results Reveal
California and Texas dominate the highest disruption probabilities due to large populations, heavy corridor reliance, and strong accident pressures. Meanwhile, lower-density metros like Omaha, Wichita, and Oklahoma City benefit from faster travel speeds and lighter congestion, resulting in smoother holiday conditions.
Methodology
The Thanksgiving Road Disruption Index evaluates 110 U.S. cities using three weighted components:
- Traffic (40%): Congestion %, average travel time per 6 miles, vehicles per household
- Weather (35%): Average November temperature & rainfall, inclement-weather days
- Accident Risk (25%): Crash incidence and holiday safety indicators
Each metric was normalized to a 0–100 scale. Final disruption probabilities were converted into American-style odds using standard sportsbook formulas.
Sources
- AAA Thanksgiving Travel Forecast
- INRIX Traffic Data
- Open-Meteo Climate Archives
- State DOT Safety Databases
- U.S. Census Bureau


