


Welcome to Week 5 of the college football season.
With it comes October, pumpkin spice and spooky season. However, Action Network readers haven't needed to fear losing, as this articles owns a record of 2-0-1 (and no, I will never stop complaining about the Texas Tech push).
Last week, I suggested the Tennessee team total over, and guess what? It hit! So, hopefully we can keep this streak going!
If you're new to this article, thank you for checking it out! This breakdown looks at three metrics that have been found to be relevant to covering the spread:
If you are interested in why these metrics have been chosen, check out this piece by Collin Wilson. To quote his findings:
“Data from the past five years indicates defensive Success Rate, Havoc and Finishing Drives are the biggest indicators in beating oddsmakers this college football season.”
Let’s dive in and see where we can find an edge in Week 5.
![]()
![]()
![]()
Havoc
What is Havoc?
Havoc is a college football term defined as a play where there’s an unexpected outcome.
Pass breakups, forced fumbles and tackles for loss are just a few of the plays that cause chaos on any given Saturday. Collectively, these plays are used to build an identity for a team.
The calculation for Havoc is simply a cumulative number of tackles for loss, interceptions, fumbles and passes defensed divided by the number of plays on both sides of the ball.
Let's see where we can find some big Havoc discrepancies in Week 4:
Home Team Havoc Allowed vs. Away Team Havoc Rate
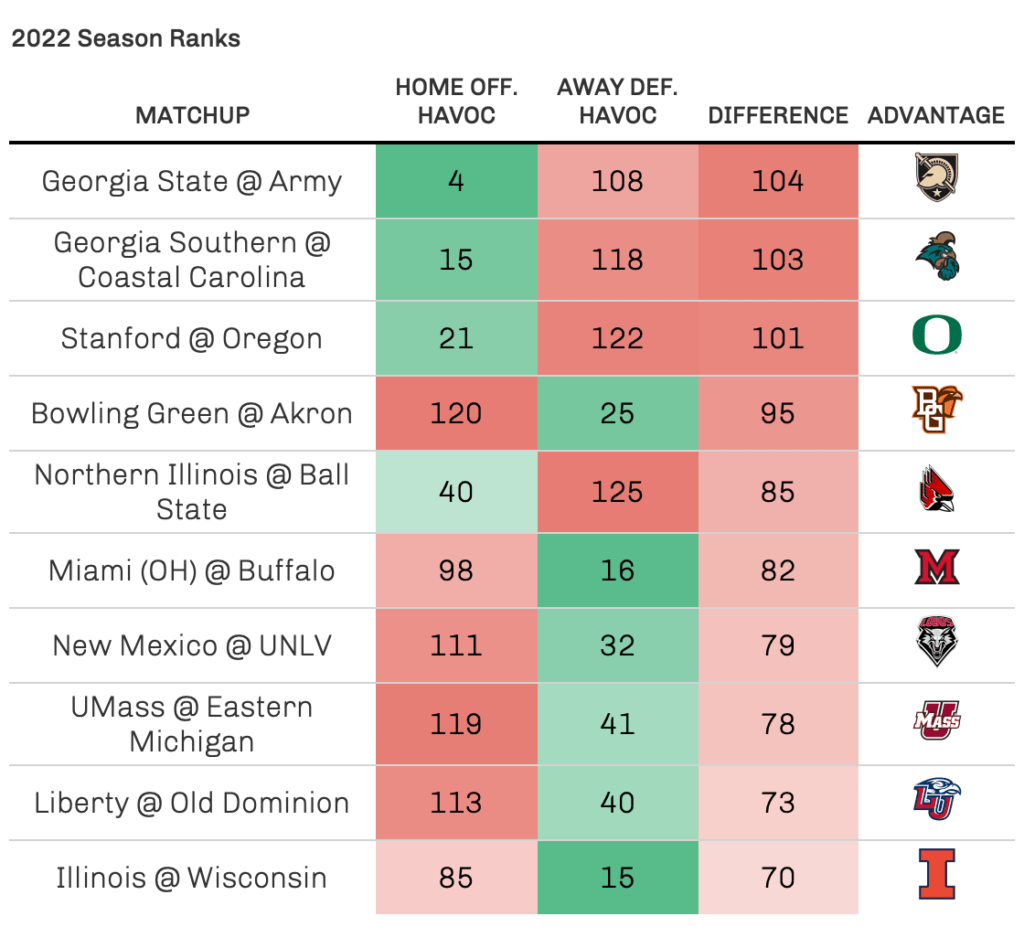 |
Top 3 Havoc Mismatches (Home Offense vs. Away Defense)
- Army Black Knights Offense vs. Georgia State Panthers Defense
- Coastal Carolina Chanticleers Offense vs. Georgia Southern Eagles Defense
- Oregon Ducks Offense vs. Stanford Cardinal Defense
Away Team Havoc Allowed vs. Home Team Havoc Rate
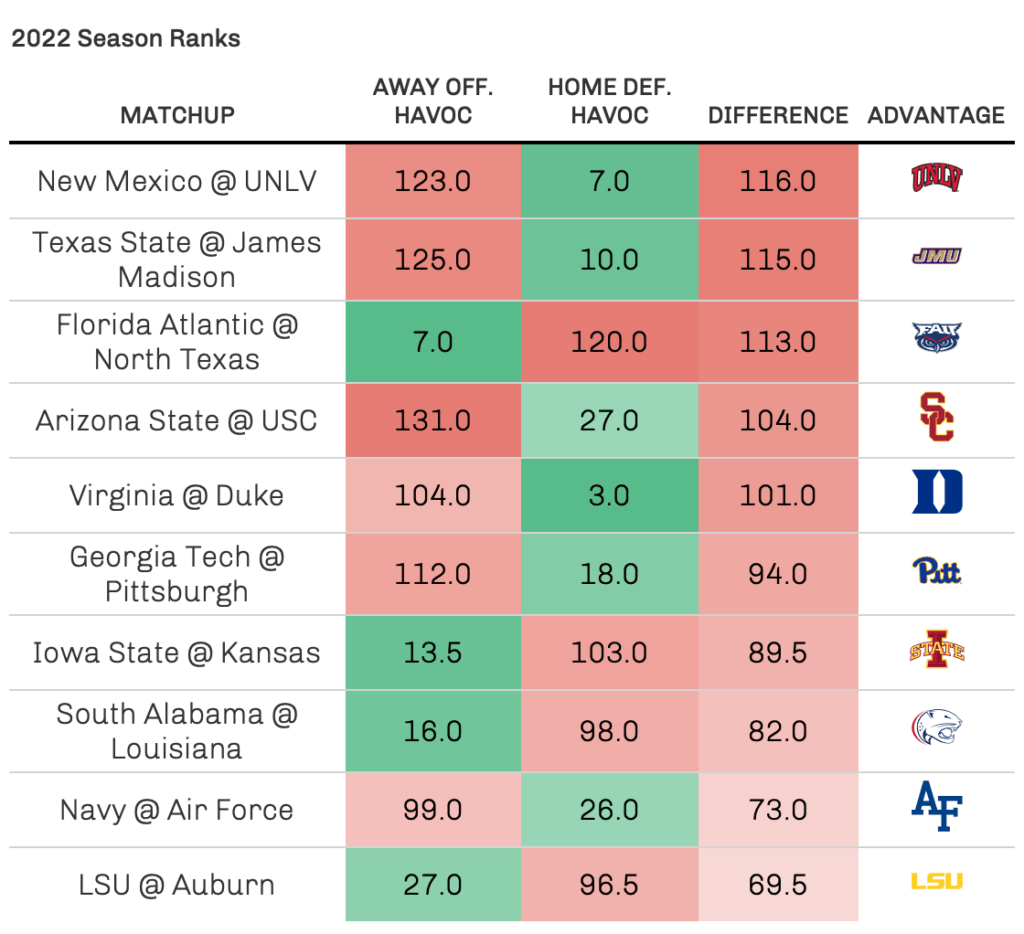 |
Top 3 Havoc Mismatches (Away Offense vs. Home Defense)
- UNLV Rebels Defense vs. New Mexico Lobos Offense
- James Madison Dukes Defense vs. Texas State Bobcats Offense
- Florida Atlantic Owls Offense vs. North Texas Mean Green Defense
Success Rate
What is Success Rate?
Success Rate is an advanced metric in football that measures efficiency, but with the important context of down and distance considered.
A play is defined as successful if:
- It gains at least 50% of the yards required to move the chains on first down
- 70% of yards to gain on second down
- 100% of yards to gain on third or fourth down
To calculate Success Rate, simply divide the number of successful plays (as defined by down and distance above) by total plays.
This definition is taken from our article on Success Rate.
Home Team Offensive Success Rate vs. Away Team Defensive Success Rate
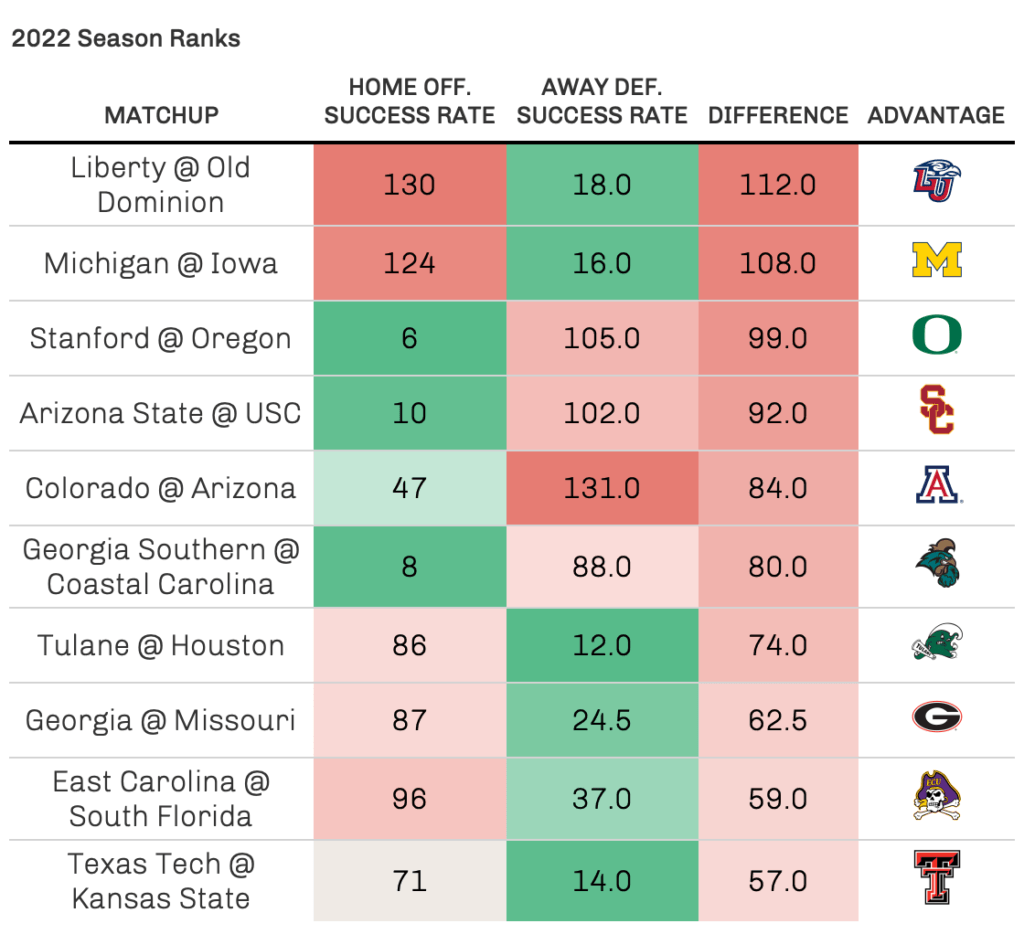 |
Top 3 Success Rate Mismatches (Home Offense vs. Away Defense)
- Liberty Flames Defense vs. ODU's Offense
- Michigan's Defense vs. Iowa's Offense
- Oregon's Offense vs. Stanford's Defense
Away Team Offensive Success Rate vs. Home Team Defensive Success Rate
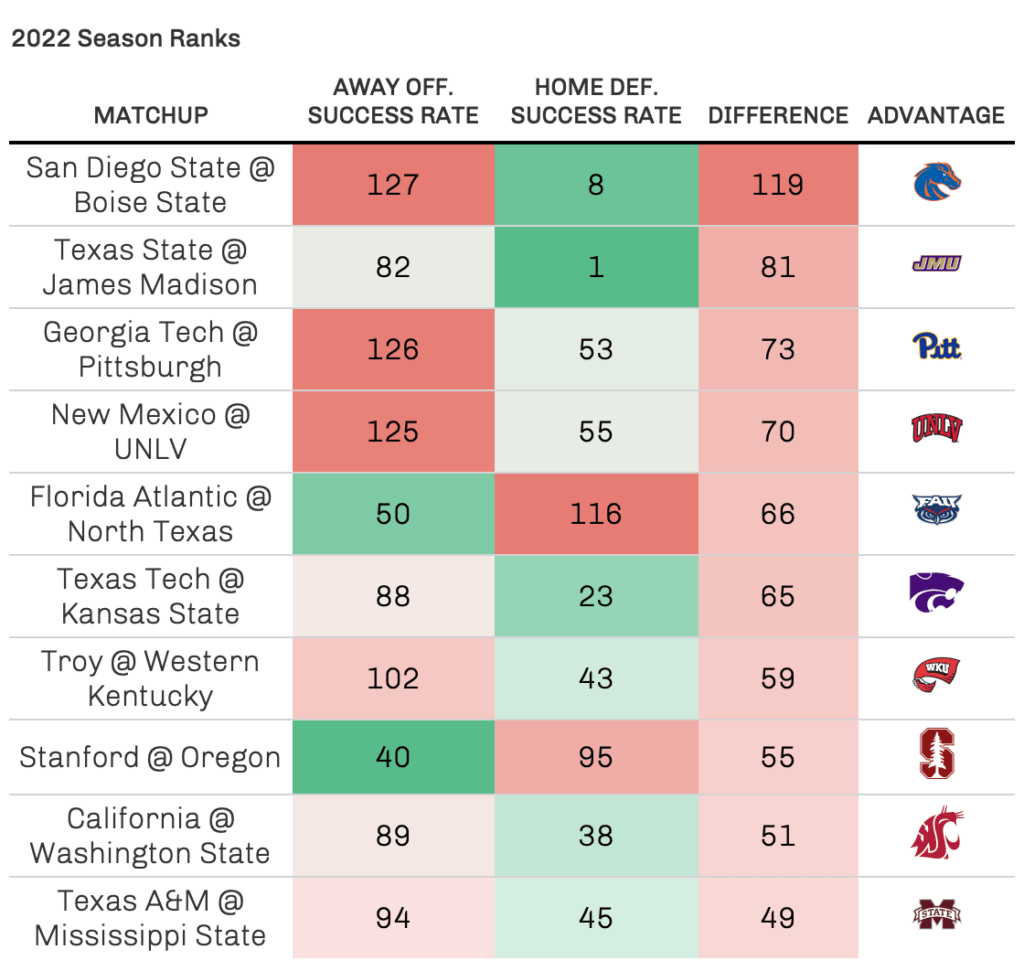 |
Top 3 Success Rate Mismatches (Away Offense vs. Home Defense)
- Boise State's Defense vs. San Diego State's Offense
- James Madison's Defense vs. Texas State's Offense
- Pitt's Defense vs. Georgia Tech's Offense
Finishing Drives
What is Finishing Drives?
Finishing Drivesis calculated as points per opportunity when the offense passes the opponent’s 40-yard line.
Defensively, this is how many points per opportunity a defense allows when the opposing offense crosses the 40-yard line.
Home Team Offensive Finishing Drives vs. Away Team Defensive Finishing Drives
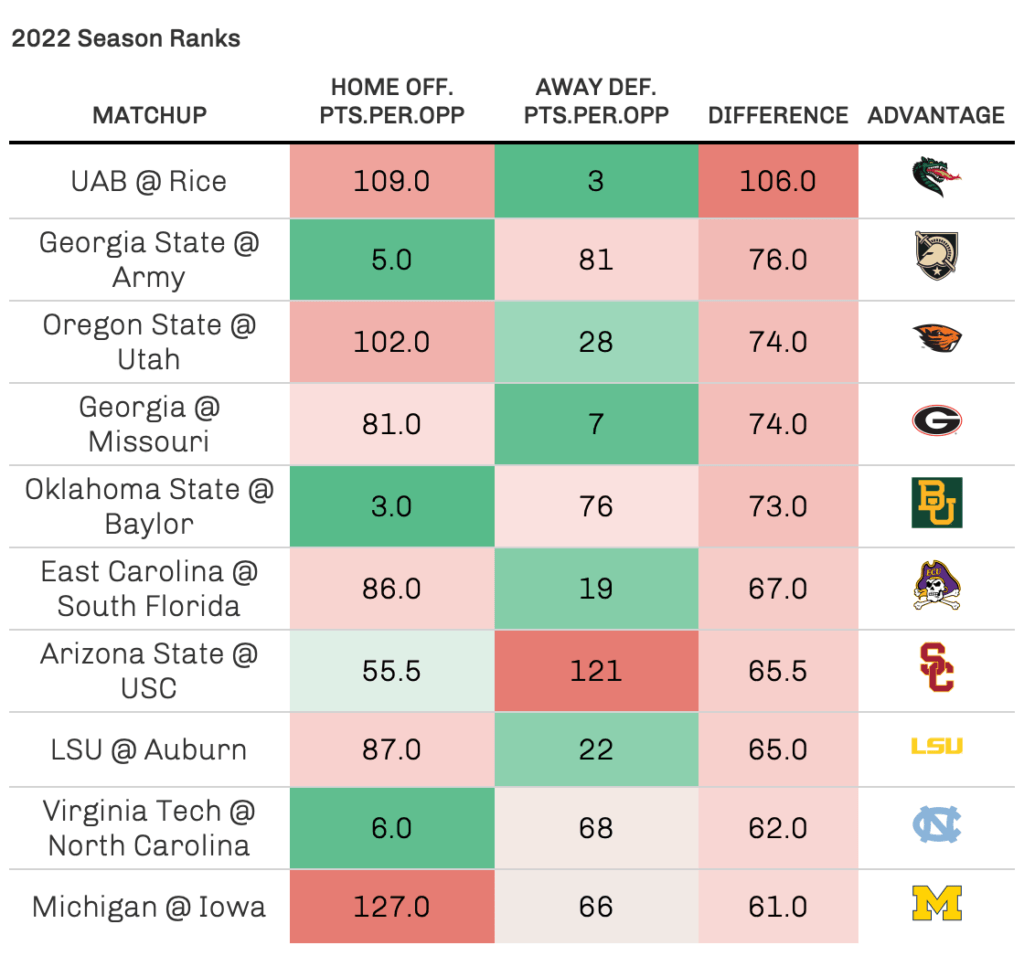 |
Top 3 Finishing Drives Mismatches (Home Offense vs. Away Defense)
- UAB's Offense vs. Rice's Defense
- Army's Offense vs. Georgia State's Defense
- Oregon State's Defense vs. Utah's Offense
Away Team Offensive Finishing Drives vs. Home Team Defensive Finishing Drives
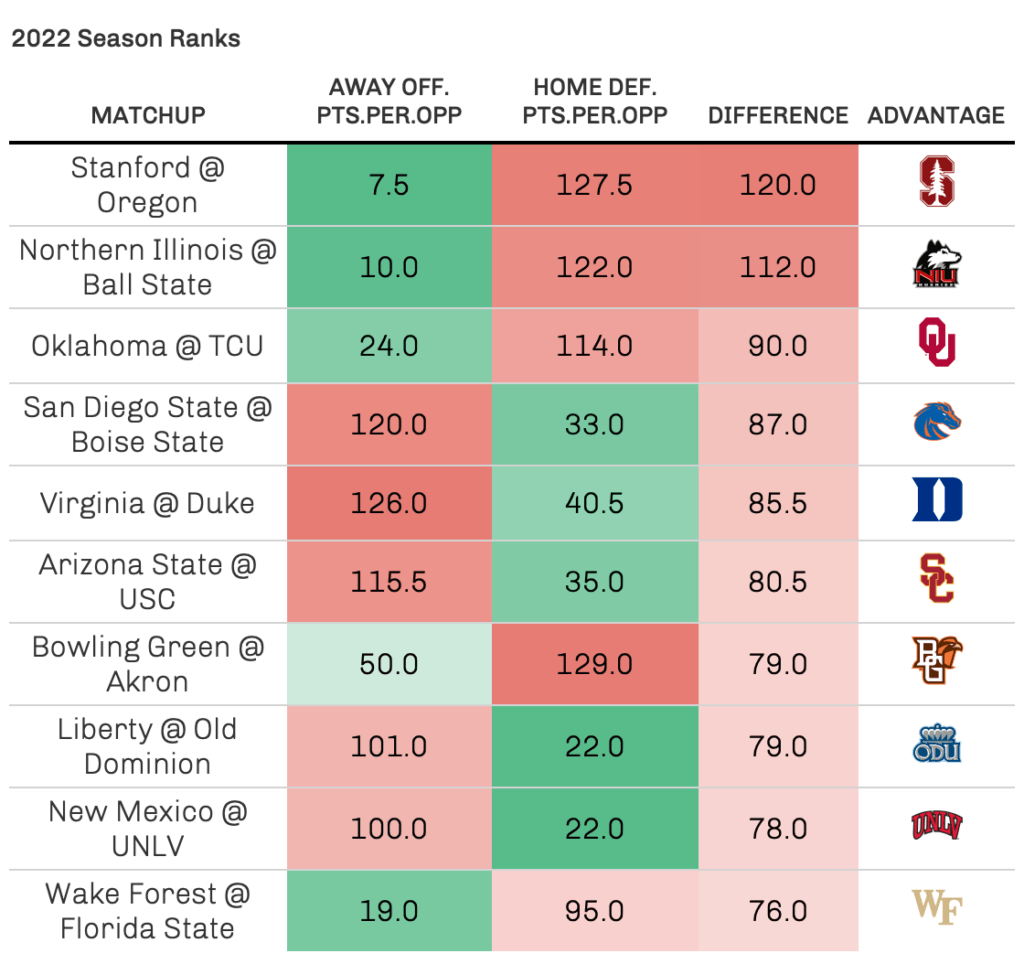 |
Top 3 Finishing Drives Mismatches (Away Offense vs. Home Defense)
- Stanford's Offense vs. Oregon's Defense
- Northern Illinois' Offense vs. Ball State's Defense
- Oklahoma's Offense vs. TCU's Defense
College Football Week 5 Betting Takeaways
So, we just saw a lot of charts, and if you've made it this far you absolutely deserve a winner. So, let's get one.
Recommendations from this column have gone 2-0-1 in previous weeks — with the push coming via an absurd overtime game (once again, will not stop complaining about this until we get an equally absurd result in our favor).
This week we're going to be looking at the Pac-12. Let's take a look at that matchup:
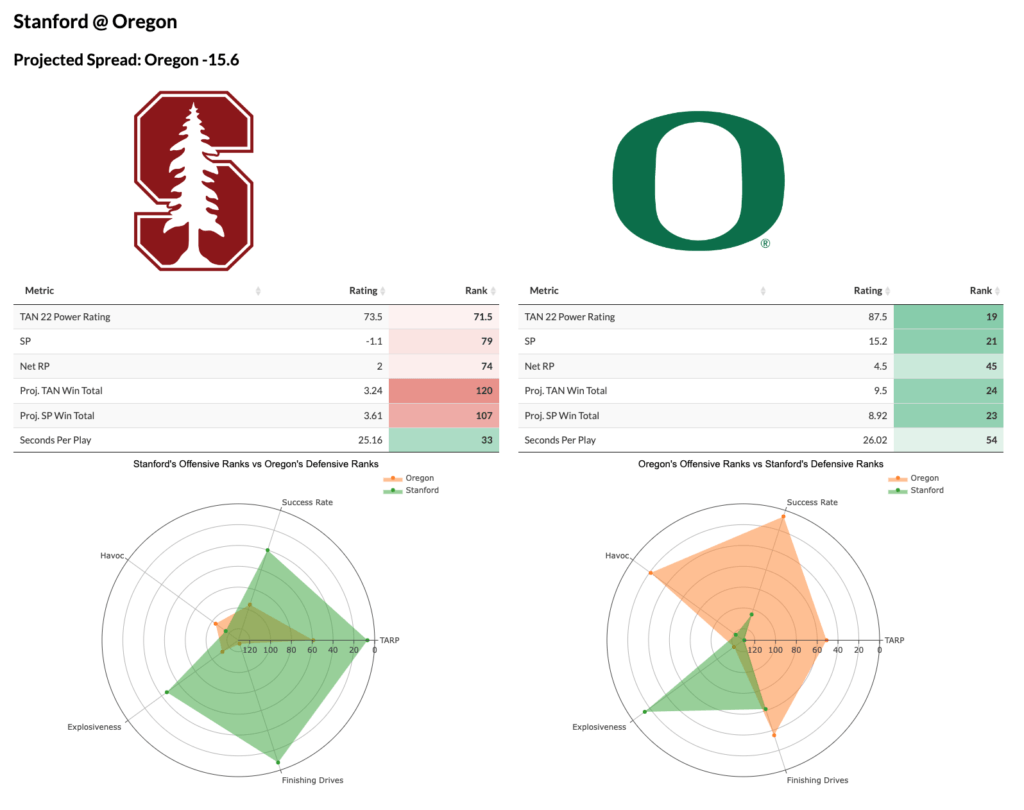 |
According to the Action Network App, this line opened at Oregon -10.5 and has moved to Oregon -17 since Monday. However, this is far too many points for a team with a disastrous defense such as Oregon.
Let's take a look at their ranks in the five factors on defense:
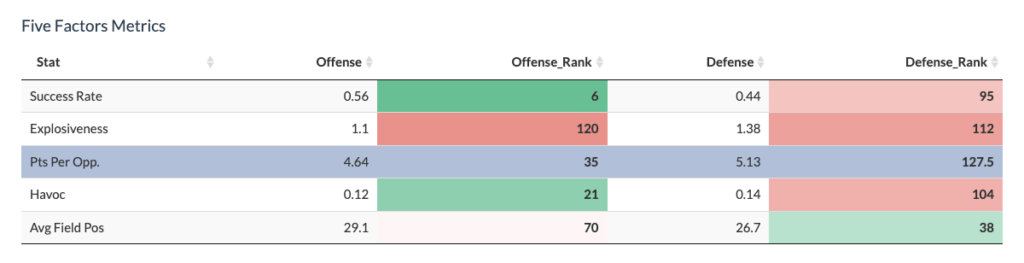 |
Yeah, not good when you're in the bottom 30 — or close to it — in four of the major metrics. We've been riding team totals this entire year, so how about one more?
Pick: Stanford Team Total Over 22.5 (-120) ⋅ Bet to Over 23.5 (-120)

![]()
![]()
![]()


