


For plenty of NFL fans, gameday starts well before kickoff. Outside stadiums, tailgates double as block parties with grills fired up; inside, fans pay steep prices to keep a beer in hand through four quarters.
Action Network surveyed 3,070 fans in August 2026 to map out drinking and eating habits around the league. The study measured pregame drinking, in-stadium alcohol consumption, and hot dog intake to evaluate overall game-day caloric impact across all 32 NFL fan bases.
Percentages refer to the share of each team’s surveyed fan base reporting a behavior.
Key findings
Carolina Panthers fans post the highest estimated game-day calorie total in the NFL at 1,133 calories per game, just ahead of Arizona Cardinals and Los Angeles Chargers fans, who are tied at 1,132.
Arizona Cardinals fans lead the NFL for average pregame drinking at 1.9 drinks before kickoff, and also post the highest heavy pregame rate in the league at 15%.
Carolina Panthers fans average the most drinks once inside the stadium at 2.7, with the highest in-game participation rate in the NFL at 78%.
Miami Dolphins fans post the highest heavy in-game drinking rate of any fan base: 25% report five or more drinks during the game, well clear of the next-highest teams.
Los Angeles Chargers fans eat the most hot dogs per game at 1.7, with 55% eating two or more.
Across the NFL, the average fan consumes 1.2 pregame drinks, 2.1 in-game drinks, and 1.2 hot dogs per game.
The average NFL fan consumes an estimated 871 calories from drinks and hot dogs per game.
Booziest NFL Fan Bases: Heavy Drinkers by Team
(% of each team’s surveyed fan base reporting 5+ drinks total on gameday)
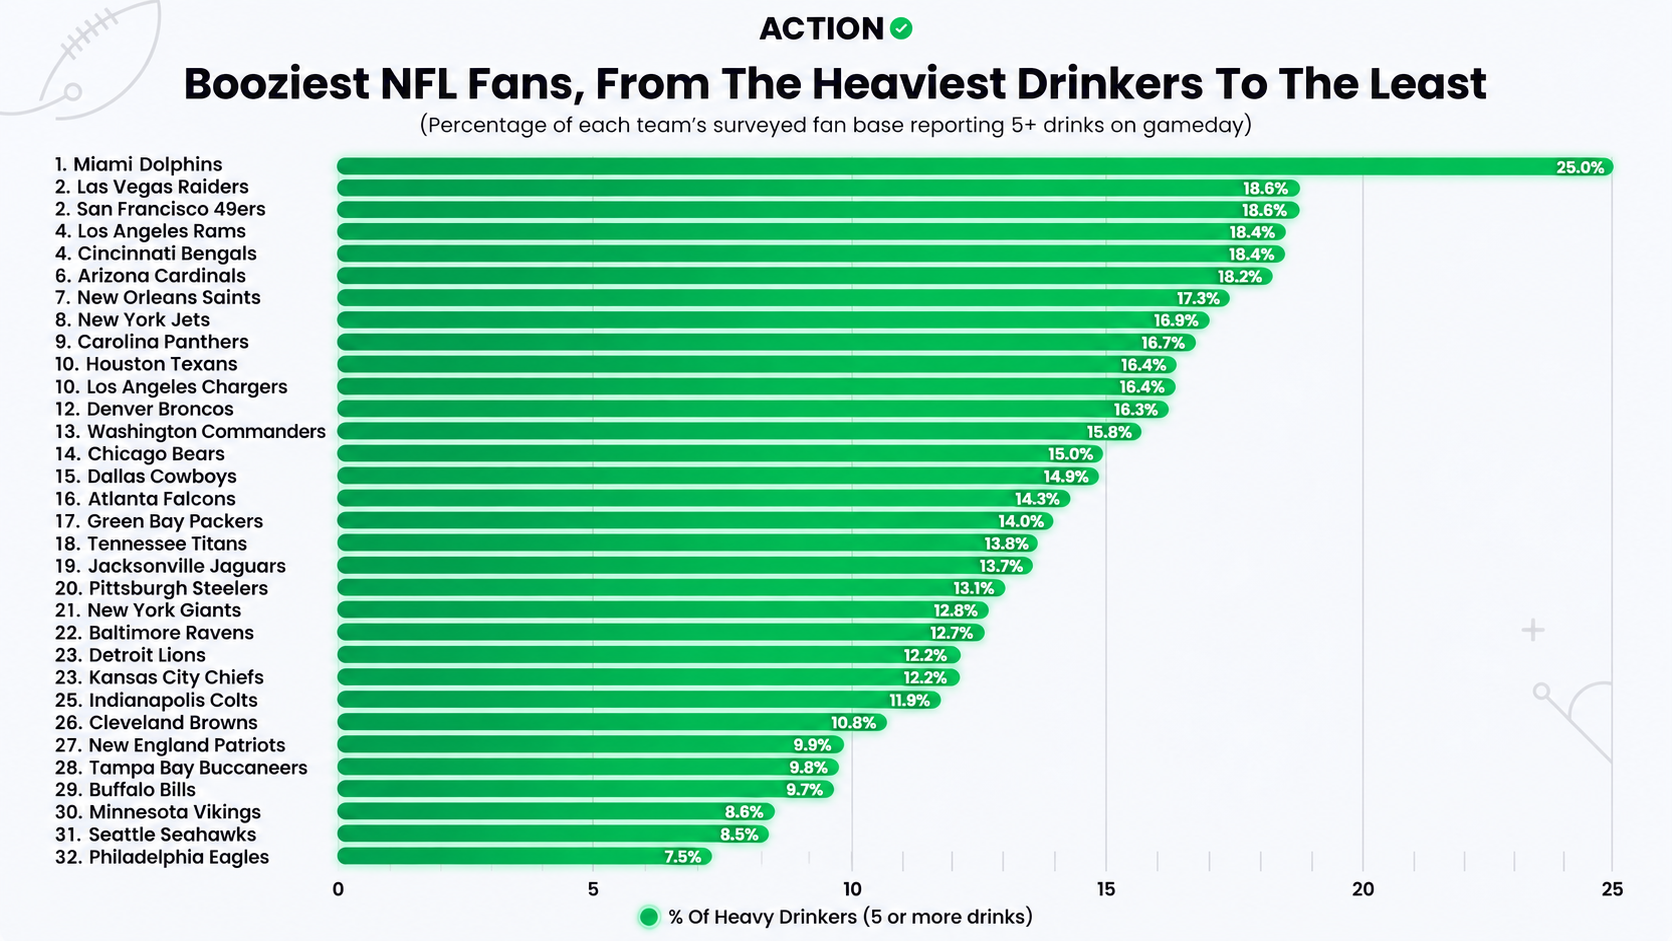
Miami Dolphins fans are the clear outlier here: 25% report five or more drinks during the game, roughly nine points clear of the next-highest teams. Las Vegas Raiders and San Francisco 49ers fans are tied for second at 18.6%, with Los Angeles Rams and Cincinnati Bengals tied just behind at 18.4%.
At the other end, Philadelphia Eagles fans post the lowest heavy in-game rate in the league at 7.5%, with Seattle Seahawks (8.5%) and Minnesota Vikings (8.6%) close behind.
How Much Do NFL Fans Eat and Drink?
NFL fans average 3.4 total alcoholic beverages and 1.2 hot dogs across a single gameday experience. That 3.4 comes from adding the precise pregame and in-game averages (1.22 + 2.14) before rounding. Consumption varies widely by fanbase.
| Metric | Pregame Drinks | In-Game Drinks | Hot Dogs Eaten |
| NFL Average | 1.2 | 2.1 | 1.2 |
| Participation Rate (1+) | 48% | 64% | 65% |
| Heavy Rate (5+ Drinks / 3+ Dogs) | 7% | 14% | 12% |
Which NFL Fan Bases Drink the Most Before Games?
Pregaming is a staple of NFL gamedays, with 48% of all surveyed fans drinking before entering the gates. Arizona Cardinals fans lead in average volume by a wide margin, while Carolina Panthers fans have the highest participation rate.
| Rank | NFL Team | Avg Pregame Drinks | % Drink 1+ Pregame | % Heavy Pregame (5+) |
| 1 | Arizona Cardinals | 1.9 | 58% | 15% |
| 2 | Carolina Panthers | 1.7 | 67% | 10% |
| 3 | Los Angeles Rams | 1.5 | 57% | 8% |
| 4 | Los Angeles Chargers | 1.5 | 55% | 9% |
| 4 | Tampa Bay Buccaneers | 1.5 | 59% | 10% |
| 6 | Houston Texans | 1.5 | 56% | 10% |
| 6 | Miami Dolphins | 1.5 | 52% | 11% |
| 8 | Buffalo Bills | 1.5 | 54% | 7% |
| 8 | Cleveland Browns | 1.5 | 53% | 7% |
| 10 | Washington Commanders | 1.4 | 49% | 11% |
| 11 | Baltimore Ravens | 1.4 | 57% | 8% |
| 12 | Las Vegas Raiders | 1.4 | 49% | 11% |
| 13 | Tennessee Titans | 1.4 | 51% | 8% |
| 14 | Denver Broncos | 1.3 | 49% | 7% |
| 14 | Dallas Cowboys | 1.3 | 52% | 7% |
| 16 | New York Jets | 1.3 | 48% | 8% |
| 16 | New Orleans Saints | 1.3 | 51% | 3% |
| 16 | Chicago Bears | 1.3 | 51% | 9% |
| 19 | San Francisco 49ers | 1.3 | 49% | 7% |
| 20 | Pittsburgh Steelers | 1.2 | 49% | 6% |
| 21 | Atlanta Falcons | 1.2 | 51% | 6% |
| 22 | Cincinnati Bengals | 1.2 | 52% | 5% |
| 23 | Indianapolis Colts | 1.1 | 40% | 8% |
| 23 | Jacksonville Jaguars | 1.1 | 51% | 4% |
| 25 | New York Giants | 1.1 | 43% | 7% |
| 26 | Green Bay Packers | 1 | 48% | 4% |
| 27 | Detroit Lions | 1 | 49% | 1% |
| 28 | Kansas City Chiefs | 0.9 | 37% | 6% |
| 28 | Philadelphia Eagles | 0.9 | 41% | 3% |
| 30 | Seattle Seahawks | 0.9 | 42% | 3% |
| 31 | New England Patriots | 0.8 | 39% | 3% |
| 32 | Minnesota Vikings | 0.7 | 35% | 3% |
Which NFL Fan Bases Drink the Most During Games?
In-stadium consumption stays high throughout all four quarters, with 64% of surveyed NFL fans drinking at least once inside the gates. Carolina Panthers fans post both the highest average and the highest participation rate; Miami Dolphins fans record the highest rate of heavy in-stadium drinking by a wide margin.
| Rank | NFL Team | Avg In-Game Drinks | % Drink 1+ | % Heavy Drinkers (5+) |
| 1 | Carolina Panthers | 2.7 | 78% | 17% |
| 2 | Houston Texans | 2.7 | 69% | 16% |
| 3 | Miami Dolphins | 2.6 | 60% | 25% |
| 3 | Los Angeles Chargers | 2.6 | 76% | 16% |
| 5 | Las Vegas Raiders | 2.5 | 70% | 19% |
| 6 | New Orleans Saints | 2.4 | 71% | 17% |
| 7 | Arizona Cardinals | 2.4 | 67% | 18% |
| 8 | Dallas Cowboys | 2.4 | 64% | 15% |
| 9 | Los Angeles Rams | 2.4 | 68% | 18% |
| 10 | Denver Broncos | 2.3 | 65% | 16% |
| 10 | Washington Commanders | 2.3 | 66% | 16% |
| 12 | Atlanta Falcons | 2.3 | 68% | 14% |
| 13 | Buffalo Bills | 2.2 | 69% | 10% |
| 13 | San Francisco 49ers | 2.2 | 61% | 19% |
| 13 | Chicago Bears | 2.2 | 65% | 15% |
| 16 | Jacksonville Jaguars | 2.2 | 67% | 14% |
| 17 | Cincinnati Bengals | 2.1 | 68% | 18% |
| 18 | Tennessee Titans | 2.1 | 57% | 14% |
| 18 | Detroit Lions | 2.1 | 70% | 12% |
| 20 | Cleveland Browns | 2.1 | 70% | 11% |
| 21 | Baltimore Ravens | 2.1 | 71% | 13% |
| 22 | Green Bay Packers | 2.1 | 66% | 14% |
| 23 | New York Giants | 2.1 | 64% | 13% |
| 23 | Seattle Seahawks | 2.1 | 62% | 9% |
| 25 | Tampa Bay Buccaneers | 2.0 | 67% | 10% |
| 26 | Pittsburgh Steelers | 2.0 | 62% | 13% |
| 27 | New York Jets | 2.0 | 62% | 17% |
| 28 | Kansas City Chiefs | 1.8 | 52% | 12% |
| 29 | Indianapolis Colts | 1.8 | 54% | 12% |
| 30 | Philadelphia Eagles | 1.8 | 62% | 8% |
| 31 | New England Patriots | 1.7 | 59% | 10% |
| 32 | Minnesota Vikings | 1.7 | 57% | 9% |
Which NFL Fan Bases Eat the Most Hot Dogs?
Hot dogs remain the primary concession food across NFL stadiums. Fans average 1.2 hot dogs per game, with 40% eating two or more.
| Rank | NFL Fan Base | Avg Hot Dogs | % Eat 2+ Hot Dogs | % Eat 3+ Hot Dogs |
| 1 | Los Angeles Chargers | 1.7 | 55% | 22% |
| 2 | Arizona Cardinals | 1.6 | 56% | 20% |
| 3 | Carolina Panthers | 1.6 | 54% | 15% |
| 3 | Tampa Bay Buccaneers | 1.6 | 45% | 25% |
| 5 | New York Jets | 1.5 | 39% | 18% |
| 6 | Los Angeles Rams | 1.5 | 47% | 18% |
| 7 | Las Vegas Raiders | 1.4 | 46% | 16% |
| 8 | Atlanta Falcons | 1.4 | 47% | 17% |
| 9 | Chicago Bears | 1.4 | 46% | 17% |
| 9 | Cleveland Browns | 1.4 | 48% | 16% |
| 11 | San Francisco 49ers | 1.4 | 47% | 11% |
| 12 | Buffalo Bills | 1.3 | 44% | 15% |
| 12 | Denver Broncos | 1.3 | 40% | 9% |
| 14 | Baltimore Ravens | 1.3 | 42% | 16% |
| 14 | Washington Commanders | 1.3 | 42% | 18% |
| 16 | Miami Dolphins | 1.3 | 43% | 15% |
| 17 | Tennessee Titans | 1.3 | 42% | 12% |
| 17 | Indianapolis Colts | 1.3 | 45% | 10% |
| 19 | New Orleans Saints | 1.3 | 43% | 9% |
| 20 | Dallas Cowboys | 1.3 | 44% | 10% |
| 21 | Houston Texans | 1.2 | 38% | 11% |
| 22 | Seattle Seahawks | 1.1 | 38% | 9% |
| 23 | Pittsburgh Steelers | 1.1 | 41% | 10% |
| 24 | New York Giants | 1.1 | 39% | 6% |
| 24 | Philadelphia Eagles | 1.1 | 34% | 13% |
| 26 | Cincinnati Bengals | 1.1 | 36% | 3% |
| 27 | Jacksonville Jaguars | 1.1 | 33% | 8% |
| 28 | Kansas City Chiefs | 1.0 | 28% | 7% |
| 29 | Detroit Lions | 1.0 | 37% | 9% |
| 30 | Green Bay Packers | 0.9 | 29% | 9% |
| 31 | New England Patriots | 0.9 | 29% | 6% |
| 32 | Minnesota Vikings | 0.8 | 25% | 3% |
Game-Day Calorie Analysis: Which Fans Consume The Most Gameday Calories
| Rank | NFL Fan Base | Est. Calories / Game | Season Calories (8 Home Games) | Hypothetical lbs Gained |
| 1 | Carolina Panthers | 1,133 | 9,062 | 2.6 |
| 2 | Arizona Cardinals | 1,132 | 9,055 | 2.6 |
| 2 | Los Angeles Chargers | 1,132 | 9,055 | 2.6 |
| 4 | Los Angeles Rams | 1,022 | 8,179 | 2.3 |
| 5 | Miami Dolphins | 1,011 | 8,085 | 2.3 |
| 6 | Las Vegas Raiders | 996 | 7,971 | 2.3 |
| 7 | Tampa Bay Buccaneers | 994 | 7,953 | 2.3 |
| 8 | Houston Texans | 974 | 7,790 | 2.2 |
| 9 | Washington Commanders | 953 | 7,626 | 2.2 |
| 10 | Buffalo Bills | 950 | 7,600 | 2.2 |
| 11 | Cleveland Browns | 947 | 7,576 | 2.2 |
| 12 | New York Jets | 942 | 7,538 | 2.2 |
| 13 | Denver Broncos | 941 | 7,526 | 2.2 |
| 13 | Chicago Bears | 941 | 7,525 | 2.2 |
| 15 | New Orleans Saints | 936 | 7,488 | 2.1 |
| 16 | Atlanta Falcons | 935 | 7,481 | 2.1 |
| 17 | San Francisco 49ers | 932 | 7,460 | 2.1 |
| 17 | Dallas Cowboys | 932 | 7,459 | 2.1 |
| 19 | Baltimore Ravens | 921 | 7,367 | 2.1 |
| 20 | Tennessee Titans | 909 | 7,274 | 2.1 |
| 21 | Indianapolis Colts | 829 | 6,629 | 1.9 |
| 22 | Pittsburgh Steelers | 827 | 6,620 | 1.9 |
| 23 | Cincinnati Bengals | 821 | 6,566 | 1.9 |
| 24 | Jacksonville Jaguars | 812 | 6,494 | 1.9 |
| 25 | New York Giants | 808 | 6,462 | 1.8 |
| 26 | Seattle Seahawks | 785 | 6,277 | 1.8 |
| 27 | Detroit Lions | 761 | 6,088 | 1.7 |
| 28 | Green Bay Packers | 750 | 6,000 | 1.7 |
| 29 | Philadelphia Eagles | 740 | 5,920 | 1.7 |
| 30 | Kansas City Chiefs | 711 | 5,689 | 1.6 |
| 31 | New England Patriots | 657 | 5,252 | 1.5 |
| 32 | Minnesota Vikings | 597 | 4,774 | 1.4 |
| — | NFL Average Fan | 871 | 6,965 | 2.0 |
To place food and beverage metrics on a unified scale, an estimated calorie model was applied:
Alcoholic Drink: 150 calories (standard 12 oz beer equivalent)
Hot Dog & Bun: 300 calories (standard frank and bun, excluding additional toppings)
The season-long figure projects the total across an 8-game regular season home schedule.


