Table of Contents
Stuff Rate Definition
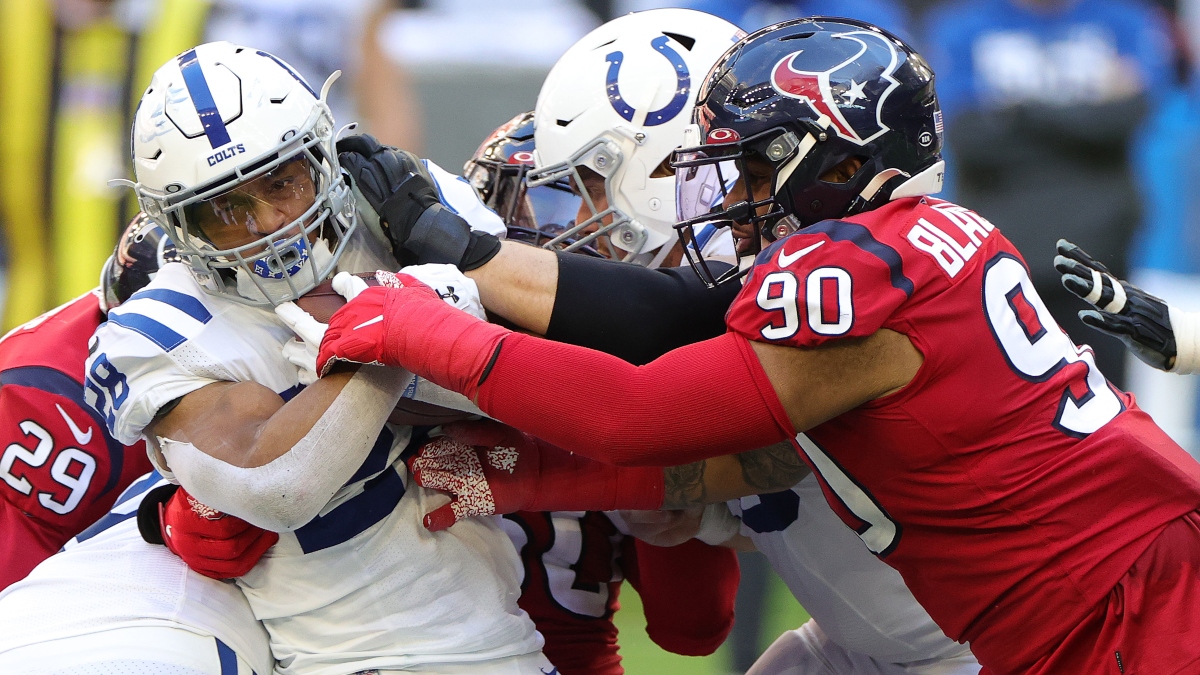
Stuff rate is the consistency at which a defense tackles the opposing player at or behind the line of scrimmage. It can be effective at looking at how well a defensive line is playing.
When evaluating the stuff rate of a defense, it can be useful to look at the opportunity rate of an offense. Opportunity rate is the consistency at which a running back gains five yards on a carry. This is typically reflective of offensive line play, as the metric looks at the first five yards of a carry, rather than what happens after. For now, we'll focus on stuff rate.
Examples and Statistics
Stuff rate statistics can be found in both college football and NFL forms, but I'll use the latter as an example.
| Number of Plays | Plays Stopped At/Behind the Line of Scrimmage | Stuff Rate |
|---|---|---|
| 50 | 12 | 24% |
| 125 | 20 | 16% |
| 75 | 10 | 13.3% |
| 150 | 15 | 10% |
Simple enough, right? Below is a list of the NFL leaders in stuff rate from 2020, with the Eagles leading the pack.
| Team | Stuff Rate |
|---|---|
| Philadelphia Eagles | 23.9% |
| Tampa Bay Buccaneers | 22.3% |
| Atlanta Falcons | 21.9% |
| Pittsburgh Steelers | 21.7% |
| Washington Football Team | 21.5% |
| New Orleans Saints | 20.6% |
| San Francisco 49ers | 20.6% |
| New York Jets | 20.3% |
| Arizona Cardinals | 19.5% |
| Seattle Seahawks | 19.3% |
On the other side, here are the five worst defenses in terms of stuff rate in 2020.
| Team | Stuff Rate |
|---|---|
| New England Patriots | 10.1% |
| Minnesota Vikings | 10.3% |
| Kansas City Chiefs | 11.2% |
| Detroit Lions | 12.2% |
| Dallas Cowboys | 12.7% |
Can Stuff Rate Help Me With Betting?
Yes, but you're going to have to get a little crafty with this one. On its own, stuff rate likely can't provide you with a good measure of how a team will fair against the spread or simply against another team. It can, however, help you identify when a team may have an advantage at the line, especially when placed in context with the opposing team's opportunity rate.
This is a statistic that may give hints on how a team will fair in a certain circumstance, such as against the run, in a given matchup. While this may assist you in making judgements on a matchup, it can also theoretically help with something such as a rushing yards or touchdowns prop bet. Below are the stuff rate leaders, the worst teams in stuff rate and their rushing yards/touchdowns conceded per game in 2020.
As you can see, this is not an end all, be all metric to identify rushing yard projections, but it can give you an idea of possible edges when looking at rushing yard props. Additionally, you could consider this stat when making a decision on a daily fantasy selection. These are just some example of how the metric can be used, and it's up to you to decide how you can incorporate it.


