


In the aftermath of the 2017 season, which saw a record 6,105 home runs, Major League Baseball purchased Rawlings to gain greater control over the manufacturing process and the quality of its official baseballs.
This acquisition began a nearly decade-long period of constant speculation about whether MLB was changing the baseballs used on the field (and how frequently it was doing so).
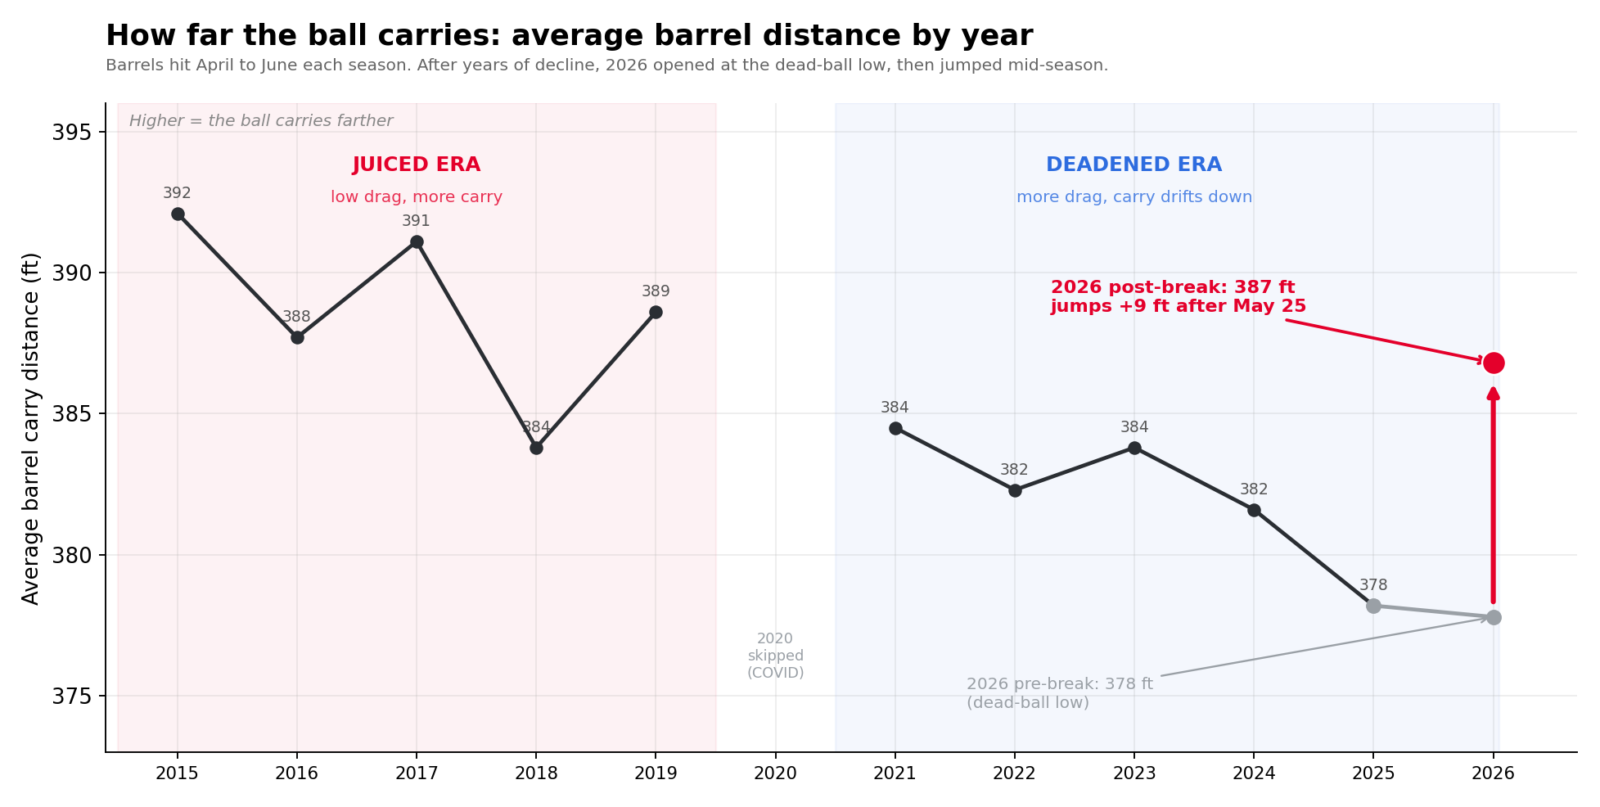
From 2015-19, barrels (the batted balls likeliest to turn into homers) traveled between 388 and 392 feet on average.
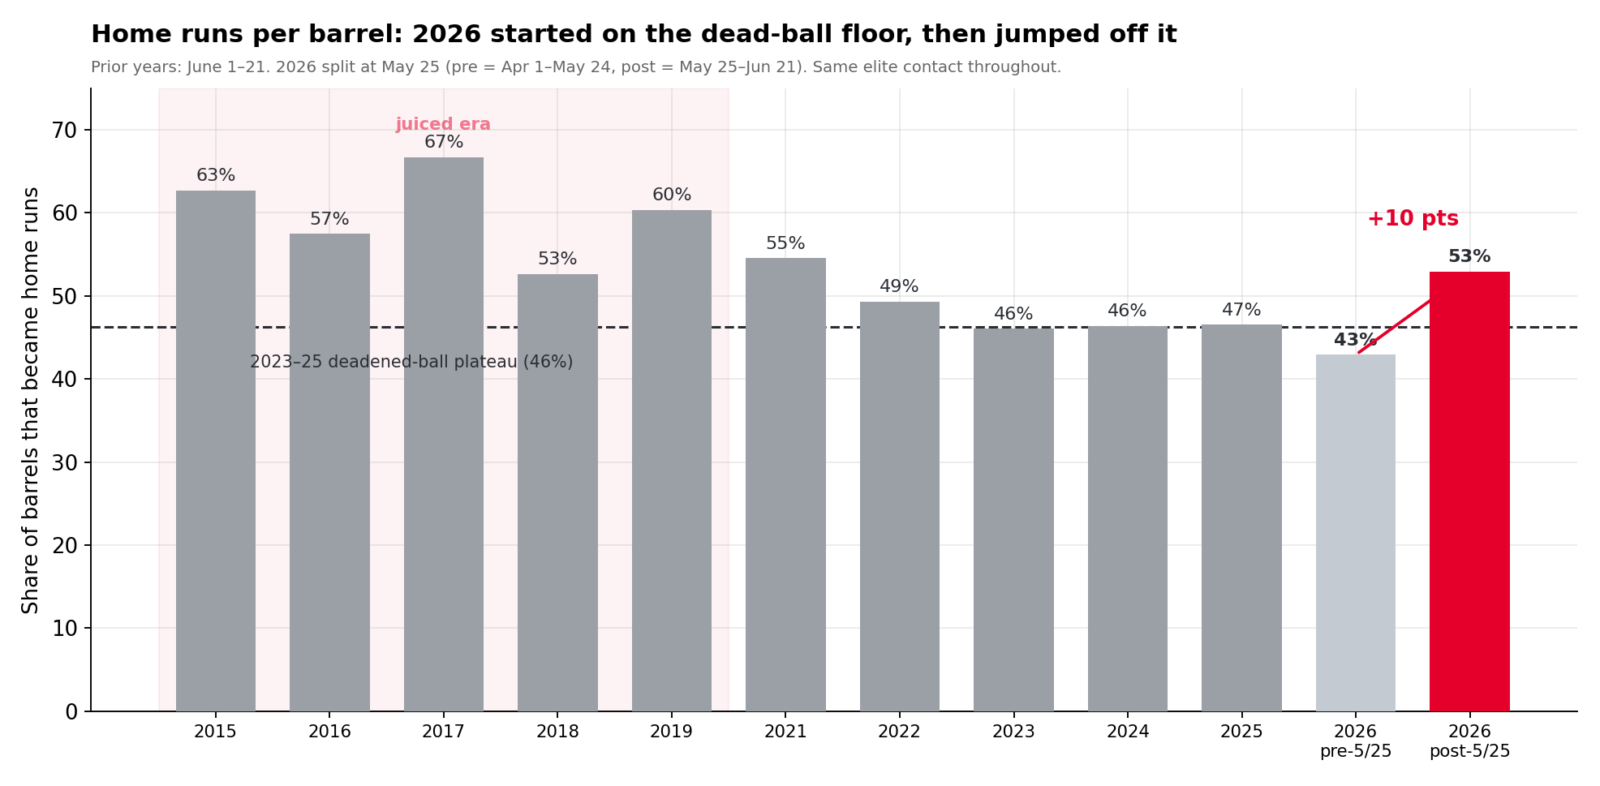
However, after the pandemic-shortened 2020 campaign, MLB publicly moved to deaden the baseball and installed humidors in all 30 parks. Average barrel distance trended downward in subsequent seasons and eventually decreased by nearly 10 feet relative to 2019 (378 feet in 2025, the lowest in the Statcast dataset).
Through late May 2026, barrels were carrying an average of 377.8 feet, in line with 2025.
But on Memorial Day of this year (May 25), the baseballs started carrying like they hadn't in years.
Since that point, barrels have averaged 386.8 feet of carry, roughly a nine-foot jump that erased the entire 2021-25 deadening and pushed barrel carry back toward pre-COVID levels.
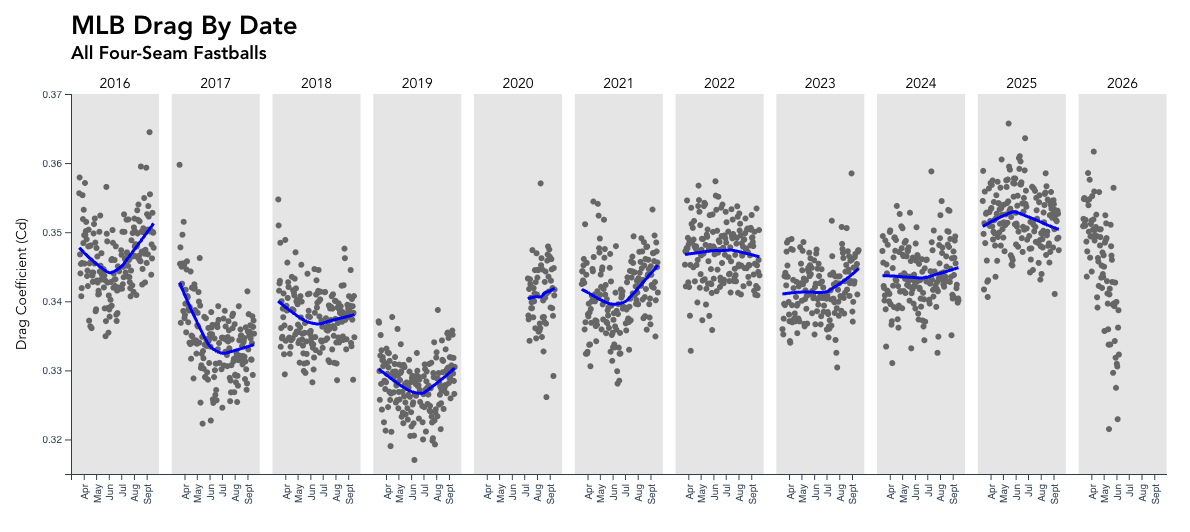
The increased carry is corroborated by an independent drop in the ball's drag coefficient (which is weather and altitude-adjusted) at the same point in time.
It's Drag: Not a Bouncier Baseball
Aside from manipulating bats, there are two ways to make a ball fly farther: make it come off the bat faster (a livelier core with a higher COR), or make it hold its speed in the air (less drag).
A decrease in the drag coefficient (which accounts for temperature and altitude) of 0.01 will increase the distance of a batted ball with an exit velocity of 100 MPH by approximately five feet (and an increase of 0.01 will decrease batted ball distance by five feet).
In 2025, the drag coefficient ranged between .366 and .341, a difference of .025 or roughly 12.5 feet of variance on a batted ball.
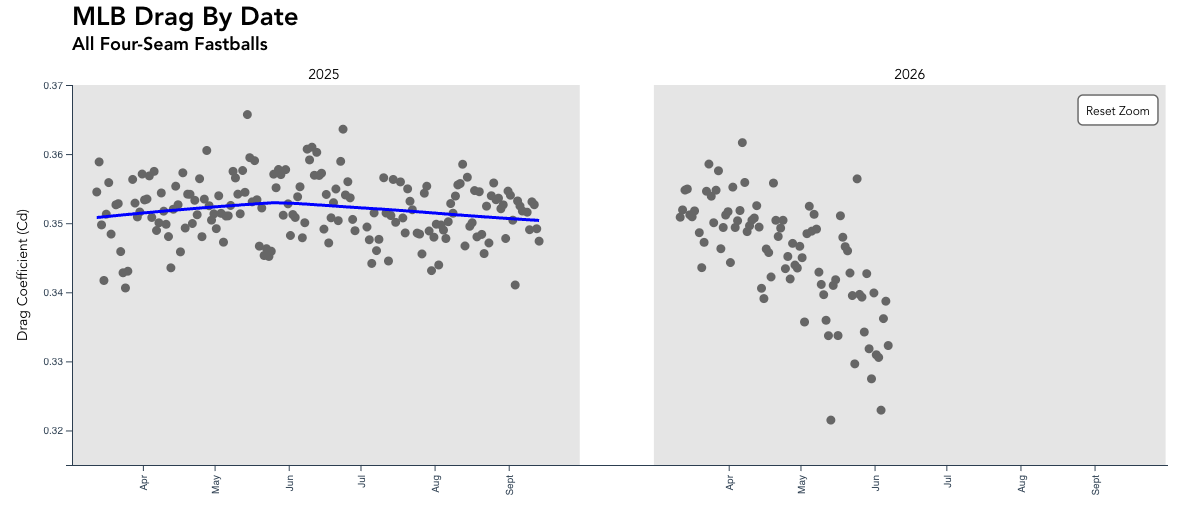
The range thus far in 2026 is .362 to .321, a difference of .041 or roughly 20.5 feet on a batted ball, and it's easily the largest in-season differential on record.
The highest drag rate occurred on April 18, and the lowest on May 28, with a noticeable downward trend in drag data as the 2026 season has progressed.
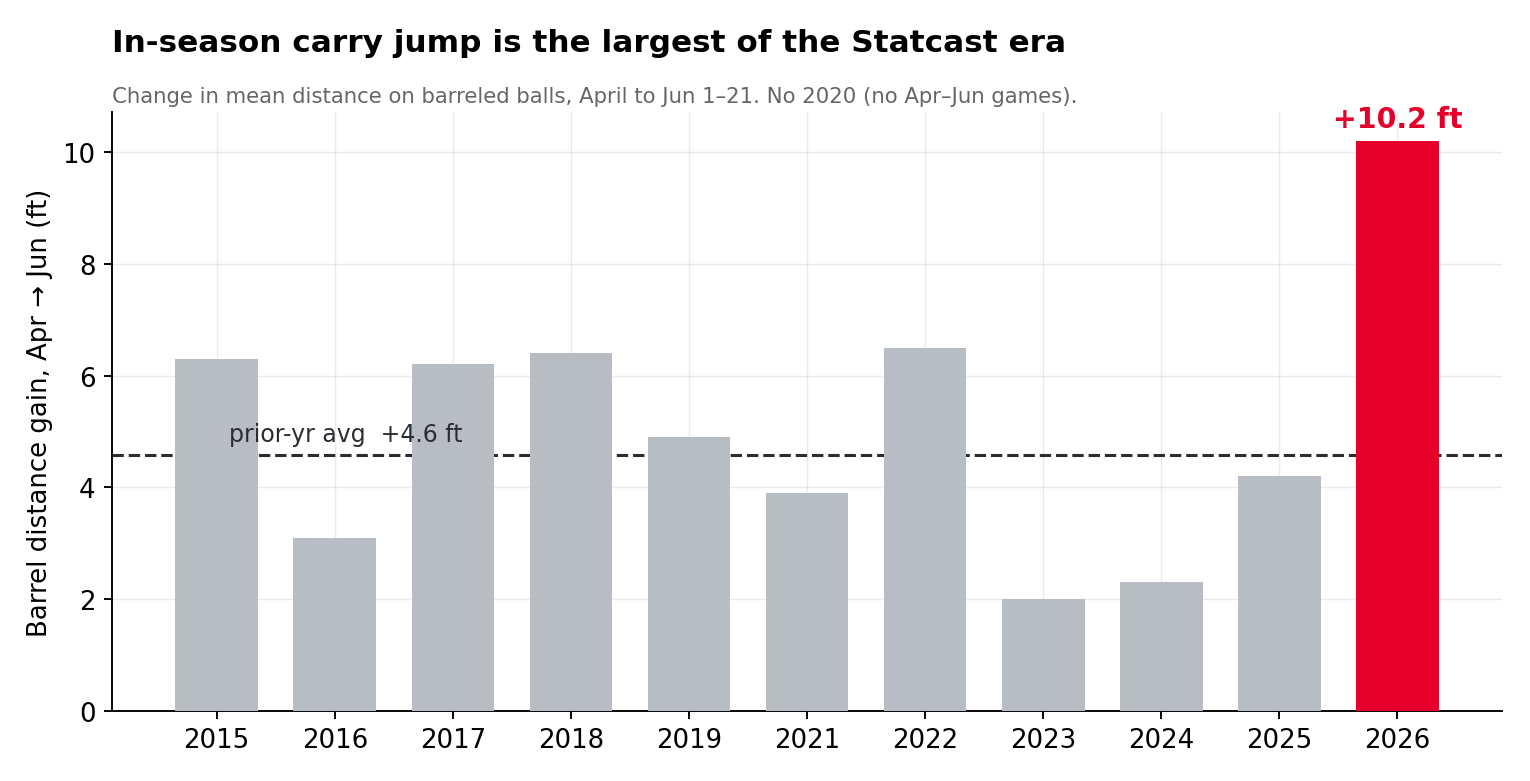
In-Season Carry Jump: Highest in Statcast Era
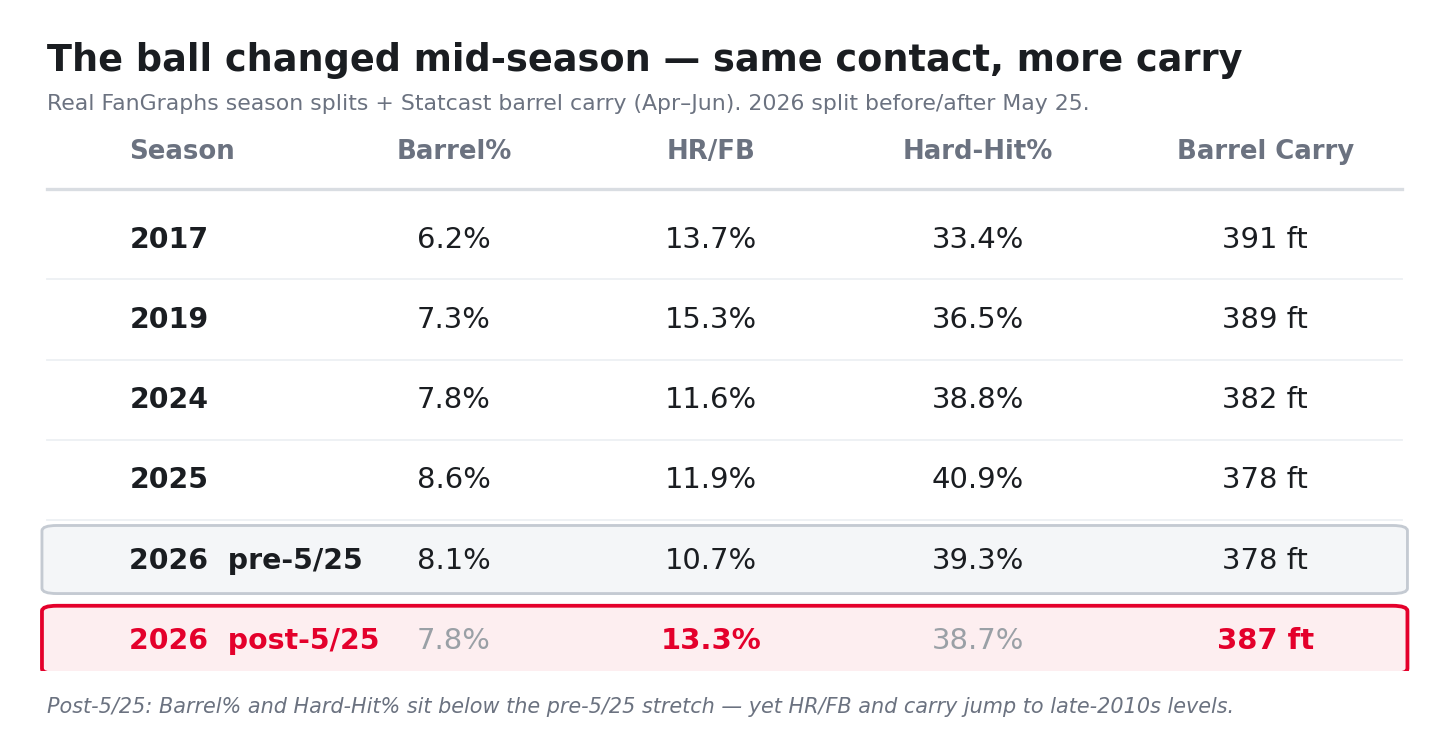
The overall 2026 April-to-June dataset looks very similar to the 2024 and 2025 seasons, but with a significant jump in home-run-to-fly-ball rates and average barrel carry since May 25, aligning more closely with the juiced-ball seasons in 2017 and 2019.
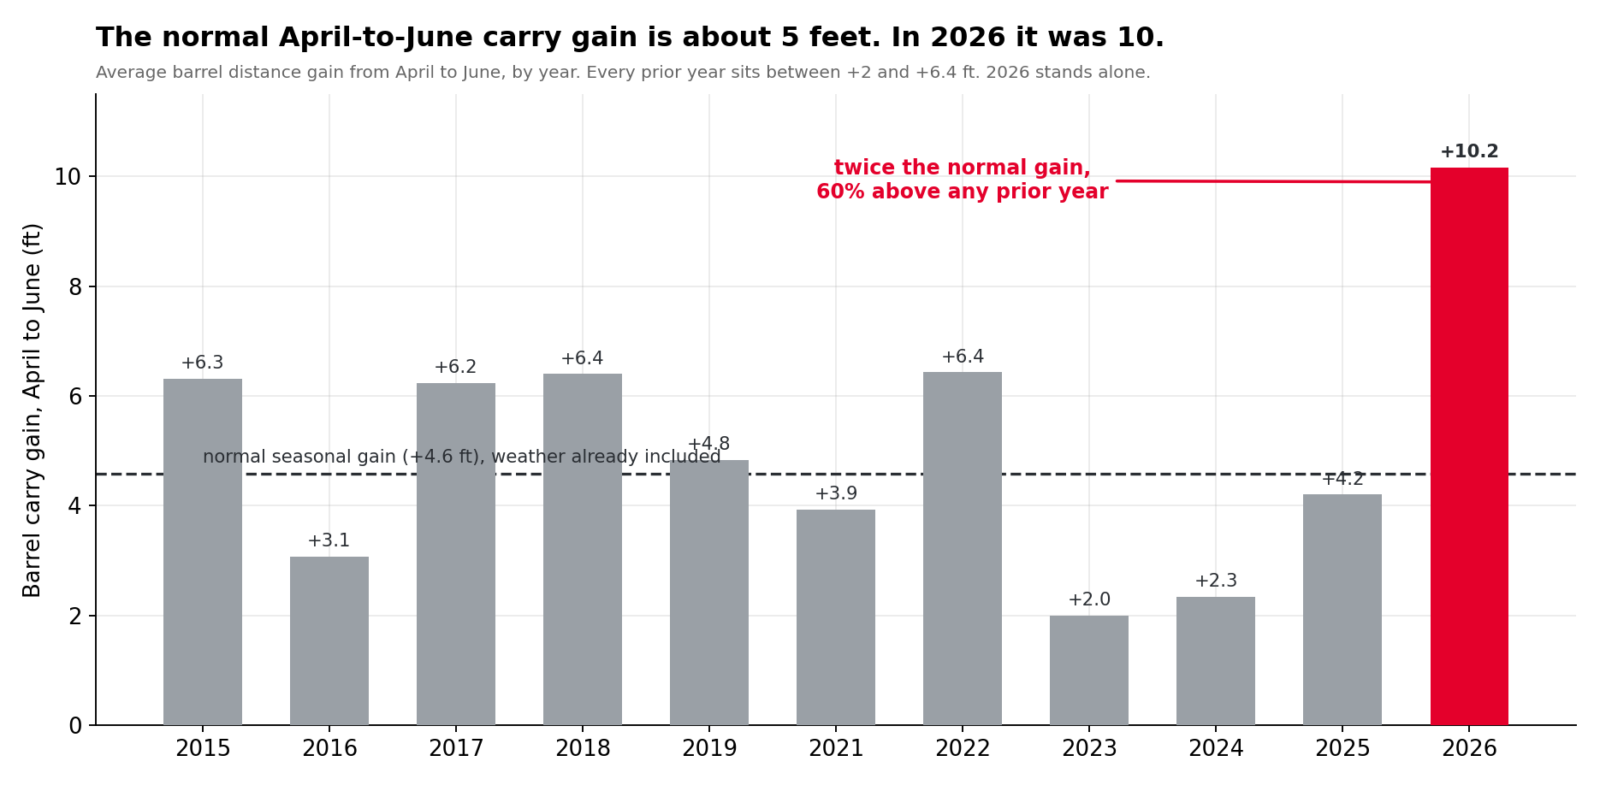
Overall, average barrel distance has seen the largest April-to-June jump (+10.2 feet) in the Statcast era (average: +4.6 feet; previous high: +6.4 feet).
As a result, home runs per barrel in June have increased substantially relative to prior seasons, sitting at the highest mark since 2019.

Batted Ball Data: Stable
Since May 25, average exit velocity has remained stable (both league-wide and on barrels specifically).
Balls aren't leaving the bat any hotter. What changed is how far they carry at the same exit velocity and launch angle — the signature of a lower-drag ball, with almost certainly lower seams, rather than one with a juiced core.
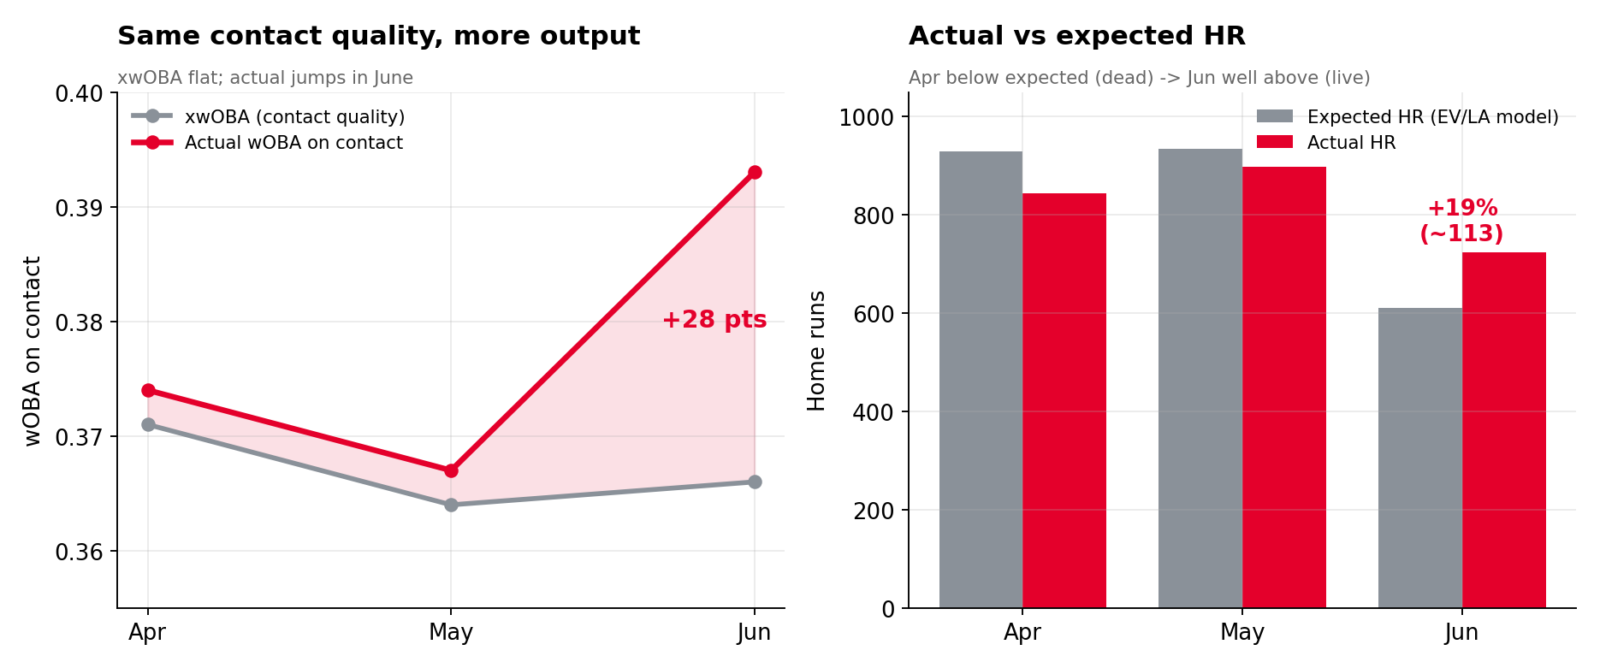
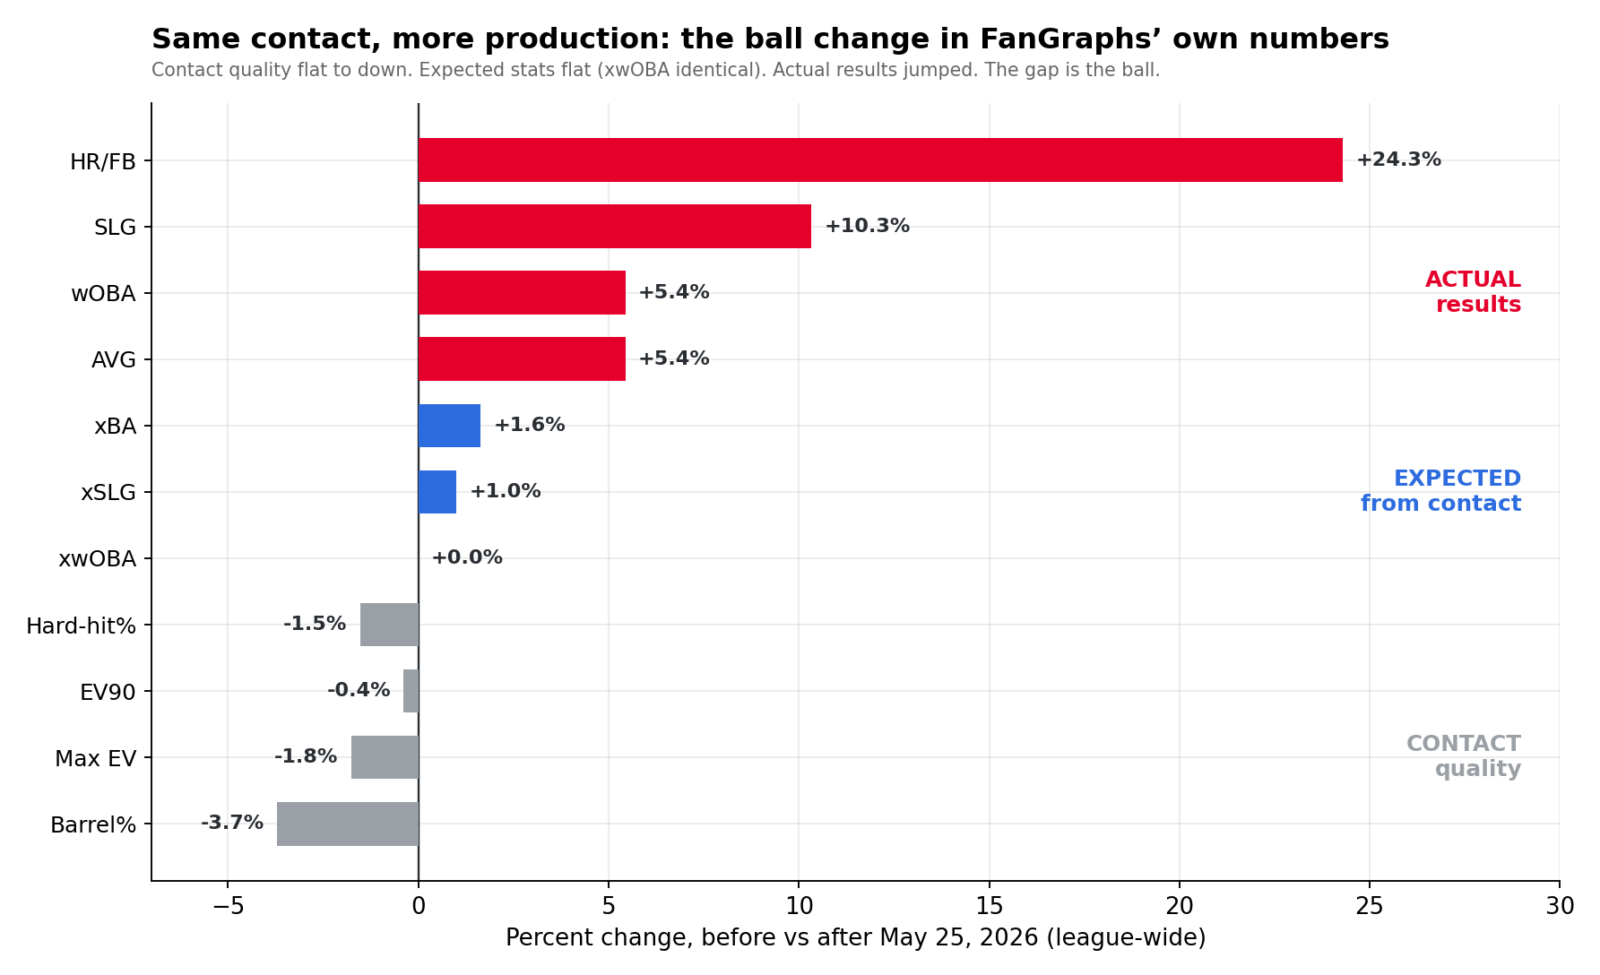
Expected stats, which are based solely on exit velocity and launch angle, stayed flat in June, but actual results jumped above them.
League-wide wOBA ran 28 points above expectation in June, even though the overall barrel rate actually fell over the same stretch (from 8.1% to 7.8%), ruling out a sudden outbreak of better swings.
Contact quality hasn't improved since the break, either. If anything, it dipped, as league-wide average exit velocity fell from 89.0 to 88.8 MPH, max exit velocity from 119.0 to 116.9 MPH, barrel rate from 8.1% to 7.8% and hard-hit rate from 39.3% to 38.7%.
Meanwhile, the expected stats built entirely from that contact data barely moved. Expected wOBA (xwOBA) was identical on both sides of the break, .319 and .319.
But actual production jumped — batting average from .239 to .252, slugging from .387 to .427, wOBA from .312 to .329 and HR/FB rate from 10.7% to 13.3%.
Before May 25, hitters were producing seven points of wOBA below what their contact predicted; after, 10 points above.
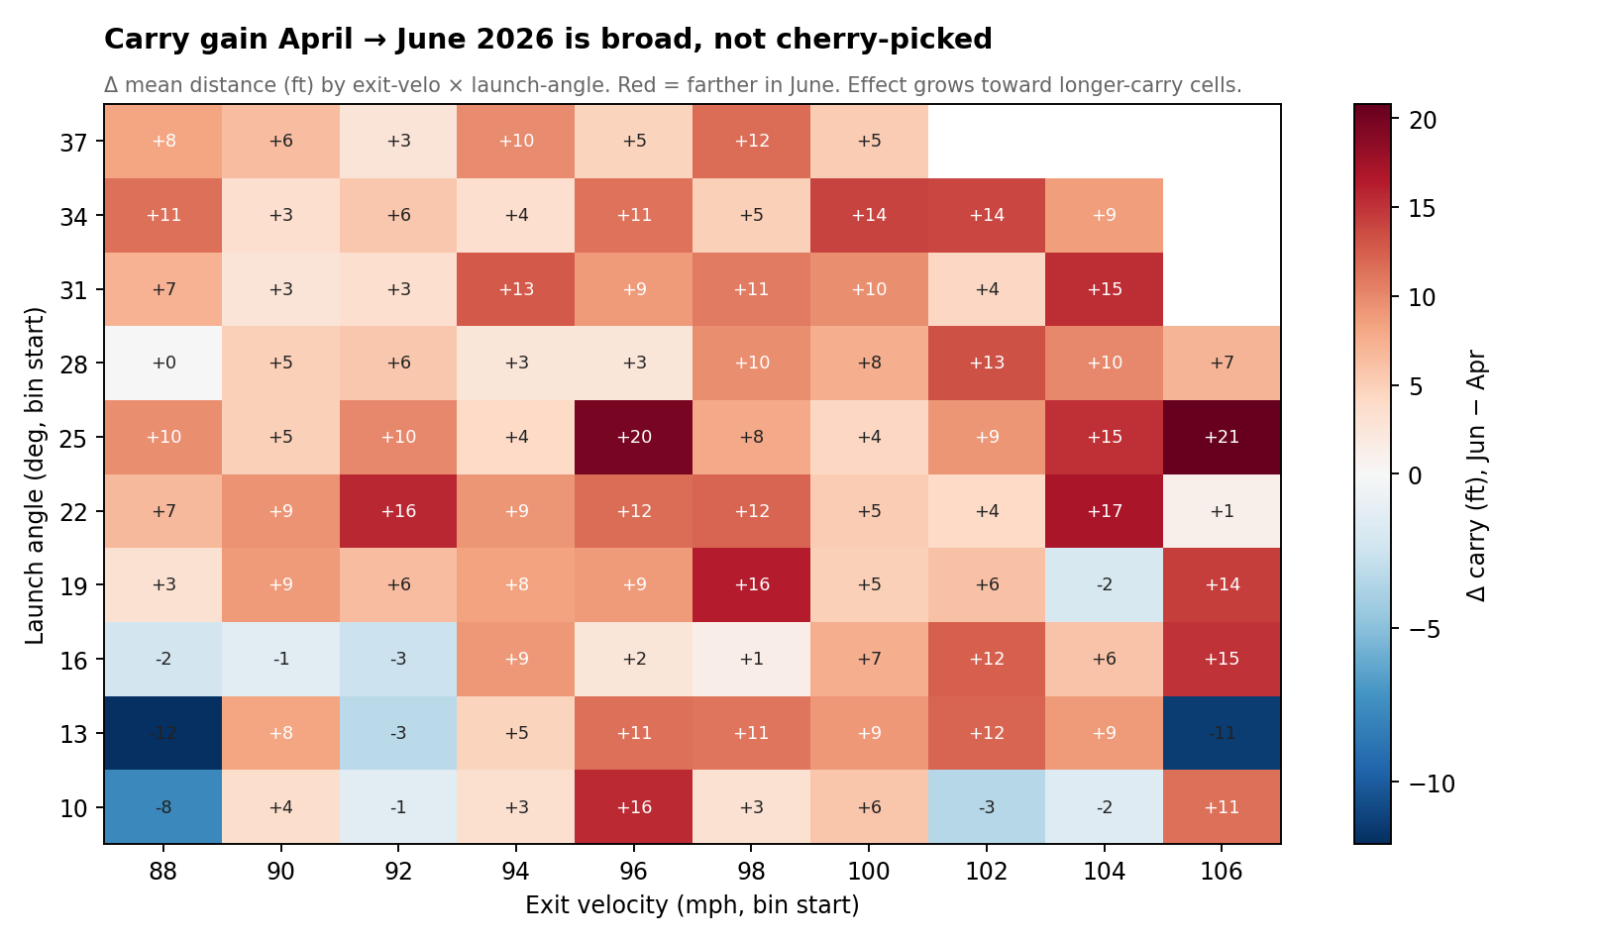
It isn't a quirk of one launch-angle bucket. Holding contact quality fixed across the entire batted-ball grid, carry rose in 88% of exit-velocity by launch-angle cells, concentrated in the 22-to-34-degree window where fly balls more frequently turn into home runs.
Drag is a physical property, so a nine-foot step-up on identical contact (with drag variance tightening, not widening, over the same stretch) means the physical balls almost certainly have changed.
Whether it was an intentional change or a manufacturing issue (a subtle but impactful change in seam height) may never be formally acknowledged.
Still, these outlier data points are undeniable evidence of a change in how the baseballs are moving through the air.
Impacts We Can Rule Out
Here are some of the potential counterarguments to the carry impact beyond drag, and why I think each fails to hold water:
- Bouncier/Juiced Ball (COR): Exit velocity is flat, and nothing is leaving the bat hotter than it did previously.
- Change in Hitter Approach/Optimized Swings: Expected Stats (Launch Angle and Exit Velocity) are flat.
- More Power on Rosters: Barrel rates fell.
- Outlier Park Data: The June games in Las Vegas added 0.5 inches to the leaguewide carry data, and while it's impressive that it skewed the sample that much in just six games, it wasn't enough to materially change the outlier sample, which has still increased by nine feet.
- Pitcher Grip: Walks, hit by pitches, whiff rates and spin rates are flat, and there's nothing to suggest that a potentially lowered seam height has impacted the pitchers.
The weather is the biggest remaining variable. While it clearly impacts ball flight, we can quantify its expected effect using prior-year baselines, which account for only up to 50% of that 10-foot jump.
Warmer Weather, Dome Stadiums and Outlier Datapoints
Seasonal gains for run scoring and barrel distance are completely normal as the weather warms from April to the summer months.
Average barrel carry typically increases by 4.6 feet over that span, but that increase has never previously exceeded 6.4 feet in a single season during the Statcast era.
In 2026, average barrel distance has increased by 10.2 feet from April to June, roughly double the average and 60% above the highest prior-year level on record.
But more importantly, that 10-foot jump didn't occur gradually as temperatures improved. Instead, it happened very suddenly on Memorial Day and has held steady since.
Barrel carry averaged 377.9 feet before Memorial Day and 387.3 feet after (+9.4 feet).
Plus, the weather is already baked into every one of those prior-season numbers. So, if you still think that a sudden surge of good weather explains the record-setting in-season gains in barrel distance, you'd have to prove that the weather in 2026 showed a more drastic increase relative to prior years, and that's not the case.
Moreover, you'd also need the average temperature to have increased by about 28 degrees from May 24 to the week of May 25 to justify the jump in carry as weather impact alone.
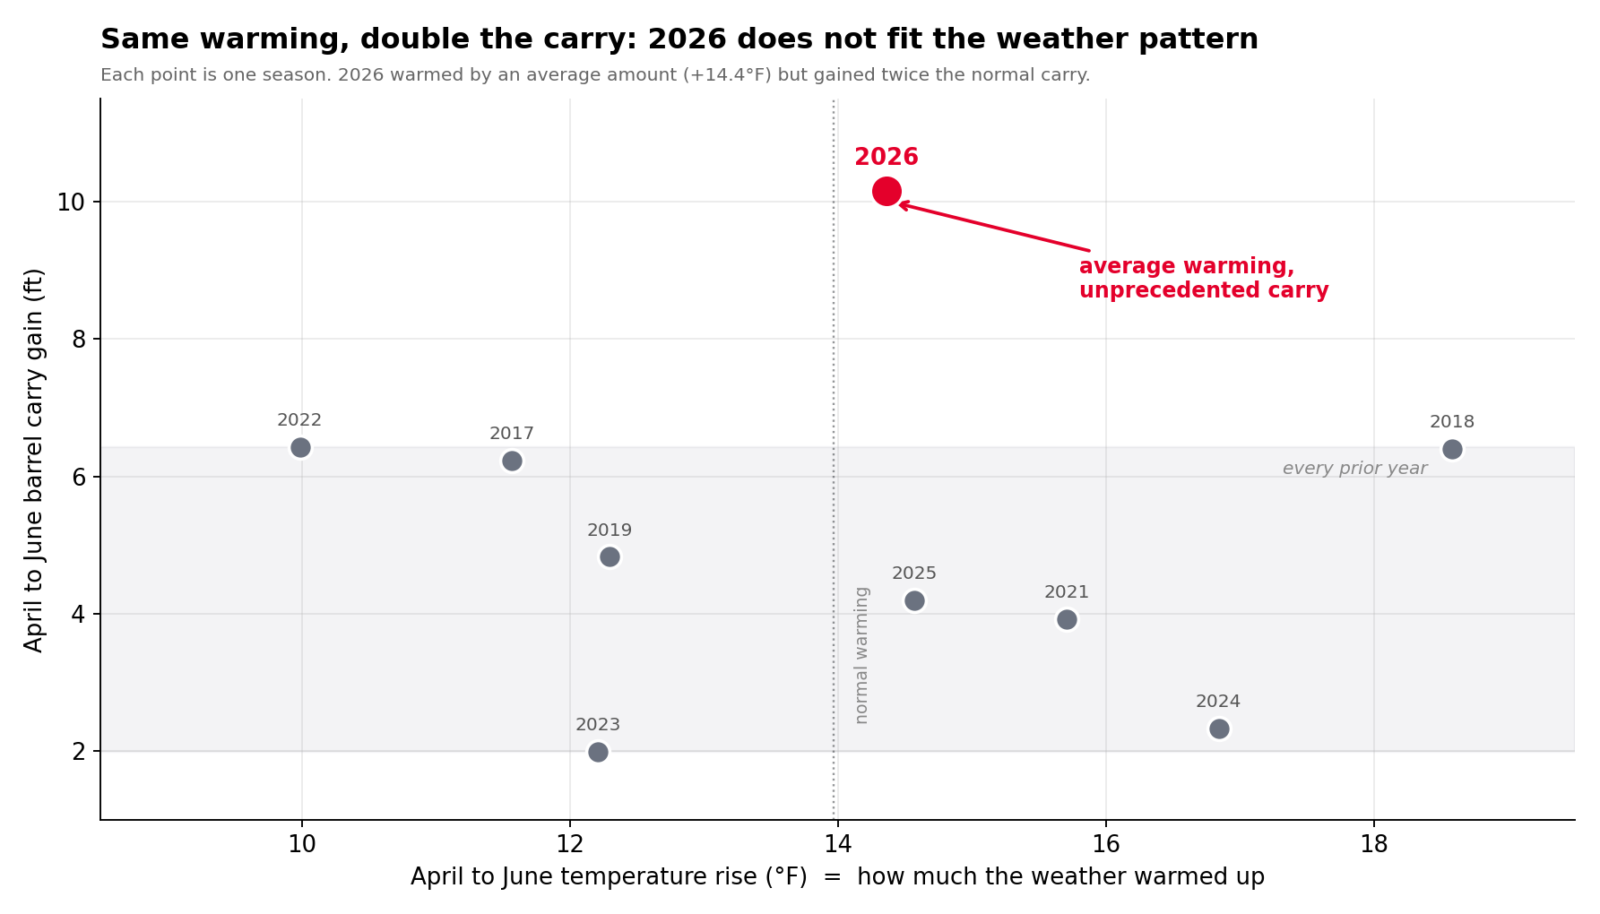
Warming in 2026 is essentially average compared to a 10-year sample. From April to June 2026, average game-time temperatures rose by 14.4 degrees, almost exactly the prior decade's average of 14.0 degrees.
The hottest warm-up in the data (2018, +18.6 degrees from April to June) produced additional carry of +6.4 feet, still well below 2026 (+10.2).
At best, you can credit half of the increased carry to the weather.
You can anticipate about an extra 0.3 feet of carry per increase of one degree Fahrenheit, so a 14-degree increase essentially aligns with the typical +4.6-foot gain in carry from April to June.
To explain the additional 4.5 feet of carry, average temperatures would have had to increase by about 30 degrees from April to June, rather than by 15 degrees.
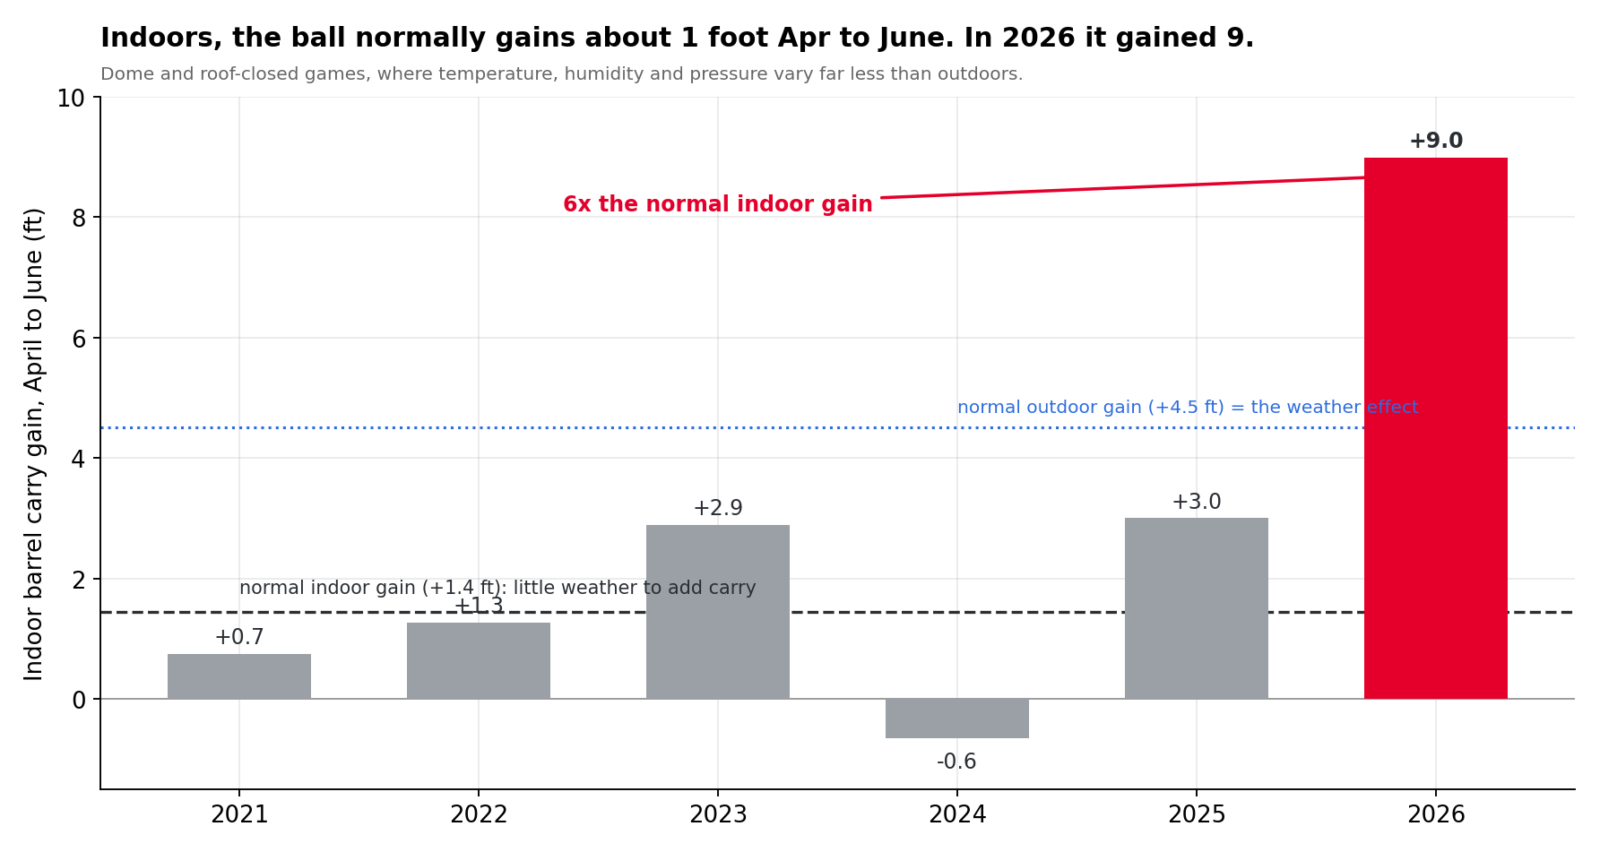
In dome and roof-closed games, where there's lessened weather impact, average barrel carry typically improves minimally from April to June — about 1.4 feet and never (before 2026) more than three feet.
In 2026, indoor parks gained 9.0 feet of average carry since late May.
And again, the 2026 in-season weather gains have been near-average based on a 10-year sample.
Directional differences in humidity and air pressure for indoor parks would need to be so drastically different from 2026 compared to prior years as to create a stark differential (six feet or more of added carry relative to prior highs) that it would be a bigger anomaly than a ball change itself.
Occam's razor says the simple explanation is that the ball changed, intentionally or not.

Run Scoring Environment
Scoring has increased tremendously as a result.
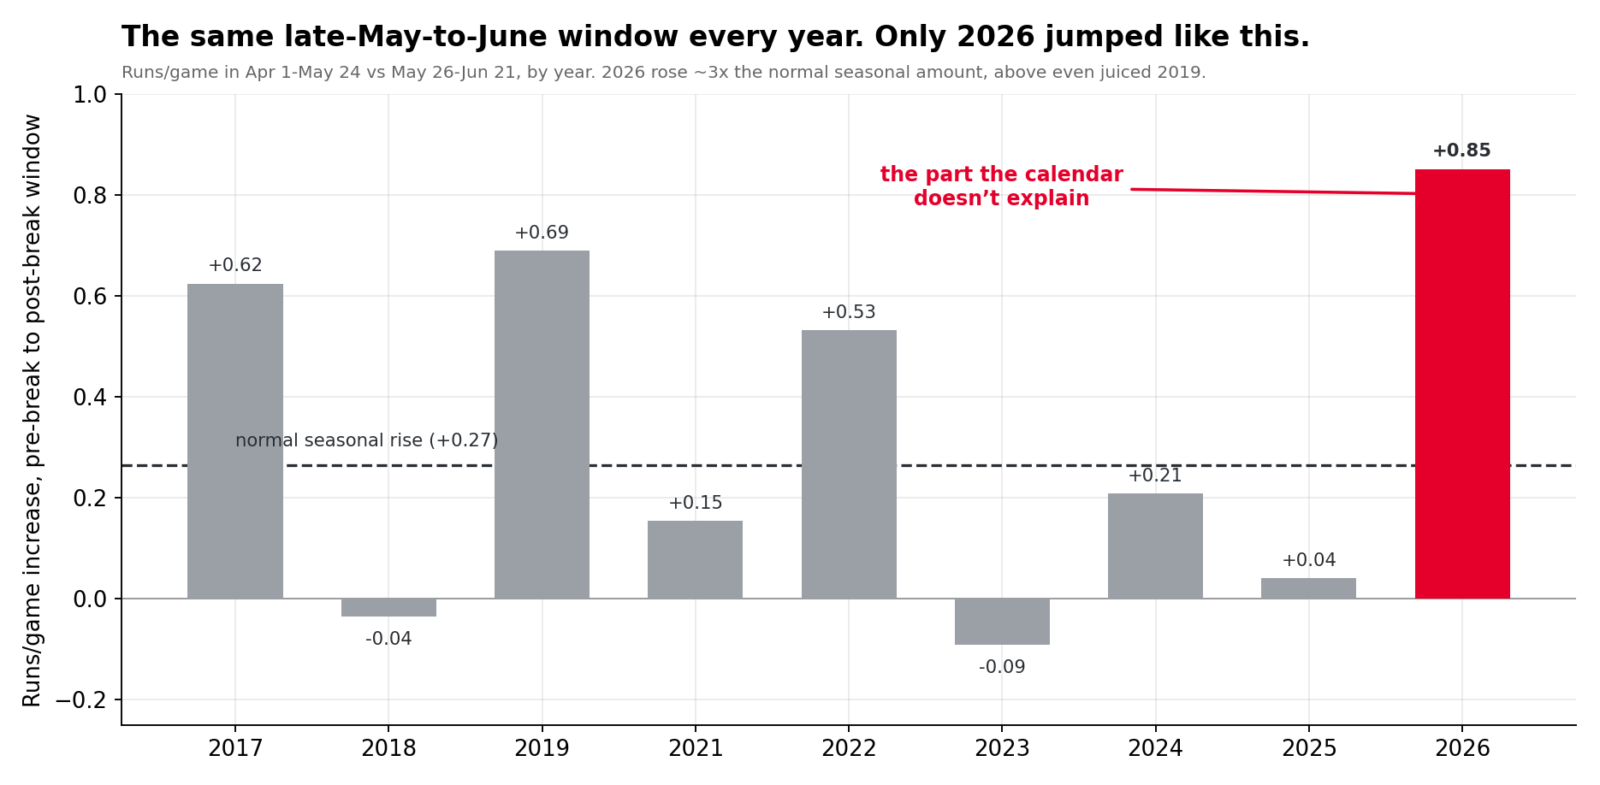
This season's pre-break-to-post-break scoring jump of +0.85 runs per game is the largest in the sample, roughly three times the normal seasonal rise.
Per-team runs per game have increased from 4.55 in April and 4.30 in May to 4.77 in June, the highest single-month mark since 2019.
The May-to-June increase (+0.47 runs) is also the largest individual month-over-month increase in the sample (average +0.14 runs).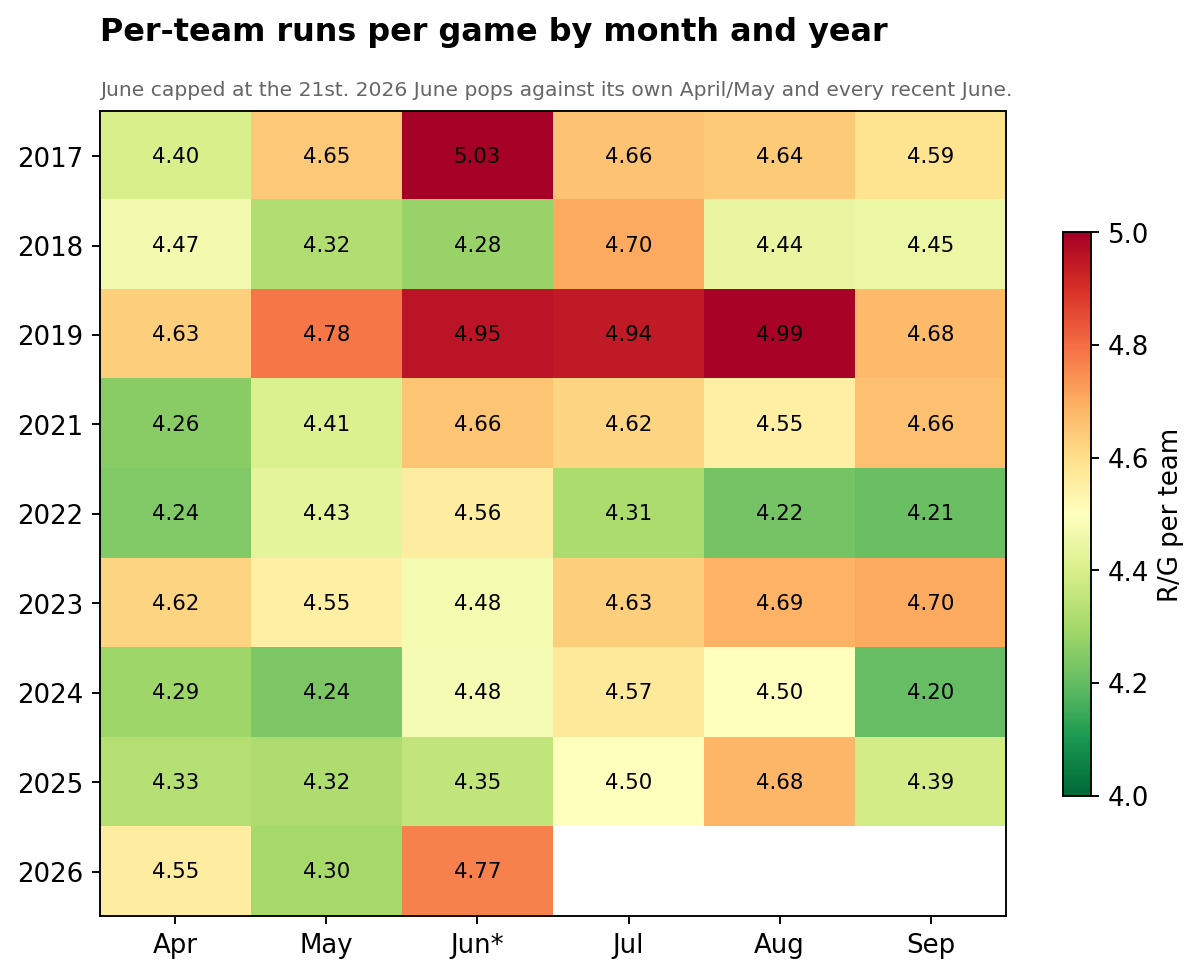
Totals Markets Quickly Adjusted
A livelier ball means more runs, which should mean more overs.
It did, briefly, before the market corrected.
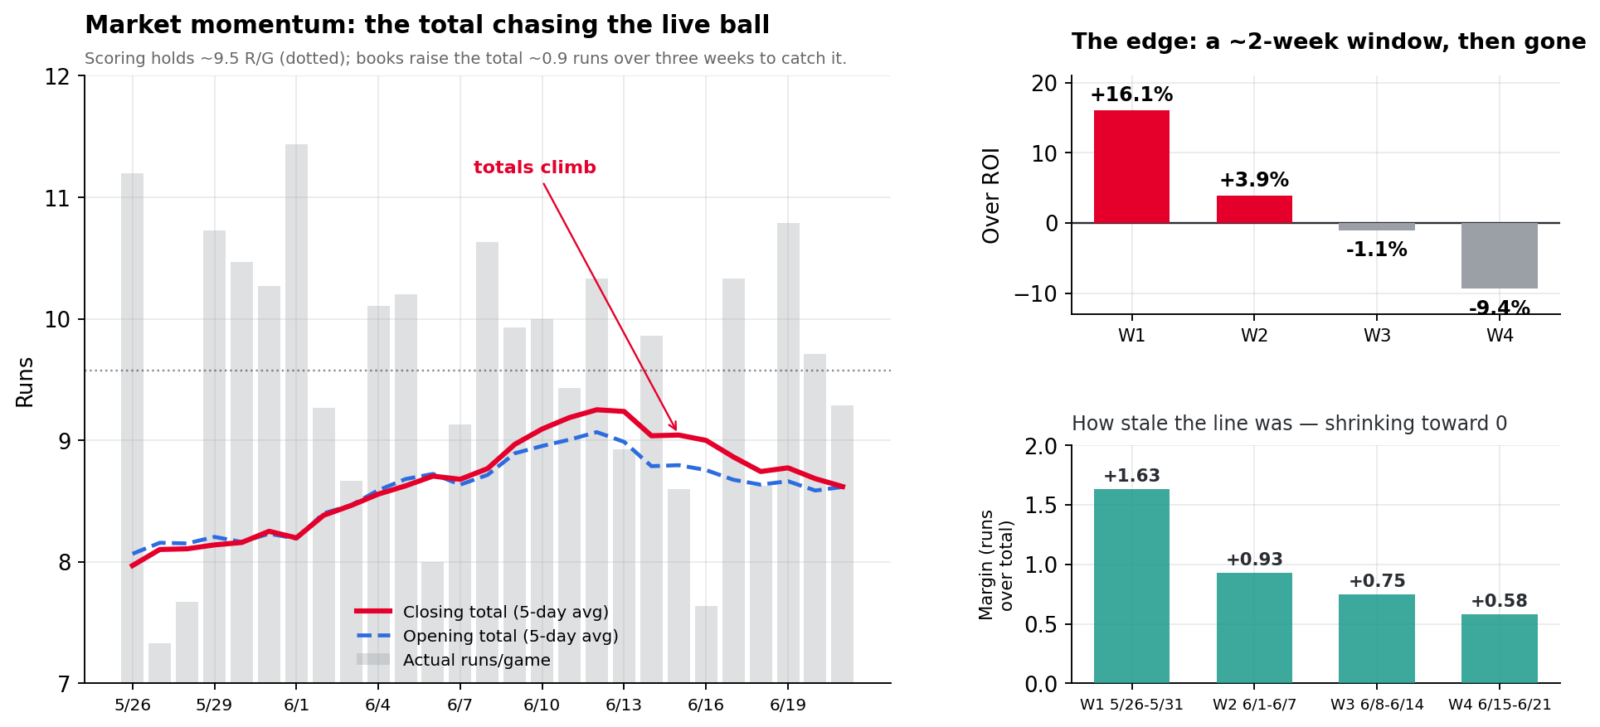
In the first week after the ball changed, totals were still set for the deadened ball (average close 8.2), and overs crushed, as teams averaged more than 9.5 runs per game.
Over the next three weeks, the books raised the closing total roughly a full run (from 8.2 to 9.1) to catch the livelier ball, and the over edge evaporated, going negative by mid-June.
Scoring never dropped, as it has sat near 9.5 runs a game since late May. But the market eventually corrected, and lagging over bettors paid the piper.
The market adjustment is an independent confirmation of a fundamental change.
My projected totals increased by a half-run from April and May to June with higher weather adjustments, and the betting market initially matched that increase.
But the market then repriced in an additional half-run of scoring, with no explanation as to why it was adjusting (in some cases) away from good pitching weather.
The midseason change brought roughly 10 days to two weeks of genuine edge on overs before a sharp, high-limit market absorbed that information and adjusted back.
If average barrel distance either reverts to prior levels or increases further again, expect a similar short window for directional actionability, and monitor the daily gap between opening and closing totals as the tell that the market has caught up to new information.
The edge for increased scoring no longer lives in game totals, which are seemingly efficient again.
It potentially lives in the slower, lower-limit markets that don't reprice off daily results (player home-run props, season-long home-run over/unders, and futures), which are still anchored, in places, to a deadened-ball era that may have been killed off weeks ago.

Actionable Conclusions
MLB's batted-ball carry shows a sudden and clear increase beginning on May 25, 2026.
After April and much of May sat at the suppressed 2023-to-2025 "dead-ball" level, carry, home-run rate and offensive output jumped toward the 2015-to-2019 "juiced-ball" territory and have held there.
Based upon a 10-year data sample, weather can only explain half of the impact — seasonal warming is worth four to six feet of carry, but not 10.
The mechanism is drag, not COR: exit velocity did not rise (it slightly fell), so the ball isn't bouncier. Instead, it carries farther through the air at the same batted-ball trajectory than it did earlier in the season (even after factoring for weather).
The data support a relatively uniform switch, not multiple batches of baseballs coexisting.
The pattern is consistent with a lower-drag ball entering play in late May 2026, most plausibly a new manufacturing batch (likely with lower seams) replacing deadened inventory.
Drag doesn't fluctuate this way on its own (weekly carry only fluctuates around three feet), so a sustained 10-foot increase means random fluctuation is highly unlikely, especially when that's double the typical weather impact from April to June.
Only lab testing of game-used balls from before/after May 25, 2026, can settle what actually changed, but barring carry distance reversion, the home-run-to-flyball rate may move closer to 15%, as scoring will increase further when the heat peaks in July and August.
I'll continue to monitor barrel carry on fixed contact on a week-to-week basis. If the carry distance trends back toward 380 feet, in the peak of the summer, we'll know the deadened ball has returned (or never fully disappeared).
But if it holds near 387 or climbs, we'll have to accept the reality of a potentially elevated run-scoring (and home-run hitting) environment at the sport's highest level.


