


On July 3, 2026, Vladimir Putin staged a televised meeting with his commanders and announced that Russian forces had seized Kostyantynivka, the southern anchor of Ukraine's fortress belt in Donetsk Oblast. Within hours, the Polymarket contract asking whether Russia would capture the city's railroad station by July 31 spiked from roughly 28% to as high as 62%.
The next day, President Zelensky called the claim "just another Russian lie," the Ukrainian General Staff said the 19th Army Corps was still conducting defensive operations inside the town, and the contract collapsed to 25%. As of Monday morning, July 13, it trades at 41 cents.
The spike-and-reversal swing is the story, and it reveals the trade. This market resolves on one thing, the ISW map, and that map has spent the entire spring refusing to show what the market is pricing. No claim from either capital pays until the map moves. Across four nested deadlines, the analysis finds fair value far below the market at every horizon.
Enter Polymarket promo code ACTION during registration after tapping the link below, deposit $20, claim a $50 trading bonus, and take your position.
Will Russia Capture Kostyantynivka? Polymarket Odds
What Actually Pays
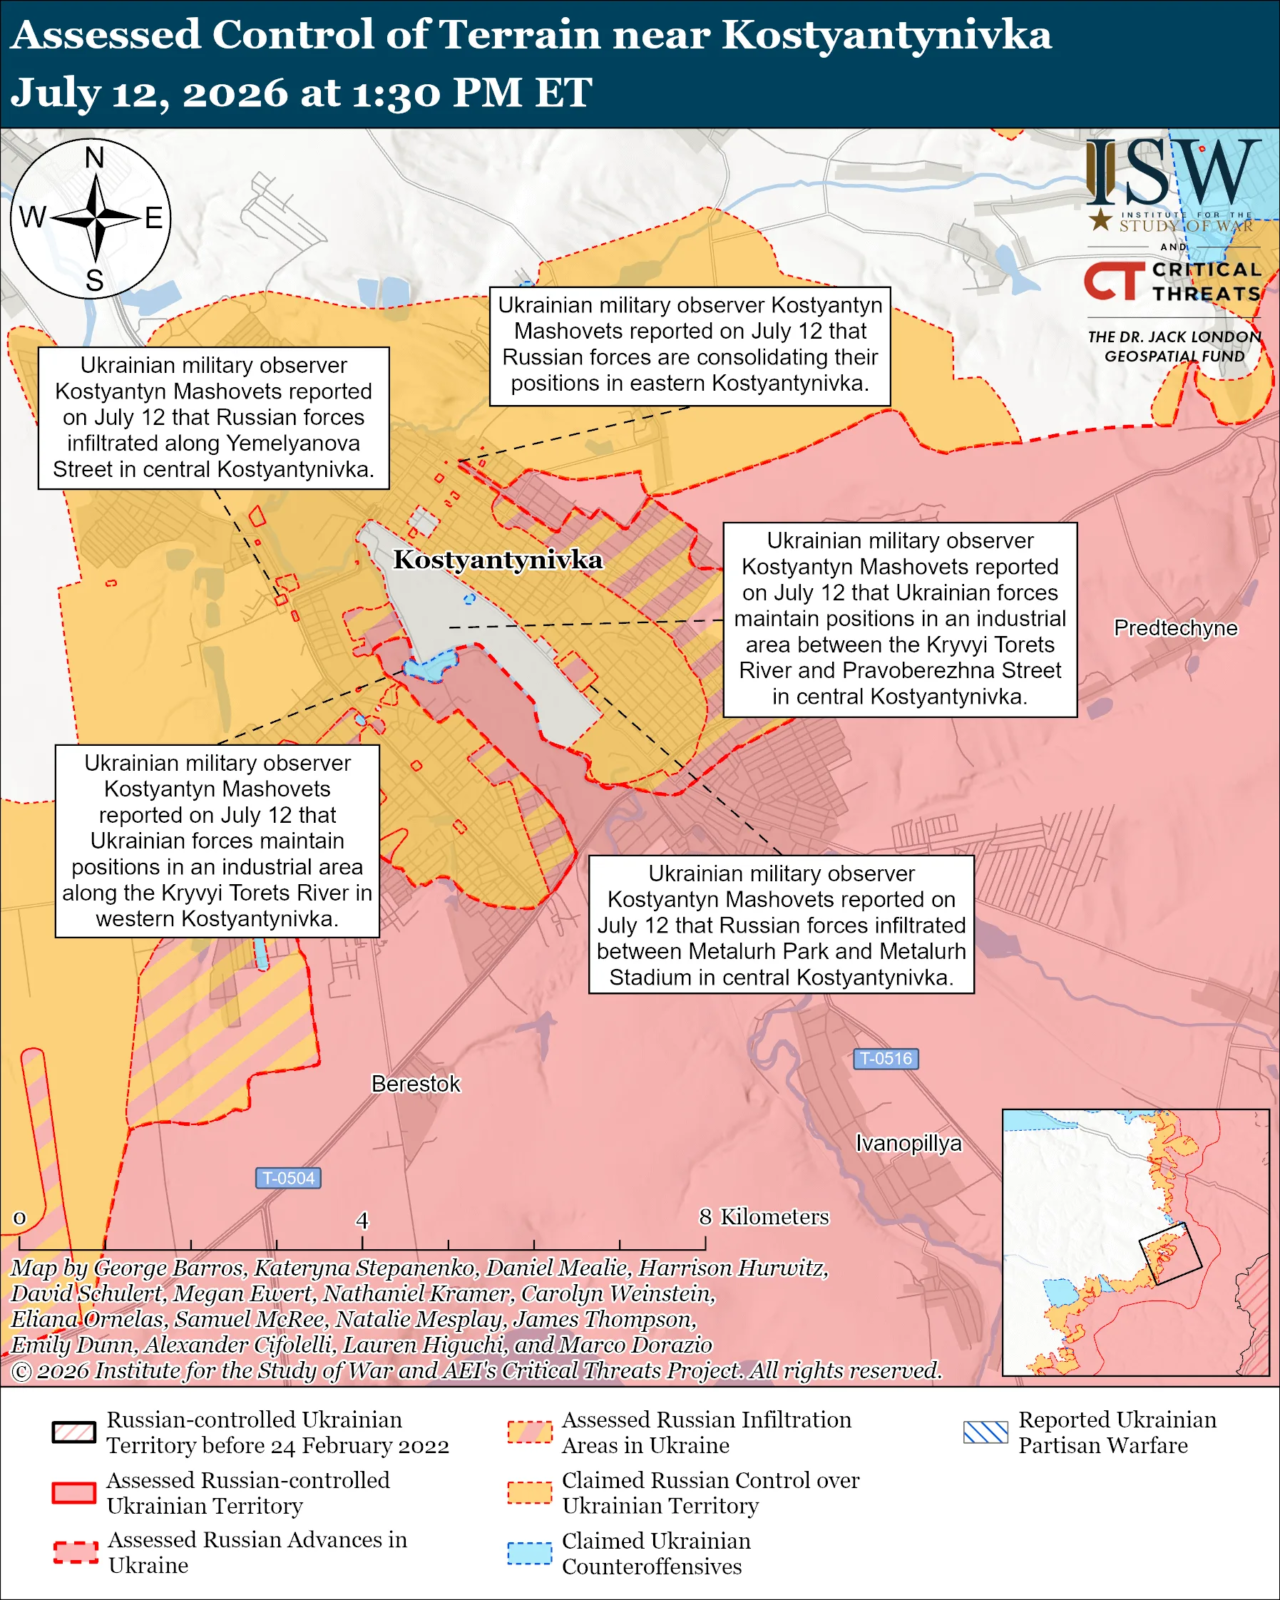
Each deadline resolves YES if, per the Institute for the Study of War's map, Russia captures the Kostyantynivka railroad station on Pravoberezhna vulytsia by 11:59 PM ET, meaning any part of the station icon is shaded under "Assessed Russian Control," "Assessed Russian Advance in Ukraine," or "Assessed Russian Gains in the Past 24 Hours," with the shading persisting through the next full ISW update cycle (daily). A negotiated settlement resolves YES only on actual physical control, and a later Ukrainian recapture does not reverse the resolution.
One layer, "Assessed Russian Infiltration Areas in Ukraine," is explicitly excluded, and that exclusion is a crucial aspect of the rules. ISW currently characterizes the Russian presence around the station as infiltration (soldiers slipping between buildings in groups of one to three). Infiltration does not resolve YES.
That market structure makes the event a two-step chain. Russian forces must establish real, non-infiltration control of the terrain under the station icon, and ISW must then render it under a qualifying layer before the deadline. Fair value at each horizon is the first probability multiplied by the second, built from battlefield evidence before any look at the market price.
The Ground Truth
ISW's July 1 assessment found that Russian forces maintain a presence (advances and infiltrations combined) in 36.98% of Kostyantynivka, with 76.73% of those gains made in June alone, while also noting that they "have not secured control over or established enduring positions" in much of that area. Three weeks earlier, its figure was 12.69%, and its June 10 assessment recorded that the railway station itself had not been seized and that Ukrainian troops had cleared infiltrators from Dovha Balka southwest of the city. The gap between claim and map is an established pattern. Gerasimov, Russia's Chief of the General Staff, claimed 50% of the city on December 18, 2025, when ISW assessed about 5%; Putin claimed 96% on June 29 and full capture on July 3, both of which were rejected.
ISW's July 4 assessment noted the Russian Defense Ministry published at least 10 flag-raising clips in a day, that some footage may be AI-altered, and that it has observed no Russian vehicles, mortars, or tube artillery operating inside the city, the evidence that would indicate real, qualifying control. Ukrainian sources counted 100-250 Russian soldiers inside as of mid-June, fewer than the Ukrainian troops present as of June 23. On July 5, per Al Jazeera, Moscow offered a local ceasefire to allow its control to be verified, but Kyiv rejected this as theater.
The physical tempo says largely the same thing. A CSIS analysis from July 1, 2026, measured the advance at Kostyantynivka at roughly 50 meters per day, among the slowest recorded for any military in a century, and ISW's June total of 30.42 square kilometers city-wide works out to about 1.01 square kilometers per day.
Two Russian tactical groups are converging on the station, per military observer Kostyantyn Mashovets (June 10), with forward elements roughly two kilometers apart, and Ukrainian analyst Serhiy Hrabskiy reported in early July that Russia has committed an additional 11,000 troops to the axis. Russia missed its own May 2026 deadline for the city, and CNN reported June 24 that the Kremlin has now set September for the Donbas, a target ISW assesses as unlikely to be met.
The best historical yardstick is Pokrovsk, the fortress city Russia most recently took, and the comparison that DeepState, the Ukrainian open-source intelligence project, itself draws. That campaign lasted 21 months and covered 39 kilometers, from the fall of the neighboring city of Avdiivka in February 2024 to ISW's confirmation of the capture of Pokrovsk between December 2025 and February 2026.
Reading the Market
The July contract sat near 28% on July 1, the same day ISW published the 36.98% presence figure and called the gains gradual and creeping. It touched 62% on the July 3 claims, fell to 25% on the July 4 denials, and sat near 26% on July 11 as Ukrainian troops inside the city confirmed ongoing battles. It has since drifted back to 41%. The back months moved on the same news with smaller amplitude, September running from 75% to as high as 92% and December holding an 83-95% band.
The autopsy verdict is that the near leg repriced violently on declarations its own resolution source rejected within 24 hours, then retraced half the move, while nothing on the ISW map changed. The July leg half-learned the lesson, but the back months have not, and that is where the mispricing of the nested markets now concentrates.
Building Fair Value
The physical-control probability climbs steeply across the curve, from 0.16 in July to 0.72 by December. The station sits at the live edge of ISW's assessed Russian zone in the city's east, and an 11,000-troop commitment grinding at 50 meters per day still accumulates ground. Over six months, Russian soldiers physically holding the small patch of ground the station icon covers on the map is more likely than not.
The recognition probability is the binding constraint and rises only gradually, from 0.45 to 0.78. ISW has held the station at the infiltration layer all spring despite Russian forces being adjacent since June and two rounds of Kremlin capture claims backed by a flood of flag footage, and its stated standard requires consolidated positions, the kind demonstrated by vehicles and artillery operating openly, before it upgrades. Even with Russian soldiers physically holding the station by late July, ISW crediting it in time, and the shading surviving a full update cycle, is closer to a coin flip.
The ladder rises in order: 7, 20, 34, 56. It has to, since each later deadline includes every path to the earlier ones, and the estimates respect that. An external anchor exists for the far leg. FutureSearch forecasting put December at 75% in June, describing the station as sitting on the leading edge of the axis and emphasizing a lenient touch criterion, any red shading on the icon.
The 19-point gap relative to this estimate is almost entirely due to the infiltration exclusion, which the touch framing ignores; red from the infiltration layer touches nothing that pays. The 56% point is held, the top of the band is treated as live, and December is sized accordingly.
The Shape of the Curve
Converting cumulative probabilities into conditional monthly odds, each window's increment divided by the probability the event has not yet happened, with July prorated to its remaining 0.6 months, sharpens the disagreement.
This analysis's curve rises to a September peak and eases, the signature of a consolidation grind capped by recognition lag and by the Ukrainian drone interdiction that DeepState credited on July 5 with preventing consolidation. The market's curve is a flat plateau above 50% per month for three straight months, which amounts to a bet that ISW flips the station off the infiltration layer in almost any given month.
That is hard to reconcile with an institution that has held the line all spring, on a battlefield where the constraint is no longer distance.
Stressing the Numbers
The recognition assumption is the softer judgment, so the stress test makes it harder. Each adverse step simultaneously adds 10 points to the physical-control probability and 15 points to the recognition probability, and a position survives as long as its edge over the market remains above 3 points. From August onward, the recognition assumption dominates the result; on the December leg, a 15-point recognition error alone moves fair value by roughly 11 points against 8 for the physical assumption, which is the whole logic of the trade. Recognition is the swing variable.
Conviction is decomposed rather than asserted, scored across four components on a scale of 1 to 10, with 10 the strongest. Data quality measures how hard the underlying facts are; it scores 6 at every horizon, hard-sourced map state and axis reporting held back by two ISW penetration figures that tripled in three weeks and an unpublished map shading threshold. Model confidence measures how well the two-step chain fits the actual resolution mechanics; it runs 6-7, peaking in August, when the causal chain is tightest.
Completeness measures how much of the picture is captured; it runs 5-6, the residual unknown being ISW's exact trigger for moving the station off the infiltration map layer. Robustness carries over from the stress table, and the overall grade weighs the four together.
Sizing and Execution
July is half-sized despite the headline gap because it is the leg most exposed to a single ISW map update flipping the station inside a short window, and its stress profile is the weakest. August and September carry the largest edges and the strongest stress performance, over horizons where the recognition lag works for the position rather than against it. December is half-sized for its thin stress margin and for the settlement tail, since a ceasefire freezing the line with Russian forces physically holding the station resolves the far leg YES. Liquidity shapes execution.
Volume over the past 24 hours runs about $188,000 on July, $24,000 on August, $314,000 on September, and $1.06 million on December, against roughly $7.8 million across the series. August pairs the second-largest edge with the thinnest book, so patient order-working matters more there than anywhere else on the curve. September is the best liquidity-adjusted single leg and the best single-leg expression of the thesis.
The Curve Trade
Both ladders rise consistently from near to far, so the disagreement lives in the increments.
The market pays 2.4x fair value for the July-to-August increment, agrees on the August-to-September slope, then prices the final quarter at a third of its worth. The cleanest hedged expression pairs the August 31 NO with a December 31 YES. The combination is a bet on timing rather than on the capture never happening.
If Russia takes the station eventually but later than the market expects, which is exactly what this analysis projects, both legs pay. If the read on ISW's caution turns out wrong and the map upgrades early, the December YES caps the damage on the August NO. And because the market prices the September-to-December window at a third of its estimated worth, that insurance leg is being sold cheap.
What breaks the position?
The case against the NO side runs through the map itself. The station icon needs only a few hundred meters of qualifying red creeping from the assessed Russian zone in the city's east, and a single well-geolocated push could trigger the upgrade; that is why July is half-sized and why the ISW map warrants a daily check through each deadline. The 11,000-troop commitment could compress the physical timeline, or the drone interdiction currently braking Russian consolidation could degrade. The Kremlin's reported September deadline guarantees maximum pressure on both full-sized legs.
A settlement freezing the line with Russia holding the station takes out the December leg. And the map itself is moving fast enough, penetration figures tripling in three weeks, that each fair value should be read as its full range rather than as the single midpoint number. A situation changing this quickly can land anywhere inside the band, so sizing should assume the end of each range as the least favorable to the position.
The Verdict
The early-July surge across this curve was manufactured in Moscow and priced by traders reacting to headlines their own resolution source was rejecting as they traded. The near contract has been half-corrected. The back months are still carrying the claim. The map that settles these contracts has one standard, consolidated control, and it has not budged. Until it does, the analysis is a seller of the capture at every deadline, at full size where the curve is cleanest, in the middle.


