


If you want more Action Network content, be sure to add us as a preferred source on Google.
Hi! I'm Sean Zerillo, Action Network's Senior MLB Analyst, and this post will house my playoff futures models, powered by our new PRO baseball betting tool, B.A.R.T.O.L.O.
Below, you can check out my team projections from three different models:
(1) Game Sim is a Monte Carlo simulation of my game-by-game projections that power B.A.R.T.O.L.O. for Action PRO; it is the sole basis for my projected game and series odds, but one of three futures projections provided below;
(2) Playoff Fit is a fairly simple but thoroughly backtested futures model built at the team level off archetypal data points that have correlated to playoff success in the bat tracking era;
(3) Composite is an equal-weight futures blend of several independent forecasts (PECOTA, FanGraphs, ATC, THE BAT, OOPSY) alongside my own Game Sim and Playoff Fit models.
These projections will update daily, and you can use them to identify edges in these team futures markets.
Additionally, you can get all this and more by checking out Opening Pitch, which houses the official B.A.R.T.O.L.O. model — that's where you'll find my daily projections and live input data for every MLB playoff game.
Playoff Fit
The Game Sim projections and Composite models are fairly straightforward; the former is powered by B.A.R.T.O.L.O. projections and the latter by an average of five public sources and my own two models.
I wanted to explain the work that went into the Playoff Fit model because I found the research most illuminating and distinct from the herding of public projection models (which my own simulation also tends to align with).
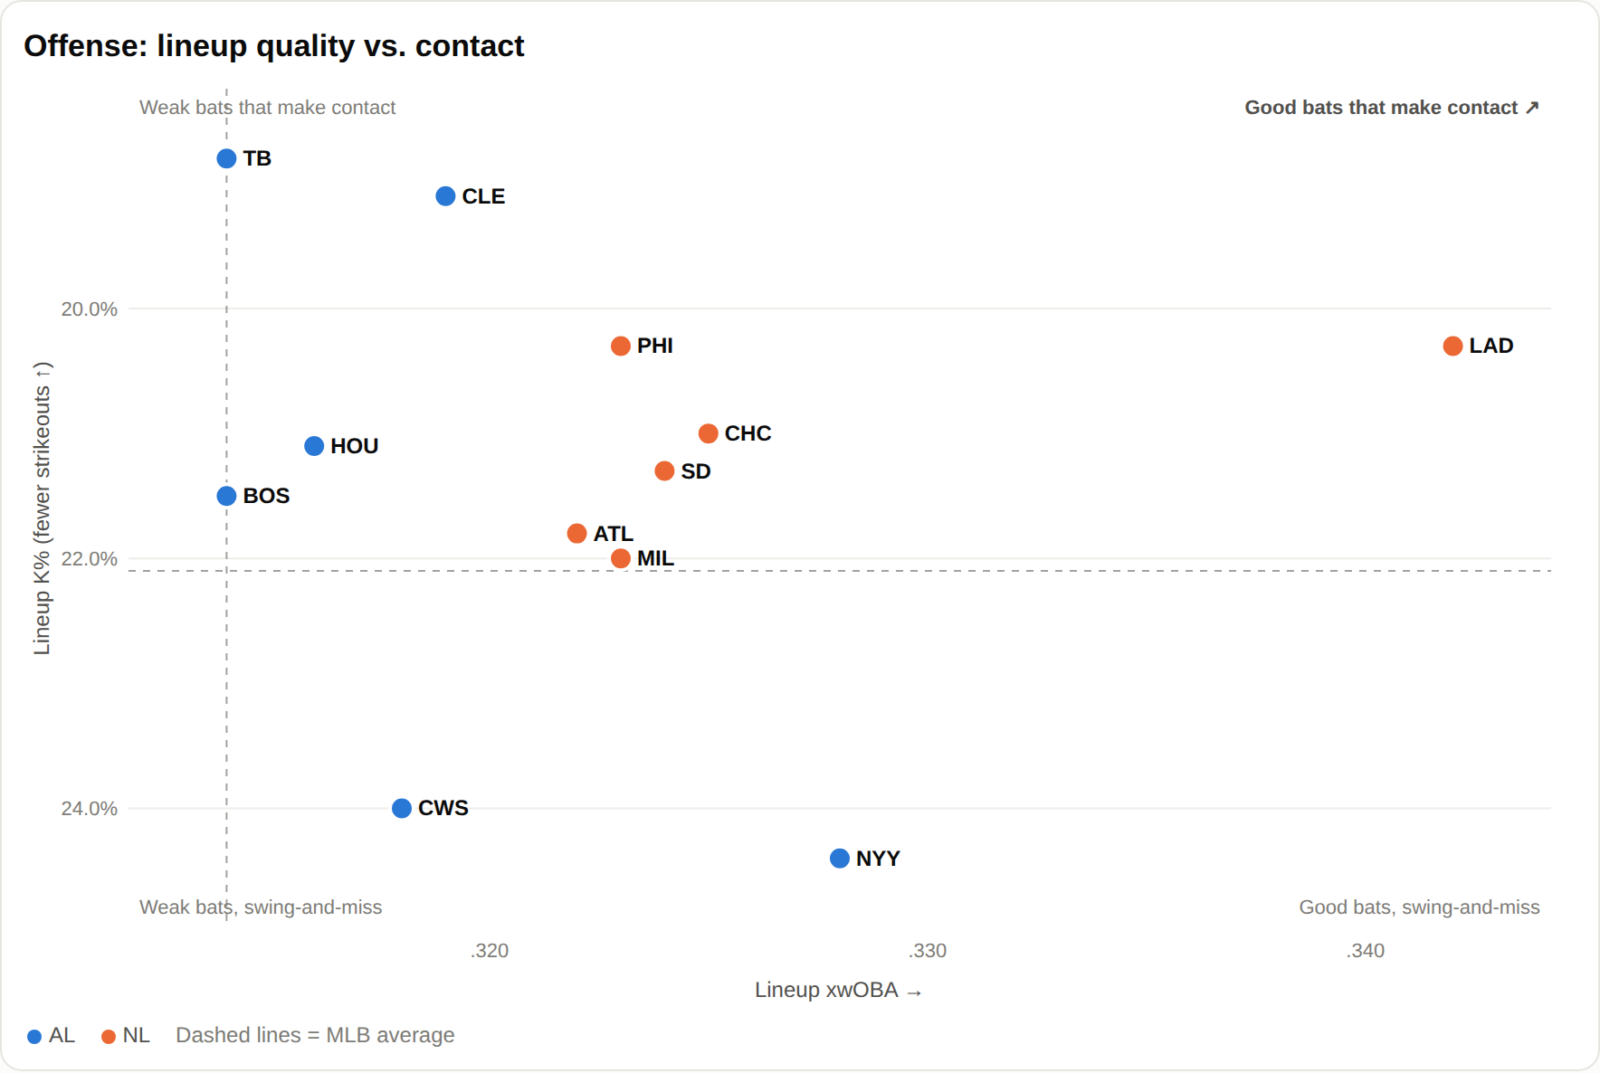
I backtested each playoff series since 2016 against every possible metric I could evaluate, calibrated my findings to series market prices, and found that four data points correlate with predicting who wins a postseason series more often than the betting odds suggested:
- Expected wOBA or xwOBA (lineup quality)
- Offensive Strikeout rate or K% (putting the ball in play is more important against good pitching in colder weather)
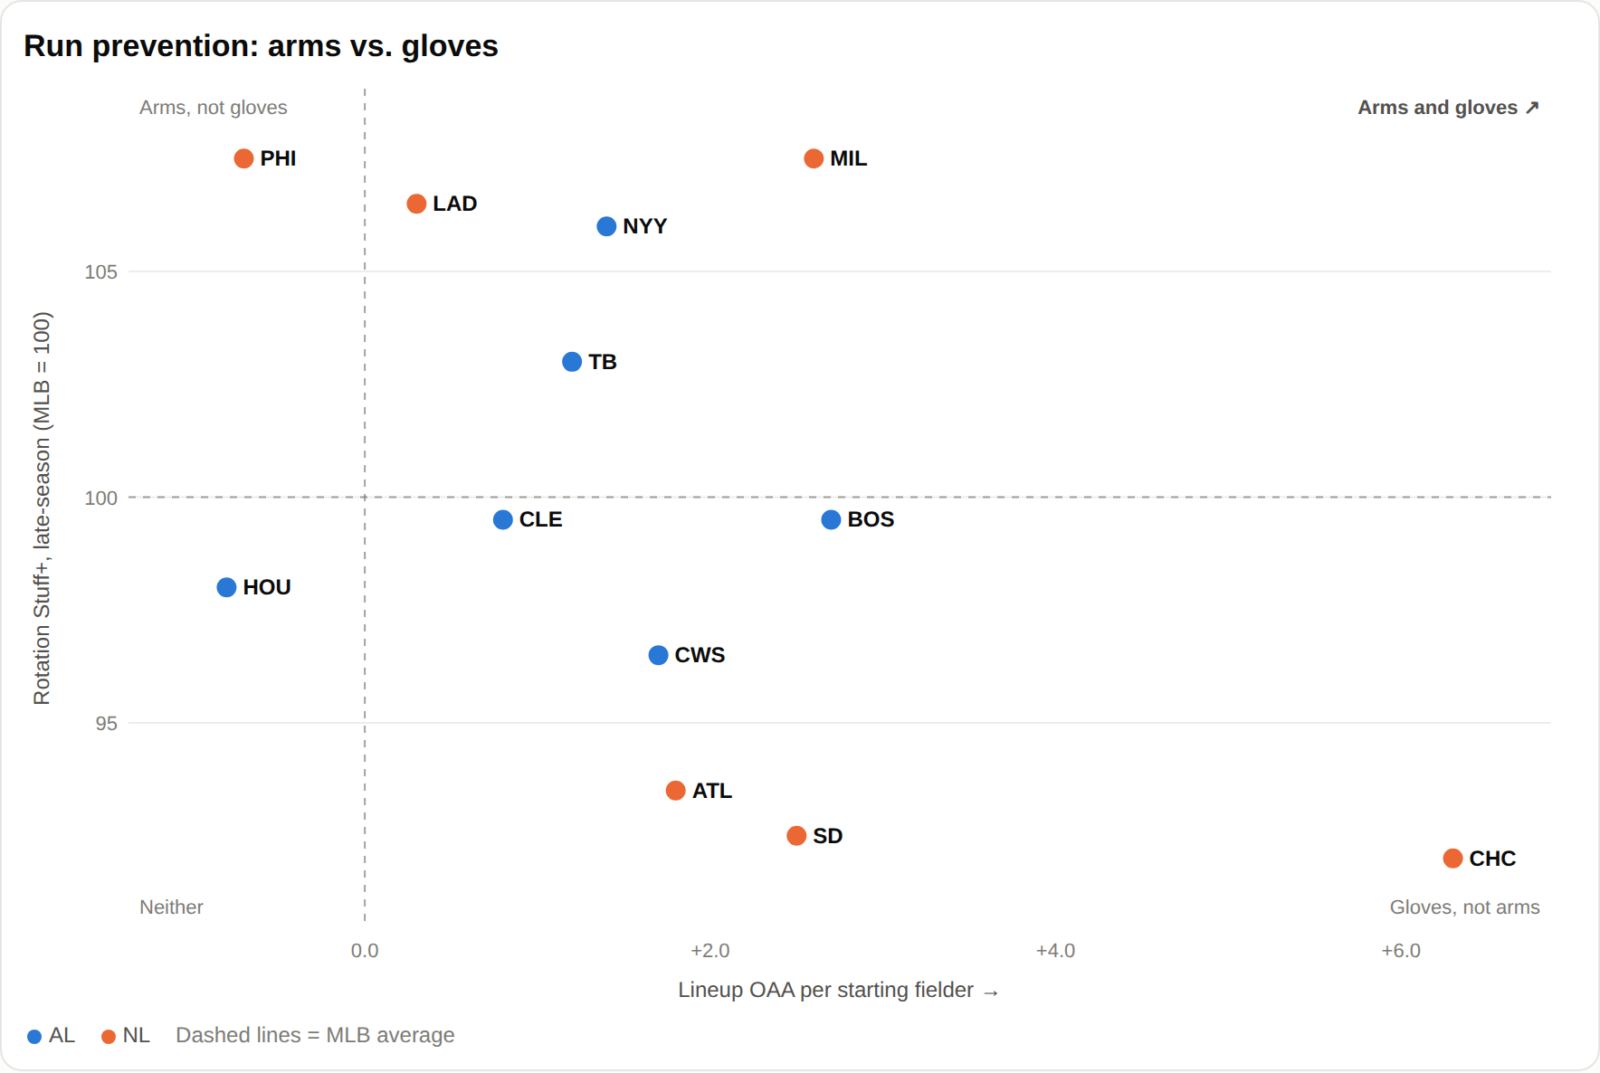
- Outs Above Average (defensive quality)
- Stuff+ (late-season weighted)
It's not that other data points do not matter, just that they are accurately priced into the market. Whether you believe in or see value in any of the following – bullpen quality in particular, but also clutch hitting and RISP luck, one-run record and Pythagorean luck, momentum, experience, having a bye – none of it adds additional value to predicting a series once you isolate the four data points listed above.
I tested bullpens every way I could think of (season, last 30 and 60 days, top three arms, leverage, K-BB%, Stuff+, weighted by actual October innings) and nothing held up. In fact, the team with the better regular-season bullpen has won around half of all playoff series since 2016.
Moreover, breaking some of these stats down into component parts – such as, for example, z-contact, whiffs vs. 95+ mph pitches, secondary pitch whiff%, chase rate, etc., instead of K% – the simpler data points won out over any component.
What's most notable about K% is that while it barely correlates with regular-season scoring, it trends upward in the playoffs along with the other component data points I mentioned, which further supports its usefulness.
This model lets us compare playoff fields from one year to the next and filter out the noise of a 162-game regular season with an unbalanced schedule.
Projection Models
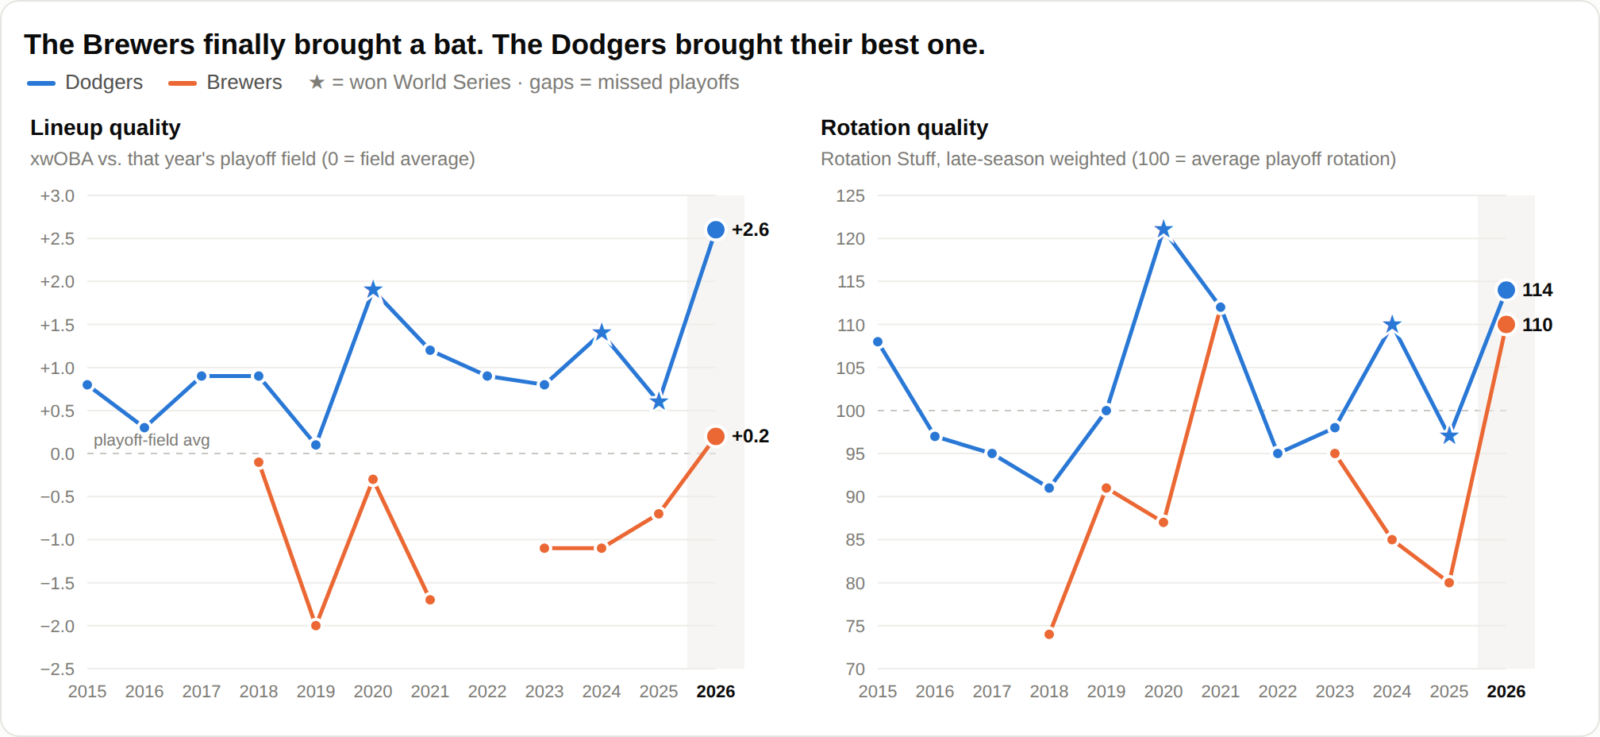
The Dodgers have the best and deepest starting rotation in the 2026 playoff field, alongside the best lineup, and their offensive quality vs. other playoff teams is the widest margin I measured in 15 years of postseason data, combining elite power with the lowest strikeout rate in the National League.
Every forecast has the Dodgers at or above the betting market for the World Series. Most simulations project them to win each of their three playoff series at just under 70% (-233 implied); the playoff fit projection pushes that number closer to 70% and makes them odds-on to win their third consecutive NL Pennant. They compare most favorably to the 2024 champions.
The Brewers are sending a better team than in prior seasons; every Brewers playoff lineup from 2018 to 2025 was below the field average, but this is the first to rank above it. Additionally, they have the biggest one-year rotation jump in the dataset; their 2025 starting staff was one of the worst in the data sample, but Jacob Misiorowski and Logan Henderson rate as highly as any top-two starters in baseball (Dodgers included).
On a game-by-game basis, I'd expect to bet them against the Dodgers in the NLCS – my Game Sim model shows them as the only potential value bet in the NL; still, most projections think their bats overperformed, and their statistical playoff comps (2017 Yankees, 2022 Yankees, 2024 Phillies, 2021 Yankees, 2025 Phillies) have not performed well in October (combined 3-5 in playoff series; no titles).
The Cubsare sending back a team very similar to the one they had in 2025. Still, they also compare favorably to both the 2023 Texas Rangers and 2019 Washington Nationals – both of whom won titles with strong offenses and questionable run prevention. The Cubs' team defense is the best measured in my playoff dataset, and it isn't particularly close, but they also led MLB in runs, OPS, and ISO, while maintaining the second-lowest K% in the NL.
The Braves, Padres, and Phillies each have glaring weaknesses in their team profiles.
San Diego essentially has the same team as 2024 and 2025 but with better defense and a worse starting rotation. They can survive a short series with their bullpen, but should get exposed when their lesser starting pitchers have to eat innings in a five-game series. Their five best playoff comps (2019 A's; 2019 Braves; 2022 Mets; 2018 A's; 2022 Dodgers) went 0-5 in playoff series.
Atlanta has the worst starting staff of all of their playoff teams this decade, and aside from Chris Sale, they have the worst rotation in the field. Moreover, their offense was top-heavy and ultimately rated average. Playoff comps (2017 Cubs, 2018 Brewers, 2019 Braves, 2019 Athletics, 2024 Mets) went 4-5 in the postseason, but all three models are below market on the NL East champions, and they are my biggest fade from a Game Sim perspective.
I prefer Philadelphia among those three teams, especially if Jesus Luzardo can approximate his regular-season effectiveness. They can match the Dodgers starter for starter, and have an effective bullpen, but their defense (21st in Outs Above Average; 29th in Defensive Runs Saved) gives back some of their pitching quality.
Aside from the 2024 Dodgers, their playoff comps (2024 Padres, 2022 Blue Jays, 2025 Mariners, 2025 Padres) are 2-4 with a World Series title.
Turning to the AL, while I'm normally very high on the Rays — and gave out their preseason win total Over as well as recommended an AL East divisional bet — I think they are always built better for the regular season than the playoffs. Tampa Bay had the lowest strikeout rate in MLB, but they also finished 28th by xwOBA, and their rotation is thin behind Drew Rasmussen.
I don't see much difference between the Rays, Red Sox, and Guardians, and if the season were starting over, I would project those teams right around one another over 162 games, as I did in the preseason. Their playoff comps (2020 Astros, 2016 Giants, 2020 Guardians, 2017 Red Sox, 2025 Red Sox) are not particularly encouraging (3-5 in postseason series) for a one seed.
The Yankees' case depends entirely on the health status of Aaron Judge, who, despite his own optimism, seems likely to miss the Wild Card round if not the remainder of the 2026 season. Judge is worth around 5-8% to each series line, and his absence gives the Yankees a far less effective (though still very whiff-prone) lineup than they had last postseason.
Their rotation is better (second-best in the field; best in the AL), and they could use some starting-pitching depth in relief to boost their bullpen. Still, their playoff comps are 1-5 (2021 Yankees, 2025 Phillies, 2024 Phillies, 2022 Braves, 2025 Mariners); striking out often (24.7%; highest in the field) and playing below-average defense is not a recipe for postseason success.
The Guardians have the most improved profile in the AL. Their top two starters (Gavin Williams and Parker Messick) are significantly better than prior iterations of this club. Still, they had the best bullpen in MLB by K-BB%, and improved their offensive strikeout rate to second-best in baseball, while their offensive quality pushed closer to league average; both Patrick Bailey and Jo Adell posted a 102 wRC+ in the second half.
The emergence of youngsters including Travis Bazzana, Chase DeLauter, and Angel Martinez gives this Guardians club -which has ranked as the worst offense in several postseasons – a legitimate chance at scoring runs for a change, especially if Jose Ramirez can bounce back from an injury-riddled second half (66 wRC+).
The comps aren't flattering (2020 Astros, 2018 Cubs, 2023 Blue Jays, 2020 Guardians, 2023 Orioles), but the playoff fit and composite models like the Guardians more than the market, and my Game Sim model says they are fairly priced.
The Astros and Red Sox popped up as my biggest futures edges from the Game Sim model, and I like both teams to win their wild card series more often than the odds suggest.
Without Judge healthy for the Yankees, Houston has the best offense in the AL by projected wOBA, but they have the worst team defense in the league, and this is the worst defensive team (and team, in general) they've sent to the playoffs during the past decade.
Still, the Astros are on the soft side of the bracket and are five wins over the White Sox and Guardians away from making their 8th ALCS appearance since 2017. Their playoff comps (2022 Mariners, 2023 Marlins, 2018 Cubs, 2024 Orioles, 2025 Red Sox) are a combined 1-5.
Boston has the opposite profile, with the best team defense in the AL, but a lower-tier lineup without a high-end No. 2 starter. Their elite bullpen (3.78 xFIP; best in MLB) drives their optimistic Game Sim projection, but Playoff Fit has them as a fade because it pushes every bullpen closer to average and prioritizes offensive quality.
Comps (2018 Cubs, 2022 Mariners, 2018 Rockies, 2025 Red Sox, 2020 Brewers) aren't kind to anyone in the AL, and Boston did suffer numerous injuries near the season's end (Willson Contreras, Mickey Gasper, Anthony Seigler).
The White Sox are a bad fit from both a projection and playoff fit perspective; they have a bad rotation, are an average defensive team, and strike out far too often (26th in MLB). Playoff comps are 2-5 (2020 Brewers, 2018 Athletics, 2023 Phillies, 2020 Cubs, 2019 Braves), and all projections came in under market.
Edges and Consensus Against Market
Game Sim Likes:
- Red Sox AL Pennant (projected +398 vs. +650 listed): Tolle/Gray/Suarez is a highly competent 1-3 in a rotation, and their bullpen is elite. I make their series with the Yankees around a coin flip assuming Judge doesn't play, and I'd favor them against both the Rays and the Guardians.
- Astros AL Pennant (projected +604 vs. +900 listed): Easiest path, and offensive quality is the most important variable for Playoff Fit, but defense and starting pitching depth are likely their downfall.
Playoff Fit Likes:
- Dodgers NL Pennant & World Series (projected -118 and +132 vs. +130 and +225 listed): It's the biggest edge any model has on any team. The best lineup ever projected in a playoff field in a bat-tracking, plus one of, if not the best starting rotations. Playoff Fit only cares about roster shape, and the Dodgers' shape is the best in 15 years.
- Guardians AL Pennant (projected +294 vs. +360 listed): improved lineup (89 wRC+ in 2025; 92 in the first half of 2026 vs. 103 in the second half) and Williams & Messick elevate the top end of the rotation. Elite bullpen not even factored in here.
- Yankees AL Pennant (projected +285 vs +320 listed): only if Judge plays
Composite Likes:
- Dodgers NL Pennant & World Series (projected +109 and +197 vs. +130 and +225 listed)
- Guardians AL Pennant & World Series (projected +318 and +1076 vs. +350 and +1300 listed)
- Red Sox AL Pennant (projected +590 vs. +650 listed)
- Astros AL Pennant (projected +809 vs. +900 listed)
The Dodgers and Guardians are liked by both the talent model and fit models and survive the blended projection.
The Astros and Red Sox have Game Sim edges big enough that they still show through after five public projections water them down; still, it may be worth playing these teams series by series rather than investing in futures. I project an edge on both in their respective Wild Card series.
The Playoff Fit model is as negative on Boston (-6%) as the Game Sim is positive (+6.8%). Conversely, the Playoff Fit model likes the Yankees (+2.2%), but both the Game Sim (-7.3%) and Composite (-5.8%) agree to fade them.
Wild Card Round and Futures Betting Plan
The Wild Card series projections and Game 1 lines help to drive my decision-making as to whether or not to fire on Pennant or World Series futures or play teams on a game-by-game or series-by-series basis
Considering both the Dodgers and Guardians have first-round byes, I'm happy to lock in a Dodgers World Series ticket (to +200) and a Guardians AL Pennant ticket (to +300) after comparing my three projection models.
As for the Astros and Red Sox, I project value on both teams to win their respective Wild Card series.
However, since Houston is on the same side of the bracket as Cleveland, I'd prefer to bet on the Astros series price against the White Sox, and then to potentially roll over that wager into a series price against Cleveland if I show value there too (or bet that series game by game).
Ideally, I could structure a smaller bet on Boston (+700) and a larger bet on Cleveland (+360) to both win the AL Pennant. Still, you may get a better price rolling over the series lines, and considering the wild card series edge is bigger than their projected Pennant edge, I'd opt for the wager that offers better expected ROI.
Lastly, look to play exact World Series matchup props involving Dodgers-Guardians (projected +1005) or Dodgers-Red Sox (projected +1153)
Bets
- AL Pennant: Cleveland Guardians (+360, 0.5u), DraftKings; bet to +300
- World Series: Los Angeles Dodgers (+230, 1u), FanDuel; bet to +200
Follow me in the Action Network App for bet notifications, including sides, totals, and future additions throughout the playoffs.


