


The 2026 World Cup will be the largest in history, spanning three nations with 104 matches scheduled over 39 days.
While athletes are busy chasing world records on the court, a different (and significantly less athletic) milestone is set to be reached in the stands. This year, fans in arenas and living rooms worldwide are projected to smash a massive drinking record, with beer consumption expected to hit an eye-popping 14.4 billion beers.
To estimate the volume of beer that will be consumed, The Action Network utilized a bottom-up econometric model to quantify the "liquid economy" of the 2026 FIFA World Cup, based on the prior World Cup viewership and similar sports’ beer consumption rates.
Key Findings
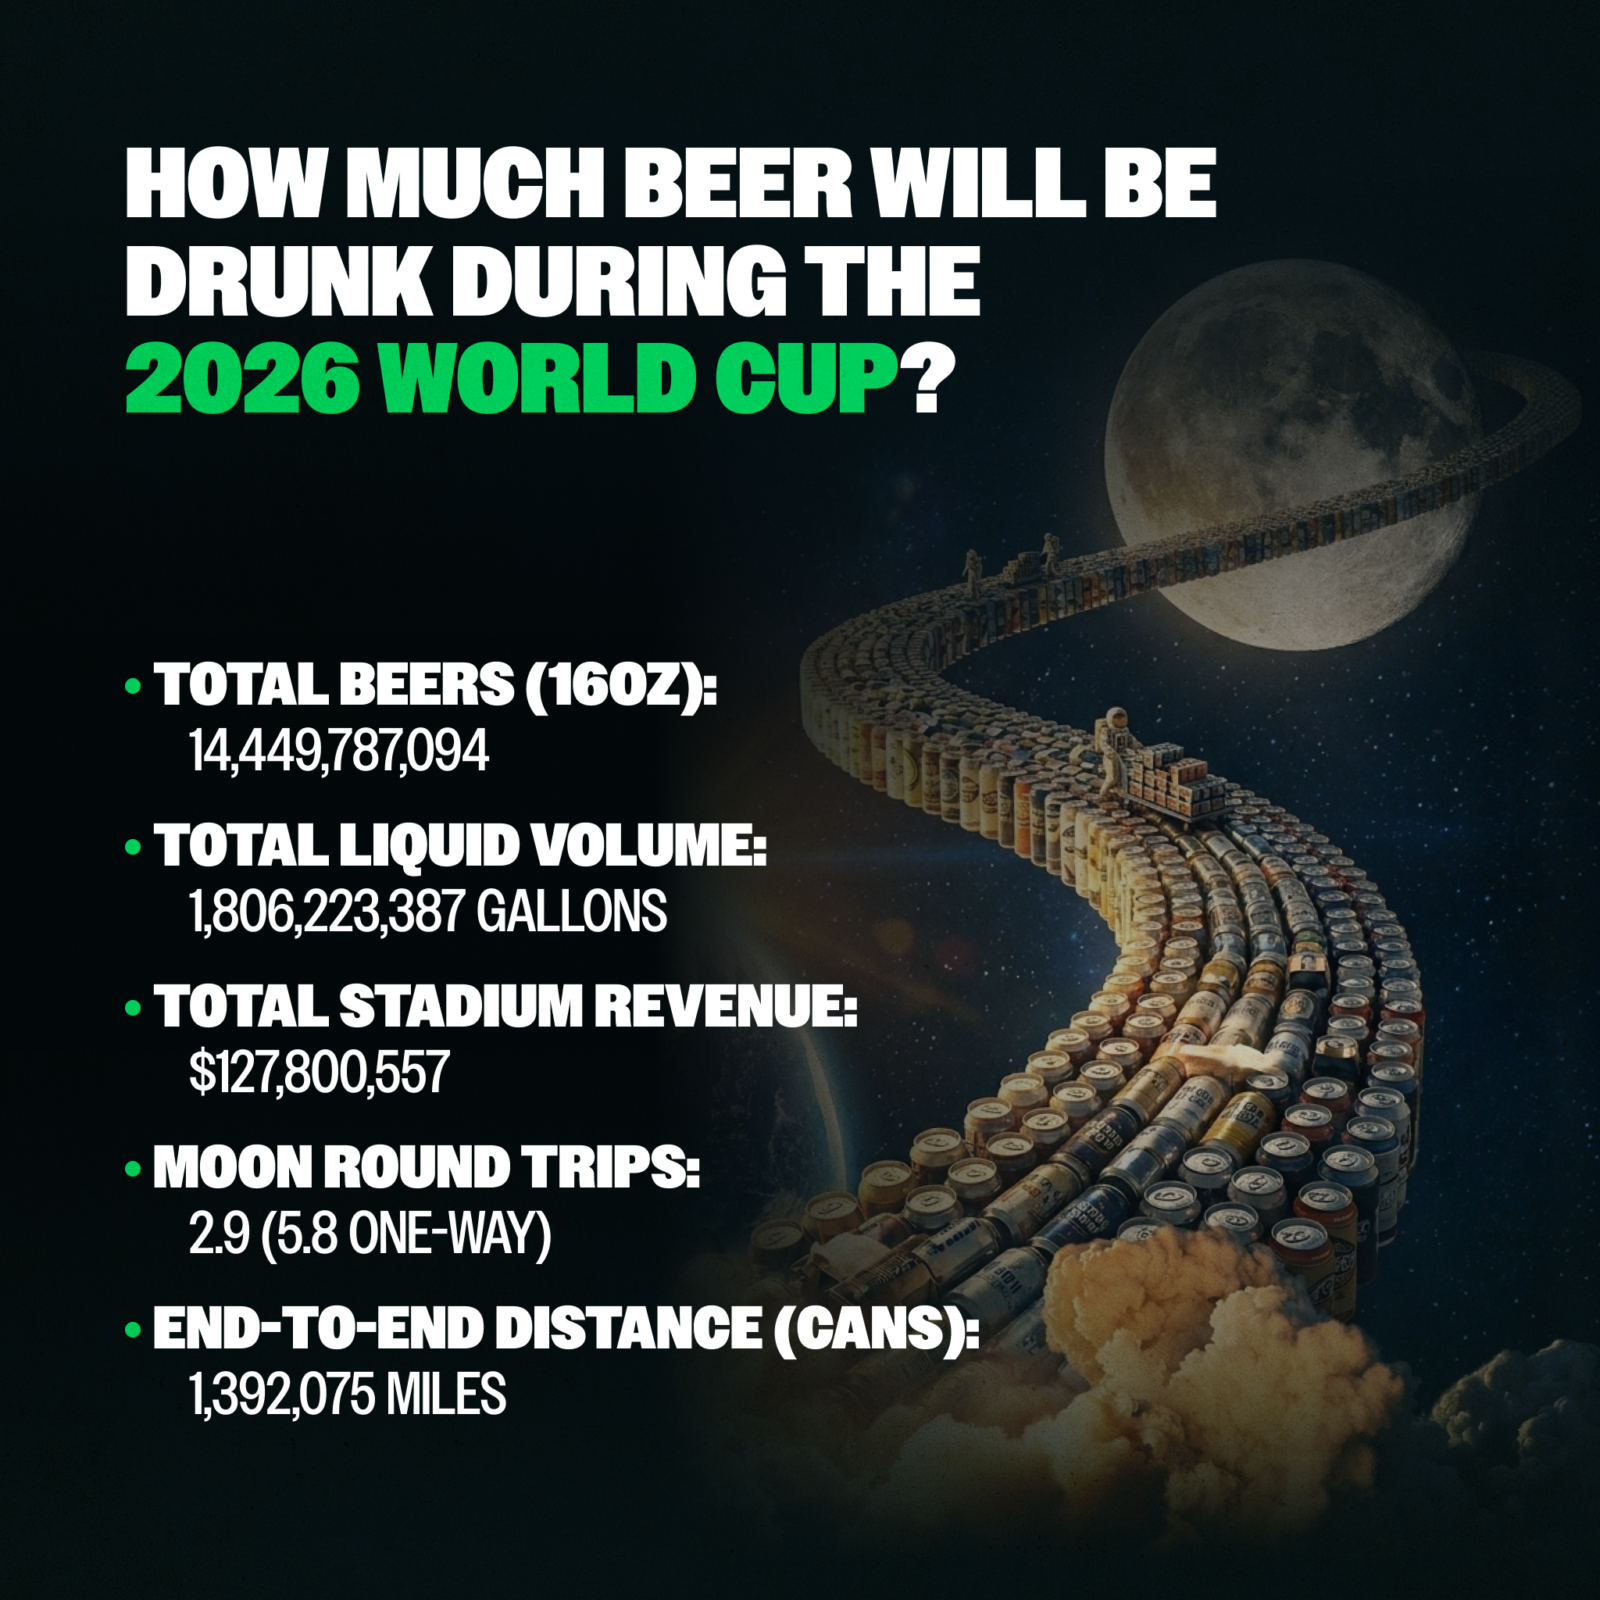
- The world is estimated to drink 14,449,787,094 beers during the 2026 World Cup, that’s 1.81 Billion Gallons.
- An estimated 16.7 million beers will be consumed in the stadiums alone.
- A standard 16oz can is 6.1 inches tall. Lined up end-to-end, these cans stretch 1,392,075 miles. That is enough to reach the Moon and back 2.9 times.
- Beer revenue inside the stadiums alone is projected at $127,800,557.
- New York New Jersey Stadium is the financial heavyweight, projected to generate $16.4 million in beer sales alone, largely driven by hosting the Final.
- Despite Mexico’s legendary football culture, the USA captures 88.6% of total stadium revenue ($113.3M) due largely to more expensive pricing.
2026 World Cup Beer Estimated Beer Consumption
The Staggering Amount Of Beer To Be Consumed
When we move beyond the dollar signs, the physical reality of the 2026 World Cup's thirst is truly staggering. By standardizing every pour to a 16oz "tall boy," we can visualize the total consumption of 14,449,787,094 units in ways that defy local imagination.
- The Lunar Highway: If you lined up every 16oz can consumed during the tournament end-to-end, the line would stretch 1,392,075 miles. That is enough to reach the Moon and back 2.9 times. Essentially, the world will drink a 6-lane "beer bridge" to space.
- The Olympic Basin: Inside the stadiums alone, fans will put away 16.7 million pints. That volume would completely fill 3.5 Olympic-sized swimming pools. If you attempted to finish that stadium supply alone, you would have to drink one pint every hour for the next 1,900 years.
- The Global Reservoir: When we include home viewers, the volume explodes to 1.8 billion gallons. To put that in perspective, that much liquid could: Fill the Empire State Building to the brim 6.5 times, keep Niagara Falls flowing for nearly 40 minutes at its average rate, and cover the entire 68-acre pitch of the World Cup Final in a column of beer over 8,000 feet high
- The Final Sprint: During the New York New Jersey Final, the crowd will be drinking at a rate of 230 pints every single minute over a 24-hour window. By the time the trophy is lifted, that single stadium will have emptied enough cans to stretch from NYC to Philadelphia nearly four times.
The City Breakdown: Beer Consumption By Host City
Based on capacity and match allotment, here is the total beers estimated to be consumed at each stadium and total projected revenue:
| Rank | Stadium | Projected Revenue | "This Would Fill…" |
| 1 | New York New Jersey | $16,431,640 | 21% of the Great Lawn in Central Park (1-inch deep) |
| 2 | Los Angeles | $14,645,448 | 1.2 million standard Starbucks Venti cups |
| 3 | Dallas | $11,736,123 | 1.1 Olympic-sized swimming pools |
| 4 | Houston | $11,264,487 | The Mecom Fountain nearly 8 times over |
| 5 | Miami | $10,728,436 | The Venetian Pool in Coral Gables 1.8 times |
| 6 | San Francisco | $10,580,195 | Enough pints to line the Golden Gate Bridge 188 times |
| 7 | Atlanta | $8,726,111 | 1,300,000 iconic Chick-fil-A large soda cups |
| 8 | Philadelphia | $8,065,786 | A pint glass for every single step up to the Art Museum 13,000 times |
| 9 | Boston | $7,133,595 | Enough beer to recreate the Boston Tea Party 33 times over |
| 10 | Seattle | $7,026,094 | The International Fountain at Seattle Center 3 times over |
| 11 | Kansas City | $6,992,254 | Enough to fill the J.C. Nichols Memorial Fountain 10 times |
Interested in the odds on the game taking place in these stadiums? Check out this bet365 bonus code
The Revenue King (New York/New Jersey): New York/New Jersey (also known as MetLife Stadium, home of the Giants and the Jets) claims the top spot with $16.4 million in projected revenue. This isn't just about size; the stadium will host the Final, where high stakes drive consumption through the roof. To visualize that volume: the beer consumed here would cover the entire Great Lawn in Central Park an inch deep.
The "Price-Per-Pint" Powerhouse (Los Angeles): While Dallas pours more total volume, LA takes the #2 spot in revenue. Because of SoFi Stadium’s premium pricing ($10.49 per pint), it generates nearly $3 million more than Dallas despite selling 215,000 fewer beers. Those fans will drink enough to fill 1.2 million Starbucks Venti cups.
The Historic Pour (Boston): Traditional sports towns are bringing massive numbers to the table. In Boston, the total beer volume is enough to recreate the Boston Tea Party 33 times over, though the harbor would be full of lager this time.
The Mexican "Volume Gap" & The Bay: Mexico City moves a massive amount of liquid (ranking 10th in volume with over 905,000 beers), yet it ranks 15th in revenue due to fan-friendly pricing. Conversely, in the San Francisco Bay Area, the consumption is so high that a line of cans from Levi’s Stadium matches would stretch across the Golden Gate Bridge nearly 200 times, a literal bridge of beer for the Bay.
Concentrated Wealth & The North American Split: The top five stadiums (NY/NJ, LA, Dallas, Houston, and Miami) account for roughly 50% of the total revenue for the entire tournament. Overall, the USA captures a staggering 88.6% of all stadium beer revenue. Even with high-performing venues like BC Place in Vancouver, the sheer scale of the US market makes it the primary financial engine of the tournament’s direct sales.
Final Verdict: The 39-Day Global Marathon
To put this into perspective, the Super Bowl is a 4 hour, US centric event that drives huge beer consumption. The 2026 World Cup is a 39-day global marathon with 104 matches, not a one-day binge. Even relatively modest consumption adds up quickly.
The estimated 14.4 billion beers equals a hefty 1.8 billion gallons. That is enough liquid to fill 2,736 Olympic-sized swimming pools or build a "beer bridge" of cans that stretches to the Moon and back nearly three times. From the 230 pints poured every minute during the New Jersey Final to the billions of quiet toasts at home, the 2026 tournament is a logistical titan that, quite literally, reaches the stars.
The Methodology: How We Quantified the "World Beer Cup"
To measure an event as massive as the 2026 World Cup, we built a bottom-up econometric model.
Here is exactly how we calculated the 1.8-billion-gallon global thirst.
Phase 1: Estimating the "Active" Audience
We started by looking at the scale of the stage. Using official FIFA stadium capacities and the 2026 match schedule, we modeled the attendance for every single game.
- The 95% Realism Filter: While World Cup matches are expected to "sell out," mega-events rarely achieve 100% capacity due to VIP blocks, security cordons, and operational dead zones. We modeled a highly realistic 95% fill rate for every venue.
- The Global Broadcast Base: We didn't just count the people in the seats. We used historical viewership data from Qatar 2022 to scale our broadcast audience, ranging from a baseline of 140 million viewers for Group Stage matches to a staggering 570 million for the Final.
Phase 2: Modeling Fan Behavior (The "Stakes" Variable)
A fan watching a Group Stage opener drinks differently than a fan watching the Final. We moved away from flat averages and implemented a Dynamic Consumption Scale to reflect the psychological "stakes" of each match:
- Group Stage: 2.5 beers/person (The warm-up)
- Knockout Rounds: 2.8 to 3.0 beers/person (The tension rises)
- Semi-Finals & Final: 3.3 to 4.5 beers/person (High-stakes celebratory drinking)
For the billions watching at home, we applied a conservative, steady baseline of 0.85 drinks per viewer globally to ensure our 14.4 billion-beer total remained grounded in reality rather than hyperbole.
Phase 3: Standardization & Volumetrics
To make the data comparable across the USA, Mexico, and Canada, we had to pick a "Standard Unit."
- The "Tall Boy" Metric: We standardized all units to a uniform 16oz US Pint.
- The Conversion: This allowed us to precisely convert unit counts into total fluid volume ($V$) in gallons and liters. By calculating total ounces and dividing by 128, we arrived at our 1.8 billion gallon total.
Phase 4: Financial Revenue Modeling
The financial side of our study focuses strictly on direct match-day stadium operations. While home viewers contribute to the volume metrics, we excluded global retail sales to isolate the specific economic impact of hosting the matches.
- Venue-Specific Pricing: We integrated local stadium data (ranging from $2.04 in Mexico City to $10.49 in Los Angeles) to calculate the unique revenue potential for each host city.
- The Formula: $Expected Attendance \times Avg. Beer Per Person \times Local Stadium Price = Direct Matchday Revenue$


